
Sample Category Title
Trade Idea: GBP/JPY – Sell at 142.00
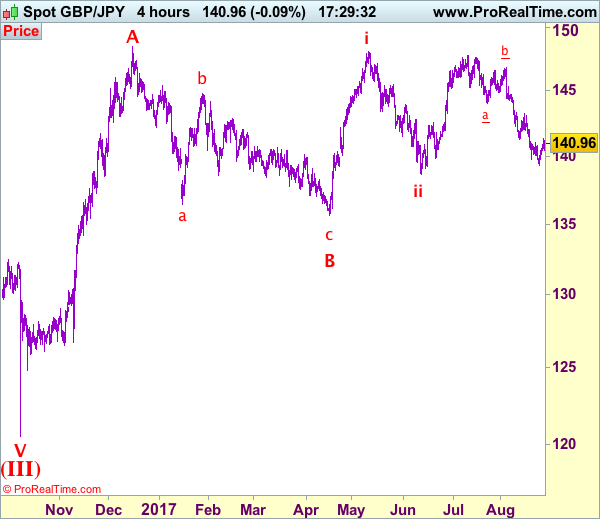
GBP/JPY - 140.92
Original strategy:
Sell at 141.40, Target: 139.40, Stop: 142.00
Position: -
Target: -
Stop: -
New strategy :
Sell at 142.00, Target: 140.00, Stop: 142.60
Position: -
Target: -
Stop:-
Although the British pound retreated after meeting resistance at 141.35, reckon downside would be limited to 140.35-40 and near term upside risk remains for another corrective rebound, above 141.35 would extend the rebound from 139.35 (last week’s low) to 141.90-00 where renewed selling interest should emerge and bring another decline later, below 140.35-40 would bring weakness towards 139.80-85, break there would signal the rebound from 139.35 has ended, bring retest of this level, below would extend recent decline to 138.70 (previous support) but loss of downward momentum should prevent sharp fall below 138.30 and 138.00 should hold.
In view of this, we are looking to sell sterling on subsequent recovery as 141.90-00 should limit upside and bring such a decline. A firm break above resistance at 142.05 would suggest low is possibly formed instead, bring a stronger rebound to 142.50-60 but resistance at 143.20 should remain intact and bring another decline later.
Our preferred count is that larger degree wave V with circle is unfolding from 251.12 with wave (I) 219.34, (II): 241.38 and wave (III) is subdivided into 1: 192.60, 2: 215.89 (23 Jul 2008) and wave 3 ended at 118.87 earlier in 2009. The correction from there to 162.60 is wave 4 which itself is a double three and is labeled as first a-b-c ended at 151.53, followed by wave x at 139.03, 2nd a ended at 162.60, 2nd b at 146.75 and 2nd c leg of wave 4 ended at 163.00. Therefore, the decline from 163.00 to 116.85 is now treated as wave 5 which also marked the end of larger degree wave (III), hence wave (IV) major correction has commenced for retracement of the wave (III) from 241.38 and upside target at 183.95-00 (50% Fibonacci retracement of the wave (II) from 241.38) had been met, a drop below 160.00 would suggest wave (IV) has ended at 195.85, bring decline in wave (V) for initial weakness to 130 (already met) and 120.
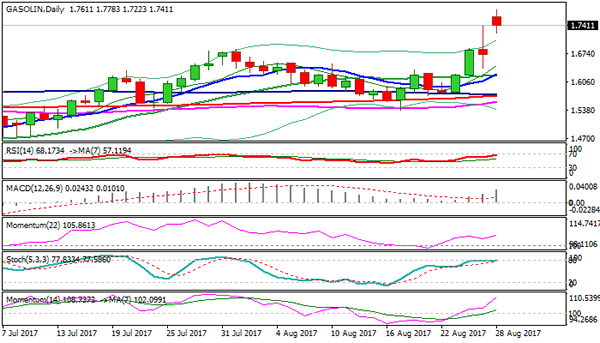
Technical Outlook: Gasoline Is Consolidating After Over 5% Gap-Higher Opening On Monday
Gasoline was the top winner in early Monday's trading. Contract for September delivery surged to the highest levels since July 2015 after opening with gap higher of 5.3% on Monday (1.6721 Fri close/1.7611 Mon open). Gasoline hit session high at 1.7783, before easing to 1.7232 in late Asian/early European trading. The price soared after markets started to digest the impact o hurricane Harvey on the US Gulf coast. This was the most powerful hurricane that hit the state of Texas in more than 50 years which caused a big damage, casualties and prompted the closure of several refineries. Gasoline ended Friday's trading in red after wide-amplitude trading action showed strong hesitation at 1.6835 barrier (former high of 01 Aug) but closed positively for the second consecutive week. Firmly bullish daily studies are supportive for clear break above dented key med-term barrier at 1.7697 (12 Apr high) to signal resumption of broader recovery rally from 0.8975 (Feb 2016 low). Meanwhile, deeper correction before fresh rally could be anticipated. Thick hourly cloud (spanned between 1.6993 and 1.6583) is expected to contain extended dips.
Res: 1.7697, 1.7783, 1.8000, 1.8306
Sup: 1.7223, 1.7000, 1.6993, 1.6835
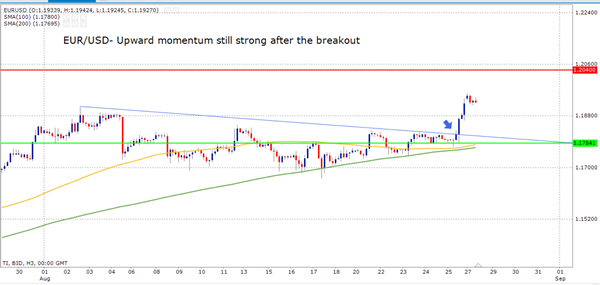
Euro Eyeing Test Of 1.2000 Vs US Dollar
Key Highlights
- The Euro surged higher this past week and traded towards 1.1960 against the US Dollar.
- The EUR/USD pair broke a couple of important bearish trend lines near 1.1800 on the 4-hours chart.
- Euro Zone's M3 Money Supply for July 2017 was up by 4.5%, compared with the forecast of +4.9% (YoY).
- The Dallas Fed Manufacturing Business Index for August 2017 will be released today, which is forecasted to decline from 16.8 to around 15.5.
EUR/USD Technical Analysis
The Euro is an excellent bullish run from the 1.1650 swing low against the US Dollar. The EUR/USD pair recently traded to a new 2-year high and eyes more gains towards 1.2000 in the near term.
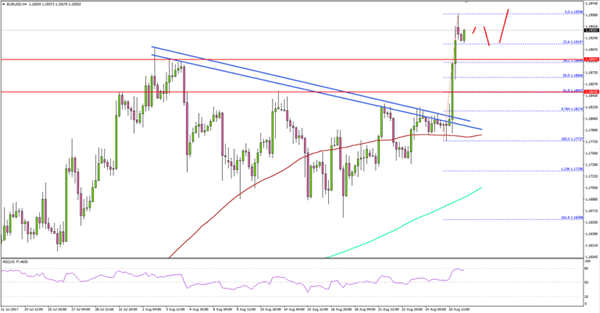
The pair started a strong uptrend from the 1.1650 low and traded above the 100 simple moving average (H4). During the upside move, there was a break above a couple of important bearish trend lines near 1.1800 on the 4-hours chart.
A new monthly high was formed at 1.1959 before the pair started a short-term correction. It already tested the 23.6% Fib retracement level of the last wave from the 1.1773 low to 1.1959 high.
Downsides remain supported by the 1.1900 level and any further declines would face strong buying interest near 1.1850.
Euro Zone's M3 Money Supply
Today in the Euro Zone, the M3 Money Supply report for July 2017 was released by the European Central Bank. The forecast was slated for a rise of 4.9% in the supply compared with the same month a year ago.
The actual result was on the lower side, as there was an increase of 4.5% in the M3 Money Supply. Looking at the narrower aggregate M1, comprising currency in circulation and overnight deposits, it was up by more than 9% July 2017 compared with the same month a year ago.
Referring to the 3-month change, the M3 Money Supply rose 4.8%, less than the last 4.9%. Private loans were up by 2.4% in July 2017 (YoY), more than the last reading of 2.1%.
To sum up, the overall trend for EUR/USD is bullish and any dips towards 1.1860 or 1.1820 remains supported.
Daily Technical Analysis: EURUSD, GBPUSD, USDJPY, USDCHF
EURUSD
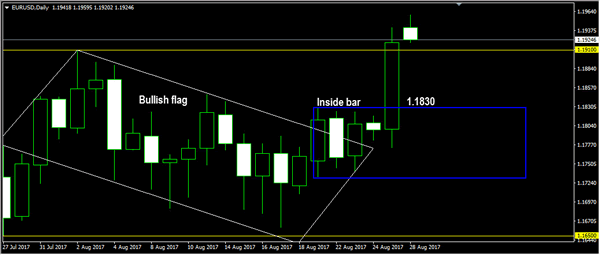
As expected, the EURUSD had a bullish momentum last week topped at 1.1941 and hit 1.1959 earlier today in Asian session. As you can see on my daily chart below, price breaks above the bullish flag and the inside bar formation, suggests a bullish continuation scenario. The bias is bullish in nearest term testing 1.2000 level. Immediate support is seen around 1.1875. A clear break below that area could lead price to neutral zone in nearest term testing 1.1830 region but overall I remain bullish and any downside pullback should be seen as a good opportunity to buy. On the upside, a clear break and daily close above 1.2000 would expose 1.2100 – 1.2175 region.
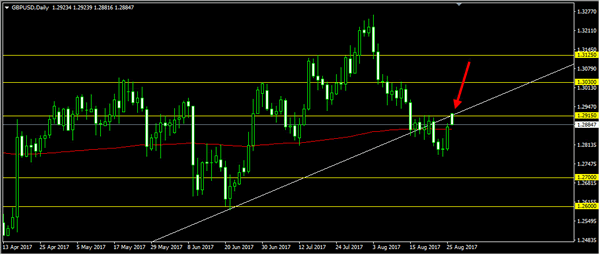
GBPUSD
The GBPUSD was indecisive last week. The pair attempted to push lower, bottomed at 1.2773 but closed higher at 1.2876. Price gapped higher earlier today, opened at 1.2923 but traded lower around 1.2885 at the time I wrote this comment. As you can see on my daily chart below, price retreat from the violated trend line support and 1.2915 key resistance, which keeps the bearish phase intact. The bias is neutral in nearest term. Immediate support is seen around 1.2830. A clear break and daily close below that area could trigger further bearish pressure testing 1.2700 region. On the upside, a clear break and daily close above 1.2915 would interrupt the current bearish phase testing 1.3000 – 1.3030 resistance area. Overall I remain neutral.
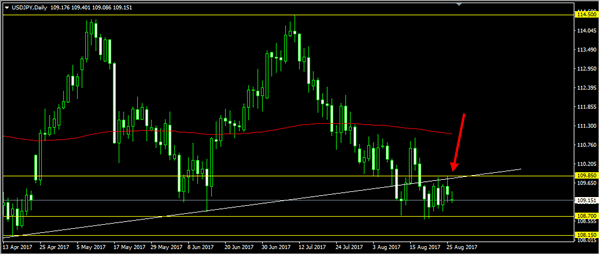
USDJPY
The USDJPY was indecisive last week formed a Doji formation on weekly chart. The bias is neutral in nearest term. As long as stay below 109.85 I still prefer a bearish scenario at this phase but need a clear break below 108.70 key support area to continue the bearish scenario testing 108.00 – 107.50 as nearest bearish target. On the upside, a clear break and daily close above 109.85 key resistance would expose 111.00 region or higher.
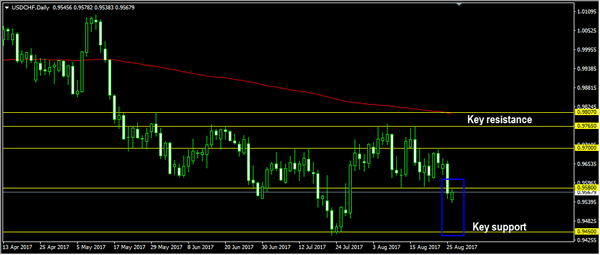
USDCHF
The USDCHF attempted to push higher last week topped at 0.9697 but whipsawed to the downside and closed below 0.9580 support area. The bias is bearish in nearest term testing 0.9500 – 0.9450 key support. Immediate resistance is seen around 0.9600. A clear break above that area could lead price to neutral zone in nearest term testing 0.9650 region or higher. I prefer a bearish scenario at this phase but 0.9450 key support should remain a good place to buy with a tight stop loss.
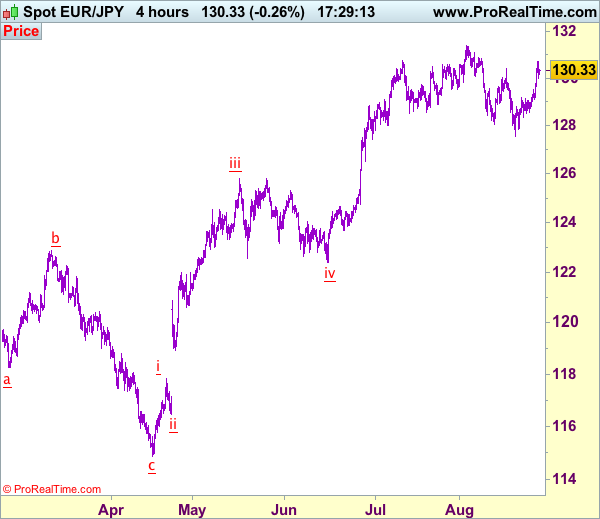
Trade Idea: EUR/JPY – Buy at 129.70
EUR/JPY - 130.38
New strategy :
Buy at 129.70, Target: 131.70, Stop: 129.10
Position: -
Target: -
Stop:-
Last week’s rally above previous resistance at 130.40 signals early fall from 131.40 has ended at 127.56 and mild upside bias is seen for further gain to 131.10-15, however, break there is needed to retain bullishness for retest of said recent high at 131.40, once this level is penetrated, this would extend early upmove to 131.90-00 but near term overbought condition should prevent sharp move beyond 132.50-60.
On the downside, whilst pullback to 130.00 cannot be ruled out, reckon 129.60-70 would limit downside and bring another rise. Below 129.10-15 would defer and suggest top is formed instead, risk weakness to 128.75-80 but still reckon 128.30-35 support would remain intact and bring another rise later this week.
Our latest preferred count is that wave (ii) is ABC-X-ABC which ended at 123.33 and wave (iii) is unfolding with wave iii ended at 100.77, followed by wave iv at 111.57 and wave v as well as the wave (iii) has ended at 97.04, followed by wave (iv) at 111.43 and wave (v) has ended at 94.12 which is also the end of the larger degree v, this also implied the major wave (C) has also ended there, hence major correction has commenced from there with (A) leg unfolding in its lower degree wave c which has possibly ended at 145.69. Under this count, A-B-C wave (B) has commenced with A leg ended at 136.23, wave B at 143.79 and wave C has possibly ended at 149.79.
Our larger degree count is that the decline from 139.26 is wave (C) and is sub-divided into a diagonal triangle i-ii-iii-iv-v with wave i - 105.44, wave ii- 123.33, wave iii - 97.03, wave iv - 111.43, followed by the final wave v as well as the end of wave (C) at 94.12, this also mark the bottom of larger degree wave B. Under this count, major rise in wave C has commenced as an impulsive wave with minor wave III ended at 145.69, wave V is still in progress for further gain to 150.00. Having said that, this so-called wave V could well be the first leg of larger degree 5-waver wave C and this wave C should bring at least a retest of wave A top at 169.97 (July 2008).
Draghi Pushed The Euro Higher While Dollar Weakness Impact Sterling
Draghi was more optimistic than anticipated during the Jackson Hole Meeting
Brexit negotiations moves towards a third round
The euro is showing bullish momentum and it is extending its bullish move to a 2-1/2 year high. The number which everyone is looking at is 1.20 although the resistance is at 1.2040. Thanks to the president of the European central bank who instigated this rally with his comments at the Jackson Hole meeting last week. The general perception among traders was that the president will talk down the currency.
However, his optimism about the economic growth in the Eurozone and the recovery has sparked the rally in the euro. We do think that the path of the least resistance for the EUR/USD remain skewed to the upside. Going forward, the focus would be towards the most important upcoming- the ECB meeting in September. Investors are expecting that the ECB will announce the process of tapering during this event and that has the ability to push the euro even higher.
The sterling is strong against the dollar not because of its own strength but because of the weakness in the dollar. The negotiation process around Brexit talks is reaching to a third round between the UK and the EU’s leaders. The discussions are not yielding any favourable results and despite the fact, whatever the leaders of both sides may say, but the actual results do not show any sign of flexibility and imagination. There is no resolution in sight around the issue of Northern Ireland’s citizen’s right and for the exit bill. Labour party has also made a dramatic move and they would like to keep Britain in the EU single market during the transition period and this is more likely to push the entire process towards the softer Brexit.
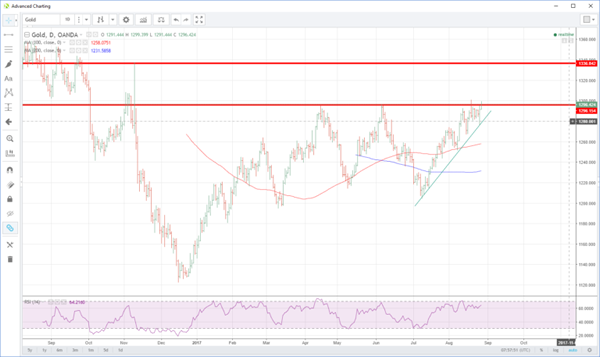
Precious Metals Gain Traction After No Action In Jackson Hole
Following what was effective 'no comment' speeches from Yellen and Draghi at Jackson Hole, U.S. dollars bears had the green light to keep selling dollars. Combined with a potential stand-off between the White House and Congress over the Mexican Wall being tied to extending the debt limit, the street needed no more excuses to move back into precious metals.
Both Gold and Silver's price action was constructive to finish the week, a trend that has continued in Asia today, with Gold up 0.45% and Silver up 0.65% as we head into the European session. Trading may be muted, however, as London is on holiday today. Gold has risen five dollars to 1296.50, trading through its 1296.00 resistance. Silver has risen 14 cents, trading at 17.1500 as we head into Europe.
GOLD
A break of 1296.00 is technically significant if we can close above here today. This opens up an attack on the 18th August spike high at 1301.00. A close above this level presents a lot of clear air on the chart with the next resistance being at 1337.50, the November 2016 high. A close above 1296.00 today would also imply we are seeing a breakout of the ascending wedge formation dating back to early July as per the chart below.
Support is at the ascending trend line, today being at 1279.00. Behind this level, next support is at 1267.50, the 15th August low and then the 100-day moving average at 1258.00.
SILVER
Silver has underperformed relative to gold in August, having run into a brick wall above 17.2000 all month. I have attributed this to traders preferring to express their position in the more liquid gold contract, having been whipsawed and burnt by aggressive price action in silver this year, much like platinum.
Having tested support at 16.7200 on Friday, silver produced a very nice rally to close just above its 200-day moving average at 17.0675. It appears to be consolidating those gains today.
Resistance will appear at the 17.3900 regions followed by the early June highs around 17.7600. A daily close above the latter is implying a test of 18.0000 awaits.
Silver has support at the 200-day average at 17.0375 followed by the rising support line, today at 16.7600. Only a break of the latter would jeopardise the bullish technical picture.
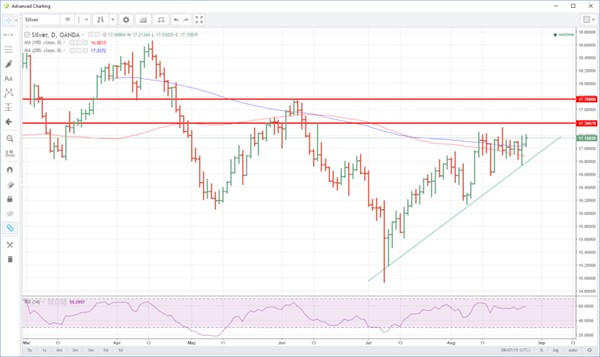
Silver Daily
The Silver weekly chart provides some interesting insight as well. With the previous rally topping at 17.7600 also being the 200-week moving average at the time. Today the average lies at 17.3960, very close to the daily resistance at 17.3900. Thus a break and close above the former would imply silver has chopped a lot of wood and could be set for a meaningful catch-up rally with gold.

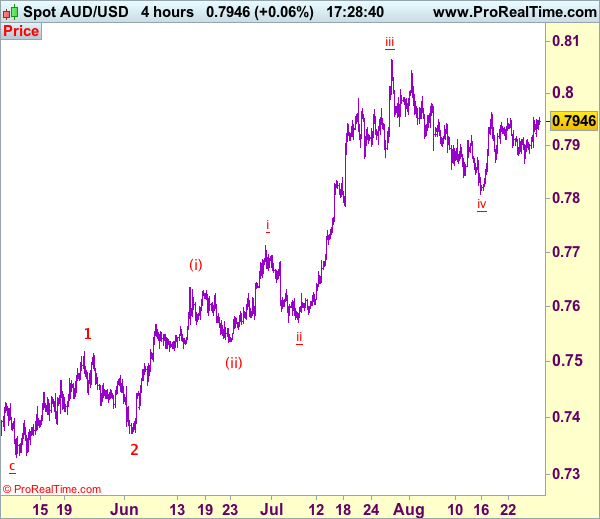
Trade Idea: AUD/USD – Hold long entered at 0.7895
AUD/USD – 0.7945
Recent wave: Wave 5 ended at 1.1081 and major correction has commenced for fall to 0.7000 and then towards 0.6500-10
Trend: Near term up
Original strategy :
Bought at 0.7895, Target: 0.8050, Stop: 0.7865
Position: - Long at 0.7895
Target: - 0.8050
Stop: - 0.7865
New strategy :
Hold long entered at 0.7895, Target: 0.8050, Stop: 0.7880
Position: - Long at 0.7895
Target: - 0.8050
Stop:- 0.7880
Aussie found renewed buying interest at 0.7867 late last week and has staged a strong rebound, retaining our near term bullishness and consolidation with upside bias remains for another rebound to indicated resistance at 0.7963, break there would add credence to our view that low has possibly been formed at 0.7808 earlier this month, bring a stronger rebound to 0.8000, however, break there is needed to signal the pullback from 0.8066 top (wave iii peak) has ended at 0.7808 (wave iv) and bring eventual retest of this level.
In view of this, we are holding on to our long position entered at 0.7895. Below said support at 0.7865-67 would dampen this bullish scenario and suggest the rebound from 0.9808 has ended, bring another test of this level, below there would signal the wave iv correction from 0.8066 is still in progress for weakness to 0.7786 support, however, oversold condition should prevent sharp fall below 0.7750 and price should stay above i top at 0.7712, bring rebound later. We are keeping our latest bullish count that recent impulsive waves is unfolding as (1 2, (i)(ii), i ii) and may extend headway towards 0.8150.
On the 4-hour chart, the move from 0.8066 is the wave 5 with i: 0.8860, ii: 0.8315, wave iii is an extended move ended at 1.0183, iv: 0.9706 and wave v has ended at 1.1081 (also the top of entire wave 5). The subsequent selloff is the major correction which is unfolding as ABC-X-ABC and 2nd A leg has ended at 0.8848, followed by a-b-c wave B which ended at 0.9758, hence, 2nd C wave is now in progress and indicated downside target at 0.7000 and 0.6950 had been met, so further fall to 0.6710-20 cannot be ruled out.
EUR/USD Breaks 1.1910, EUR/CHF Slides
EUR/CHF stalls as ECB meeting get closer
Despite failing to extend gains beyond the 1.15 threshold, EUR/CHF was able to consolidate gains. The pair has been trading between 1.1259 and 1.1538 for the past four weeks. However, the single currency has completed its catch-up rally against the Swiss franc. Further gains are therefore unlikely, especially against the backdrop of mounting uncertainties ahead of the ECB's September meeting and the current valuation of the EUR against its peers.
Since the beginning of the year, the single currency has risen more than 8.5% on a trade-weighted basis, while it has gained “only” 7.30% against the Helvetic currency, with the latter still making the most of its safe haven status. However the tide is slowing turning in favour of the CHF again as Draghi keeps investors in the dark. The resurgence of fears that Draghi under-delivers will most likely weigh on EUR/CHF over the next few days.
Looking at the SNB's total sight deposits, one notices that is has remained quite stable through the summer with domestic deposits shrinking by roughly CHF 17.3bln, while total deposits edged up by CHF 3.7bln. This stabilisation allowed the SNB to spend a nice and quiet summer. However the summer is coming to an end.
EUR/CHF eased to 1.1374 on Monday morning, down 0.20% from 1.1407 at the opening. On the downside, a support lies at 1.1259 (low from August 18th), while on the upside a resistance can be found at 1.1538 (high from August 4th). We maintain our bearish view on the pair as we expect investors will soon return to safe haven ahead of next week's ECB meeting.
Draghi sends the euro above 1.19 after Jackson Hole
The Eurodollar pair has spiked in Friday above 1.1950 on Draghi's comments, its highest level since January 2015. He mentioned that he is confident about the global recovery which he considers that is improving. Yet, he added that the economic recovery has still a long way to go in Europe and in Japan compared with the US recovery.
The single currency spiked and Mario Draghi failed to limit buying pressures on the single currency. Markets pared their gains after he mentioned that more accommodative monetary policy are still needed. Next ECB meeting will be held the 7th of September and markets seem to expect too much. We believe that there are strong room for further disappointment. The inflation target is far from reached and would take more time than needed to be attained. Yet, with the bonds scarcity issue, it is going to be tough for the ECB to maintain accommodative monetary policy too long. Markets' confidence in the ECB may be at stake at some point. The single currency will certainly head higher until the ECB meeting before bouncing lower.
Yellen Avoids Policy, Draghi Does Not Talk Down EUR
Speaking at the Jackson Hole on Friday, Fed Chair Janet Yellen avoided the subject of monetary policy altogether. The absence of any signals regarding an imminent balance sheet reduction or the prospect of another rate hike this year probably disappointed investors looking for optimistic hints on these two issues. The result was a weaker dollar. Soon thereafter, the euro surged on ECB President Draghi's remarks, or the lack thereof, to be more precise. The ECB chief said nothing new regarding changes to QE, nor did he talk down the euro. Given that some market participants may have anticipated a warning about the euro's appreciation, the absence of any such concern probably gave traders the ‘green light' to reenter long-EUR positions.
The broader outlook for EUR/USD remains positive in our view. Fed rate-hike expectations are still subdued, while the ECB could very well provide some hints regarding an eventual reduction in its asset purchases as early as at the upcoming policy meeting next week. Having said that, the economic calendar is packed with critical data releases and events this week, which constitute a risk to further near-term rallies in the world's most traded currency pair. Specifically, almost all US data coming out this week are expected to be solid, while President Trump is anticipated to begin pushing for tax reform in speeches. Last but not least, EUR/USD's proximity to the psychological 1.2000 zone is yet another factor making us hesitant to call for further near-term upside. Therefore, even though the pair's broader outlook remains positive, we would stay cautious of a potential consolidation or even correction lower during this event-risk heavy week.
EUR/USD rallied on Friday, to break above the key resistance (now turned into support) of 1.1830 (S2) on Yellen's speech. Subsequently, Draghi's remarks helped it to overcome the 1.1900 (S1) zone, defined by the peaks of the 2nd, 3rd and 4th of August. Then, the rate retreated somewhat. In our view, the rally signaled the resumption of the prevailing medium-term uptrend and as such, we expect the bulls to regain control at some point soon and aim for a test near the 1.1980 (R1) resistance, or the round number of 1.2000 (R2). A break above that key zone is needed to make us confident on further advances. Such a break is possible to set the stage for extensions towards the 1.2100 (R3) territory.
As for the bigger picture, as we already noted, the medium-term outlook remains positive. EUR/USD has been printing higher peaks and higher troughs above the uptrend line taken from the low of the 17th of April. Even if we get a retreat from near the 1.2000 (R2) zone, as long as such a setback remains limited above the aforementioned uptrend line, we would treat it as providing renewed buying opportunities.
Tropical Storm Harvey intensifies, takes out a chunk of US oil production
Tropical Storm Harvey intensified over the weekend and hit the state of Texas, causing some US oil rigs as well as many refineries to shut down. However, the reaction in the oil market has been relatively muted, at least so far, with market participants not appearing worried that this will lead to a meaningful oil shortage. One reason for the subdued reaction may be that weather factors rarely disrupt supply for very long, implying investors may view this situation as temporary. Another explanation may be the fact that the US Department of Energy stated on Friday it stands ready to release crude oil from the nation's emergency stockpile (Strategic Petroleum Reserve) if it is deemed necessary. This suggests that even if the storm intensifies and cripples US supply further, the federal government may intervene. Thus, further intensification of Harvey could support prices somewhat, but if the impact is big enough to cause intervention, prices could come back down.
WTI traded in a consolidative manner on Friday, staying slightly above the support of 47.50 (S1). Since the 22nd of August, the price has been trading mostly between that level and the resistance of 48.55 (R1). As such, we consider the short-term outlook to be flat for now. Our view is also supported by our short-term momentum studies, both of which lie near their equilibrium lines, pointing sideways.
Having said that though, given that WTI is still trading above the upper bound of the downside channel that contained the price action from the beginning of February until the 25th of July, we still see a decent possibility for the bulls to take charge again. A break above the resistance of 48.55 (R1) could confirm the case and is possible to initially aim for our next resistance of 49.30 (R2).
As for today's economic data:
The only major indicators we get are Sweden's retail sales and the Eurozone's M3 money supply, both for July.
As for the rest of the week:
On Tuesday, there is nothing major on the economic calendar. On Wednesday, we get Germany's preliminary CPI and the US ADP employment report, both for August. On Thursday, Eurozone's preliminary CPIs for August will be closely watched. In the US, personal income and spending data for July as well as the core PCE price index for the same month, are all coming out. We also get Canada's GDP for Q2. Finally on Friday, the all-important US employment report for August is due out and expectations are for another strong report.
EUR/USD
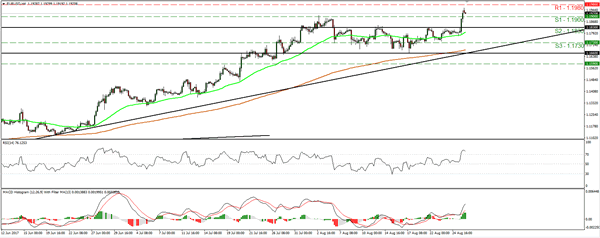
Support: 1.1900 (S1), 1.1830 (S2), 1,1730 (S3)
Resistance: 1.1980 (R1), 1.2000 (R2), 1.2100 (R3)
WTI
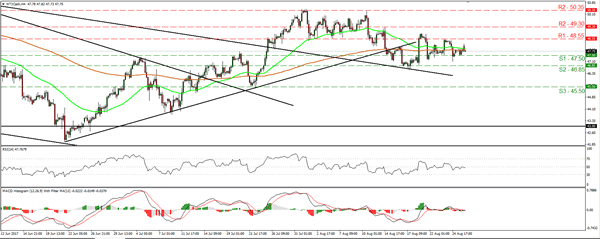
Support: 47.50 (S1), 46.85 (S2), 45.50 (S3)
Resistance: 48.55 (R1), 49.30 (R2), 50.35 (R3)