
Sample Category Title
USD/JPY Daily Outlook
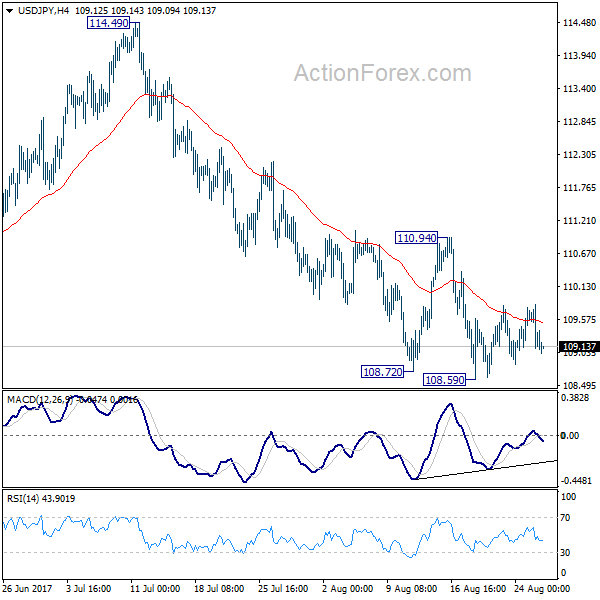
Daily Pivots: (S1) 109.01; (P) 109.42; (R1) 109.74; More...
Intraday bias in USD/JPY remains neutral for consolidation above 108.59 temporary low. Upside of recovery should be limited below 110.94 resistance and bring fall resumption. Break of 108.59 will target a test on 108.12 low. Whole corrective decline from 118.65 is possibly resuming and break of 108.12 will target 61.8% retracement of 98.97 to 118.65 at 106.48. Nonetheless, firm break of 110.94 will indicate short term bottoming and turn bias back to the upside.
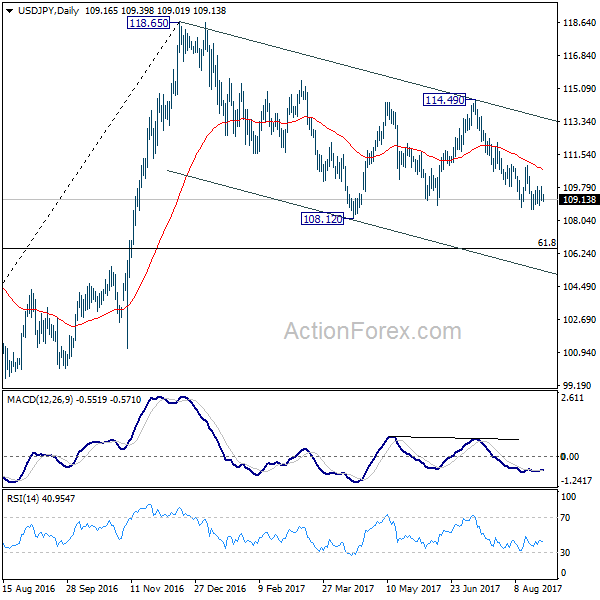
In the bigger picture, the corrective structure of the fall from 118.65 suggests that rise from 98.97 is not completed yet. Break of 118.65 will target a test on 125.85 high. At this point, it's uncertain whether rise from 98.97 is resuming the long term up trend from 75.56, or it's a leg in the consolidation from 125.85. Hence, we'll be cautious on topping as it approaches 125.85. If fall from 118.65 extends lower, downside should be contained by 61.8% retracement of 98.97 to 118.65 at 106.48 and bring rebound.
AUD/USD Daily Outlook
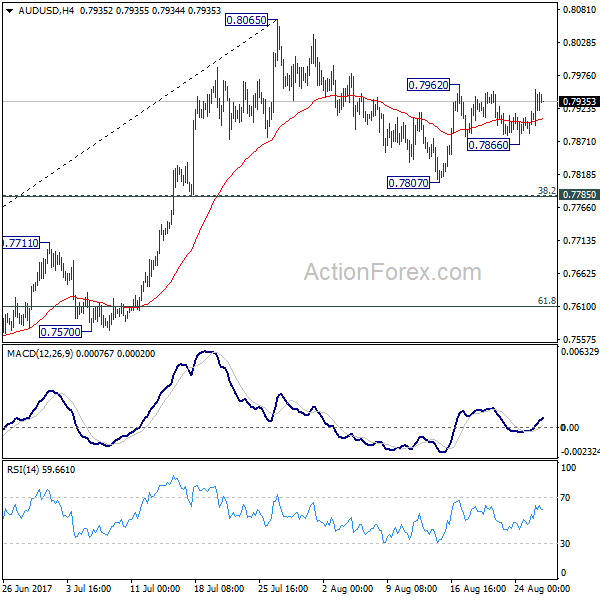
Daily Pivots: (S1) 0.7893; (P) 0.7923; (R1) 0.7962; More...
Intraday bias in AUD/USD remains neutral for the moment. As noted before, correction from 0.8065 might extend and another fall cannot be ruled out. But downside should be contained by 0.7785 cluster support (38.2% retracement of 0.7328 to 0.8065 at 0.7783) to bring rebound. Above 0.7962 will target a test on 0.8065 resistance first. Firm break of 0.8065 will resume the medium term rise and target 100% projection of 0.6826 to 0.7833 from 0.7328 at 0.8335.
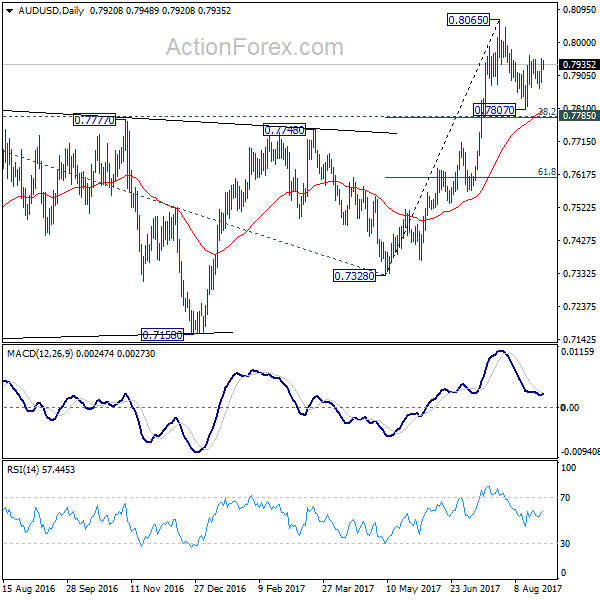
In the bigger picture, rise from 0.6826 medium term bottom is still in progress. At this point, there is no confirmation of trend reversal yet and we'll continue to treat such rebound as a corrective pattern. But in any case, break of 55 month EMA (now at 0.8097) will target 38.2% retracement of 1.1079 to 0.6826 at 0.8451. Break of 0.7328 support is needed to confirm completion of the rebound. Otherwise, further rise is now in favor.
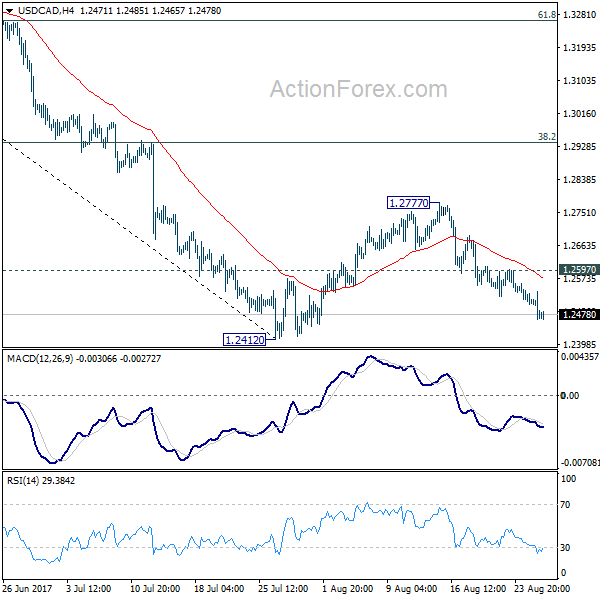
USD/CAD Daily Outlook
Daily Pivots: (S1) 1.2451; (P) 1.2495; (R1) 1.2525; More....
Intraday bias in USD/CAD remains on the downside for 1.2412 low. Firm break there will resume the larger fall and target next long term fibonacci level at 1.2048. On the upside, above 1.2597 minor resistance will extend the correction from 1.2412 with another rise. But we'd expect upside to be limited by 38.2% retracement of 1.3793 to 1.2412 at 1.2940 to bring fall resumption eventually.
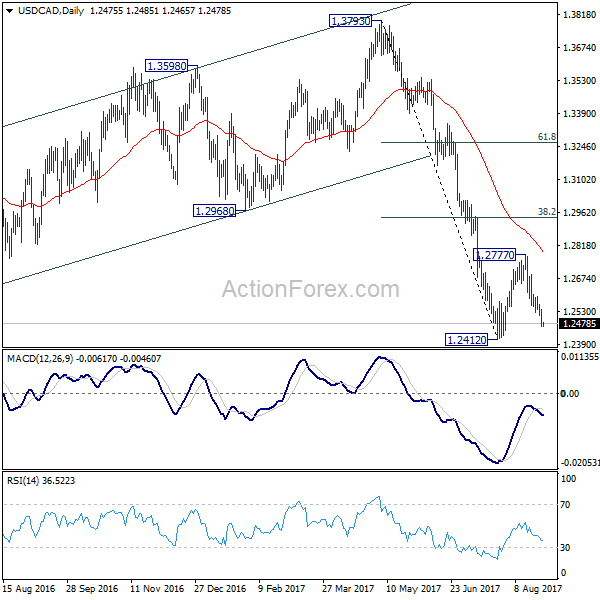
In the bigger picture, price actions from 1.4689 medium term top are seen as a correction pattern. Such corrective fall is still expected to extend to 50% retracement of 0.9406 to 1.4869 at 1.2048. At this point, we'd look for strong support from there to contain downside and bring rebound. Nonetheless, on the upside, sustained break of 1.2968, 38.2% retracement of 1.3793 to 1.2412 at 1.2940 will be the first sign of completion of the correction and will turn focus back to 1.3793 key resistance.
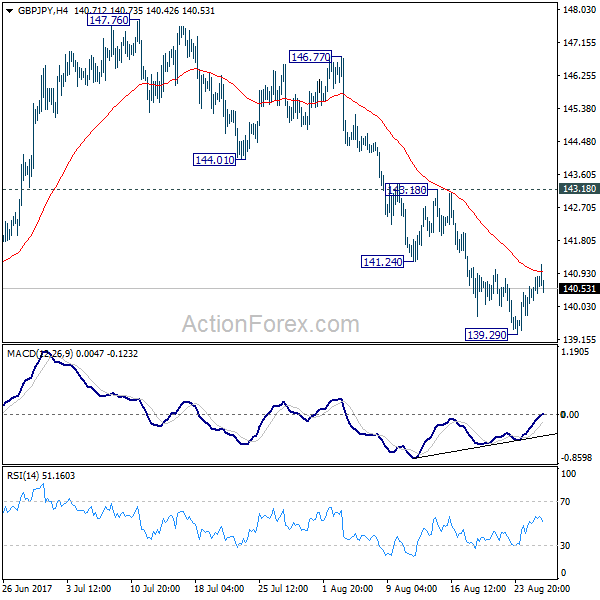
GBP/JPY Daily Outlook
Daily Pivots: (S1) 140.28; (P) 140.56; (R1) 141.02; More
Intraday bias in GBP/JPY remains neutral for consolidation above 139.29 temporary low. Near term outlook remains bearish as long as 143.18 resistance holds and deeper decline is in favor. Below 139.29 will target 135.58 key support level. At this point, price actions from 148.42 are seen as a sideway consolidation pattern. Hence, we'll expect strong support from 135.58 to contain downside and bring rebound. Meanwhile, break of 143.18 will indicate short term reversal and turn bias back to the upside.
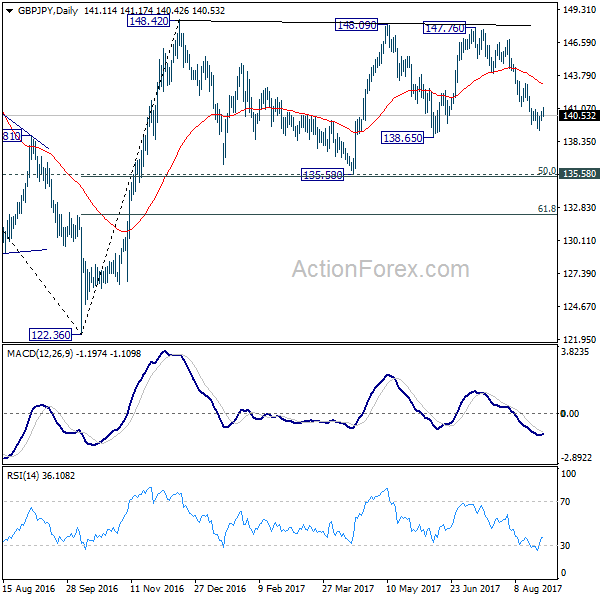
In the bigger picture, the sideway pattern from 148.42 is extending with another leg. We'd expect strong support from 135.58 and 50% retracement of 122.36 to 148.42 at 135.39 to contain downside. Medium term rise from 122.36 is still expected to resume later. And break of 38.2% retracement of 196.85 to 122.36 at 150.43 will carry long term bullish implications. However, firm break of 135.58/39 will dampen the bullish view and turn focus back to 122.36 low.
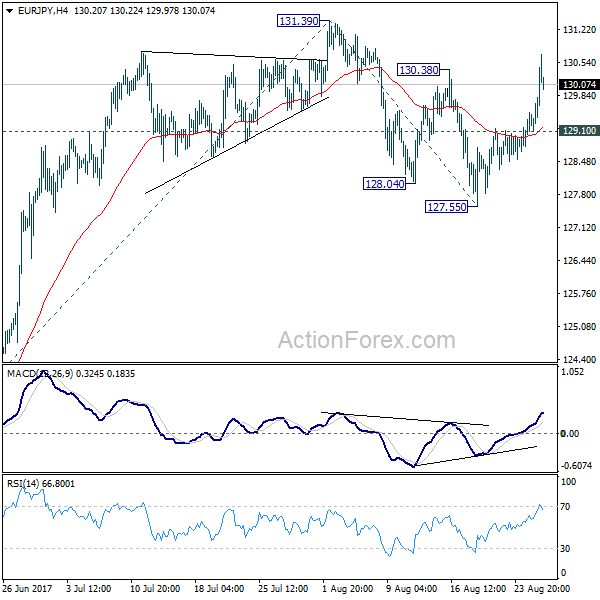
EUR/JPY Daily Outlook
Daily Pivots: (S1) 129.50; (P) 129.96; (R1) 130.79; More...
Intraday bias in EUR/JPY remains on the upside for 131.39 high. Correction from 131.39 has completed at 127.55 already, after hitting 55 day EMA. Firm break of 131.39 will resume larger rally and target 61.8% projection of 122.39 to 131.39 from 127.55 at 133.11 next. On the downside, below 129.10 minor support will dampen this bullish view and turn focus back to 127.55 support instead.
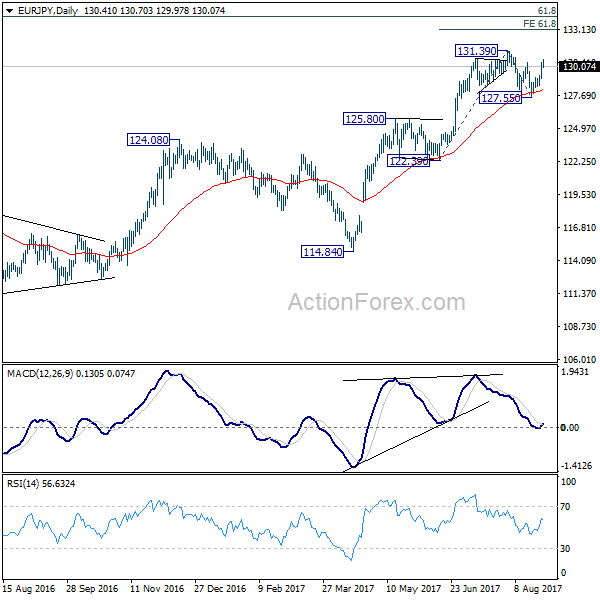
In the bigger picture, the down trend from 149.76 (2014 high) is completed at 109.03 (2016 low). Current rally from 109.03 should be at the same degree as the fall from 149.76 to 109.03. Further rise is expected to 61.8% retracement of 149.76 to 109.03 at 134.20. Sustained break there will pave the way to key long term resistance zone at 141.04/149.76. Medium term outlook will remain bullish as long as 124.08 resistance turned support holds. However, firm break of 124.08 will argue that rise from 109.03 is completed and turn outlook bearish.
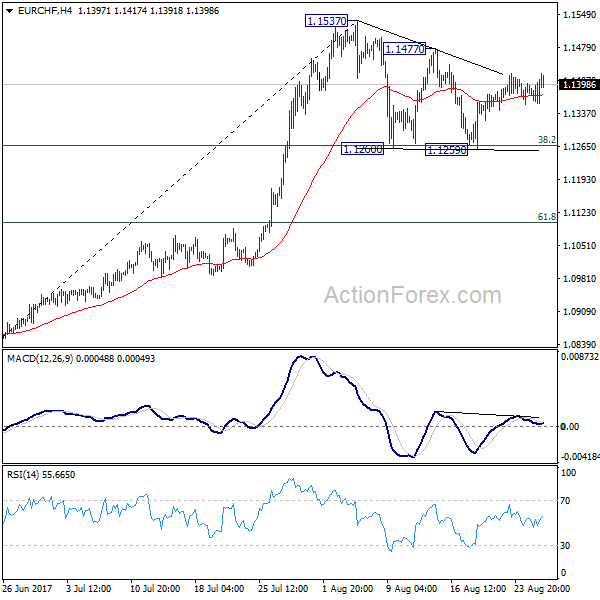
EUR/CHF Daily Outlook
Daily Pivots: (S1) 1.1369; (P) 1.1389; (R1) 1.1420; More...
Intraday bias in EUR/CHF remains neutral as consolidation from 1.1537 is still in progress. On the upside, break of break of 1.1477 resistance will argue that the consolidation from 1.1537 has completed and larger rise is resuming. Further break of 1.1537 will confirm and target 1.2 key resistance level next. On the downside, however, firm break of 38.2% retracement of 1.0830 to 1.1537 at 1.1267 will extend the correction to 61.8% retracement at 1.1100 before completion.
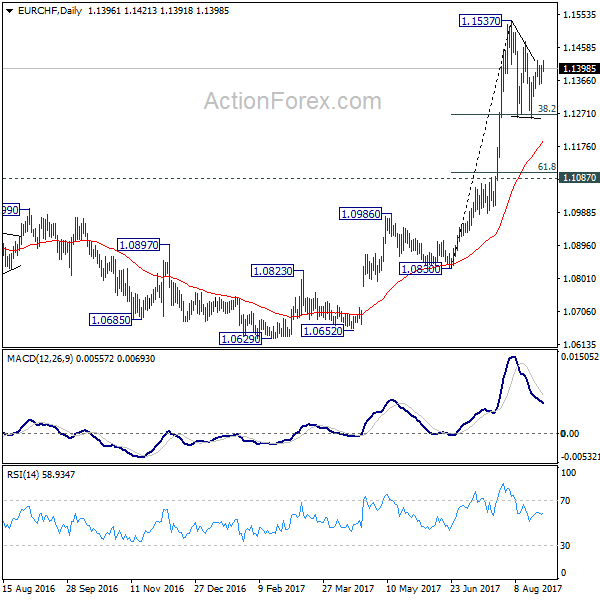
In the bigger picture, firm break of 1.1198 key resistance confirms resumption of the long term rise from SNB spike low back in 2015. In this case, EUR/CHF would eventually head back to prior SNB imposed floor at 1.2000. For now, this will be the favored case as long as 1.1087 resistance turned support holds.
EUR/AUD Daily Outlook
Daily Pivots: (S1) 1.4925; (P) 1.4980; (R1) 1.5076; More...
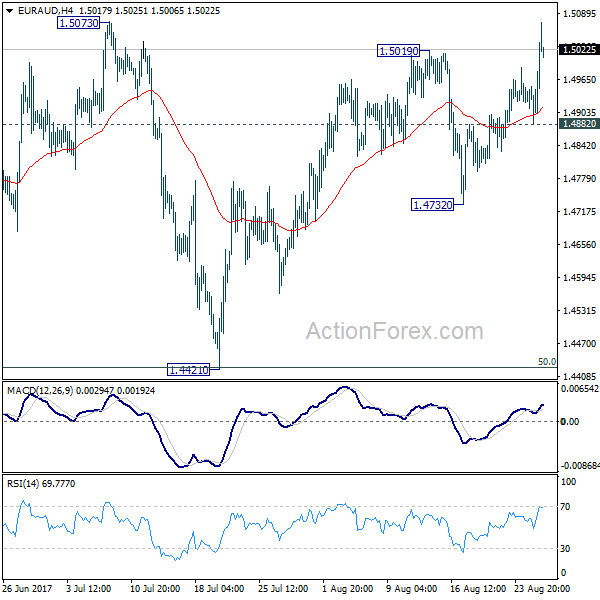
Intraday bias in EUR/AUD remains on the upside for the moment. Rise from 1.4421 is still in progress and recent development suggests that correction from 1.5226 has completed with three waves down to 1.4421. Firm break of 1.5073 resistance will affirm the case that whole rebound from 1.3624 is resuming and target 1.5226 high. On the downside, below 1.4882 minor support will turn intraday bias neutral first. But outlook will remain cautiously bullish as long as 1.4732 support holds.
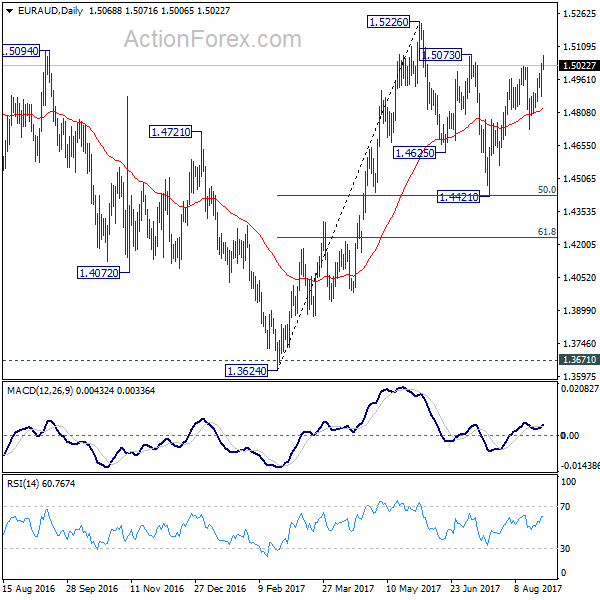
In the bigger picture, we're holding on to the view that corrective decline from 1.6587 medium term has completed at 1.3624. Rise from 1.3624 is expected to extend to retest 1.6587. The corrective structure of the fall from 1.5226 is affirming this view. Above 1.5226 will target a test on 1.6587 key resistance. However, break of 1.4421 will dampen our view and would drag EUR/AUD lower to retest key support zone around 1.3624.
EUR/GBP Daily Outlook
Daily Pivots: (S1) 0.9210; (P) 0.9239; (R1) 0.9284; More
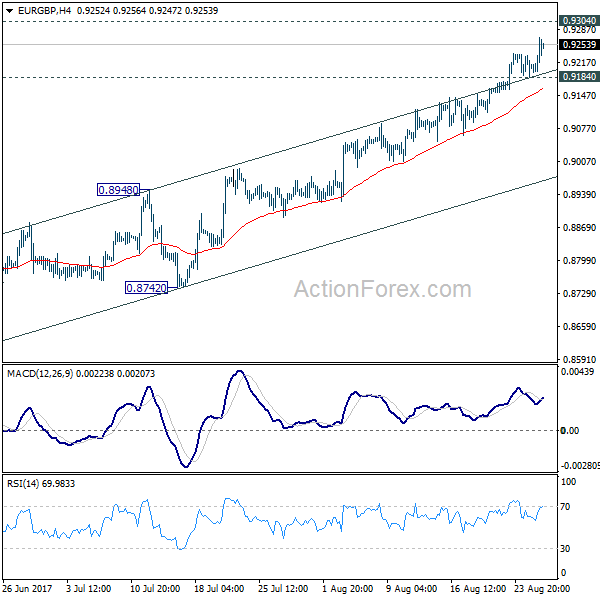
Intraday bias in EUR/GBP remains on the upside for 0.9304 key resistance next. We'd remain cautious on rejection from 0.9304 to extend the medium term consolidation pattern. Break of 0.9184 will turn bias back to the downside for pull back to 55 day EMA (now at 0.8948). However, sustained break of 0.9304 will confirm up trend resumption and pave the way to 0.9799.
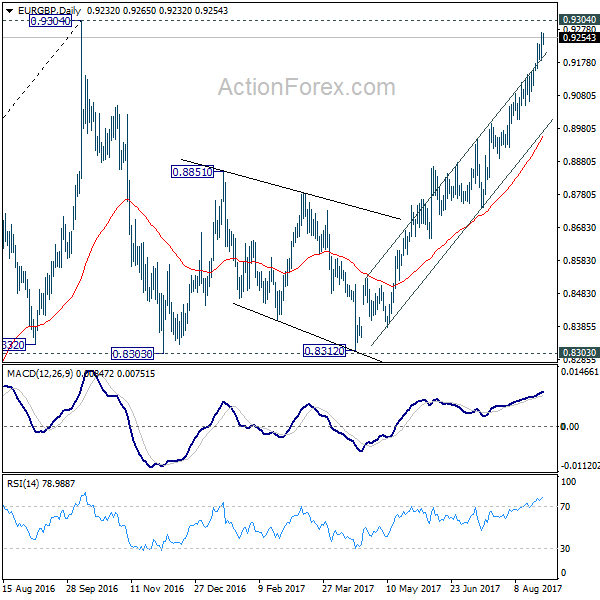
In the bigger picture, price actions from 0.9304 are viewed as a medium term corrective pattern. It's uncertain whether it is finished yet. But in case of another fall, we'd expect strong support from 0.8116 cluster support (50% retracement of 0.6935 to 0.9304 at 0.8120) to contain downside and bring rebound. Whole up trend from 0.6935 is expected to resume after consolidation from 0.9304 completes. Firm break of 0.9799 high will target 61.8% projection of 0.5680 to 0.9799 from 0.6935 at 1.1054.
Euro Firm in Quiet Trading, Looks to US NFP and Brexit Negotiation for Further Strength
The forex markets are pretty steady in range as another week starts, as usual. Euro surged to highest in more than two years against Dollar last week as aftermath of Jackson Hole symposium. The common currency retreats mildly today but remains firm across the board. Focus will turn back to economic data this week first, in particular job data from US. So far, EUR/USD is in health up trend to take on 1.2 handle next. Attention will be on UK and EU and another round of Brexit negotiation starts. In response to the criticism on lack of clear positions, Prime Minister Theresa May's government released seven policy papers ahead of the meeting. And officials on both sides would have to expedite their work in order to make enough progress to start the talks on post Brexit trade agreements in October. EUR/GBP is facing 0.9304 key resistance for the moment. Negative news out of the negotiation could power the cross through this level.
To briefly recap Jackson hold symposium, Fed chair Janet Yellen didn't touch on monetary policies. Instead, she made use of this high profile situation to defend the post financial crisis regulations. Her speech is seen as a pledge that if she's given a second term as Fed chair next February, she will continue with the tough regulations. Similarly ECB President Mario Draghi didn't touch much on monetary policies neither. Draghi main focused on emphasizing openness to international trade and warning on a turn towards protectionism. More in Business Back to Usual after Jackson Hole, EUR/USD Surged to New High
Cleveland Fed Mester urged gradual hike path
Cleveland Fed President Loretta Mester urged the central bank to keep up with the path of gradual rate hike. Mester warned that "there's some risk that if we wait too long we can find ourselves in a bad spot." And, "we have to move policy a little bit before we get to the goals or else we're going to get behind." She pointed out that "we've had a couple of weak inflation reports lately, but you can point to some one-off factors." But she expected "inflation to remain below 2 percent over the next couple of months or so, in the near term, and then eventually to rise up to our 2 percent goal."
BoJ Kuroda: Less need to purchase JGBs ahead
BoJ Governor Haruhiko Kuroda said in a television interview that 4% growth cannot be sustained and "around 2% growth is likely" for the country. He hailed the yield curve control frame work as "well managed" and noted that "despite the wide fluctuation of long-term interest rates in Europe and the United States, Japanese 10-year JGB interest rate has been very flat, around 0 percent." He also noted that the JGB markets are "functioning quite well" in spite of the central bank's massive asset purchase program. Meanwhile, he pointed out that "since JGBs remaining in the market is going to decline, that means that with one unit of JGB purchase, the impact on the interest rate could be bigger." Hence, "in coming months there will be less and less need to purchase JGBs in order to maintain the yield curve."
US non-farm payroll as main focus this week
Looking ahead, the economic calendar is full of important data this week. US non-farm payroll is a key feature. Fed is widely expected to start unwinding the balance sheet in September and this won't be changed by a month of good or bad NFP reports. The main question for the market is whether Fed will hike interest rate again this year in December. Based on market pricings, investors are not too convinced with it. It will be difficult for Fed to raise interest rates again given the uncertainties with fiscal policies of the White House. And more importantly, Fed will need a couple more months see if a bounce back in inflation before acting. So, we believe that risks remain skewed to the downside for Dollar regarding NFP. That is, a month of strong set of NFP numbers won't give the greenback a sustainable turn around. But an downside surprises could trigger another selloff in the Dollar.
Here are some highlights for the week ahead
- Monday: Eurozone M3; US trade balance, wholesale inventories
- Tuesday: Japan household spending, unemployment rate; German Gfk consumer sentiment; Canada RMPI and IPPI; US S&P Case-Shiller house price, consumer confidence
- Wednesday: Japan retail sales; Australia building approvals; Swiss UBS consumption indicator, KOF leading indicator; German CPI; Eurozone confidence indicators; UK M4 money supply, mortgage approvals; US GDP revision, ADP employment
- Thursday: Japan industrial production; China PMIs; Japan housing starts; German retail sales, unemployment; Eurozone CPI, unemployment; US jobless claims, personal income and spending; Chicago PMI, pending home sales; Canada GDP
- Friday: China Caixin PMI; Japan consumer confidence; Swiss retail sales, SVME PMI; Eurozone PMI revision; UK PMI manufacturing; US non-farm payroll, ISM manufacturing; Canada manufacturing PMI
EUR/GBP Daily Outlook
Daily Pivots: (S1) 0.9210; (P) 0.9239; (R1) 0.9284; More
Intraday bias in EUR/GBP remains on the upside for 0.9304 key resistance next. We'd remain cautious on rejection from 0.9304 to extend the medium term consolidation pattern. Break of 0.9184 will turn bias back to the downside for pull back to 55 day EMA (now at 0.8948). However, sustained break of 0.9304 will confirm up trend resumption and pave the way to 0.9799.
In the bigger picture, price actions from 0.9304 are viewed as a medium term corrective pattern. It's uncertain whether it is finished yet. But in case of another fall, we'd expect strong support from 0.8116 cluster support (50% retracement of 0.6935 to 0.9304 at 0.8120) to contain downside and bring rebound. Whole up trend from 0.6935 is expected to resume after consolidation from 0.9304 completes. Firm break of 0.9799 high will target 61.8% projection of 0.5680 to 0.9799 from 0.6935 at 1.1054.
Economic Indicators Update
| GMT | Ccy | Events | Actual | Forecast | Previous | Revised |
|---|---|---|---|---|---|---|
| 08:00 | EUR | Eurozone M3 Y/Y Jul | 4.90% | 5.00% | ||
| 12:30 | USD | Wholesale Inventories Jul P | 0.30% | 0.70% | ||
| 12:30 | USD | Advance Goods Trade Balance Jul | -64.5B | -64.0B |
Market Morning Briefing: Strong Rise Was Seen In The Euro
STOCKS
Dow (21813.67, +0.14%) made an intra-day high of 21906 on Friday before closing near 21813. Immediate resistance is seen near 21900-21950 levels which could possibly push the index to much lower levels in the coming sessions. Downside is open towards 21700 and near term looks bearish for the Dow.
Dax (12167.94, -0.11%) will have to show us a confirmed break below 12000-11940 levels to break the current sideways movement and indicate any fresh falls for the coming sessions. Else the index could remain range-bound within the 11940-12350 region in the near term.
Nikkei (19430.14, -0.12%) is almost stable trading in the narrow region below 19580. As mentioned last week, the index looks bearish and could head towards 19000 in the medium to long term. For now the index could trade in the 19200-19500 region.
Shanghai (3364.51, +0.99%) broke above the immediate resistance at 3300 on Friday and has managed to continue the upward momentum today also making an intra-day high at the second resistance near 3375. If the index manages to sustain a break above 3375 in the next few sessions, it could be a clear indication of extension of the uptrend towards 3400-3500 levels in the longer run. There is some slight possibility of seeing a correction from 3375 before it shoots up higher. For now, the bullish momentum looks strong.
Nifty (9857.05, +0.05%) is likely to re-test 9700-9750 levels while below 9950. Near term likely to remain bearish unless we see a sustained break above 9950 levels.
COMMODITIES
Gold (1294.38) has been stable just below crucial resistance near 1300 and has been range bound in the 1280-1295 region for almost 5-6 sessions now. This is unlike the movements seen in Apr’17 or in Jun’17 where the price came off sharply after testing levels near 1300 within a single session. Could this mean that the current stability in the price is an indication of a base building before a sharp rise ahead? Could the bulls be getting stronger to shoot up above 1300 in the near term? Possibly so. We need to be cautious near 1300 and watch price action closely.
Silver (17.11) is almost trading in a sideways range and could test resistance near 17.25-17.40 in the coming sessions.
Copper (3.0505) has moved above the interim resistance near 3.00/02 and is trading higher just now boosted by a stronger Shanghai upshot and while the Chinese stock index continues to rise in the near term, Copper could also be headed towards 3.15/17 in the coming sessions before seeing a pause.
Brent (52.60) and WTI (47.67) are both looking stable. While Brent may come off towards 50 while below 53.80, WTI could trade within 50.00-46.50 levels for some more time. Some sideways movement is expected just now while the prices are above 47 and 46 respectively.
FOREX
Strong rise was seen in the Euro (1.1925) after Jackson Hole speeches on Friday, reasserting the overall uptrend, establishing 1.18-17 as good Supports and setting targets between 1.20-21.
The rise in Euro-Yen (130.17) due to the rise in the Euro-Dollar is encouraging for "Risk-ON" trades, but we need a rise past the July high of 131.40 to bring in more confidence.
Need to watch Dollar-Yen because although Dollar-Yen (109.16) remains ranged between 108.60-109.80, the slow decline in the US-Japan Yield Spreads could lead to eventual Yen strength. Need to watch this. See Interest section below as well.
The Dollar Index (92.52) is trading just below its 200-week MA at 92.59 and can test 91.80 soon enough.
The Pound (1.2888) also rose sharply on Friday, piggybacking on the Euro, but is dipping from Resistance at 1.2915. The outlook still looks weak while below 1.2915.
The Aussie (0.7940) has managed to bounce from levels just above 0.7850 over the last three days, keeping its overall uptrend intact. Can look for a test of 0.80+ while above 0.7900.
Dollar-Rupee trades near 63.95 on the NDF, reflecting global Dollar weakness.
INTEREST RATES
Post Jackson Hole, the German-US 2 Yr Spread (-2.08%) has dropped but the German-US 10Yr Spread (-1.79%) has moved up a wee bit from -1.80%. The Euro seems to be responding more to the German-US 10Yr Spread and has moved up.
Yellen talked about what was needed to be done, and was done, after the 2008 financial crisis and warned against excessive optimism now. Some people take this as hints of a possible rate hike in December. Draghi talked about increasing chances of growth recovery.
US Yields (5Yr 1.76%, 10Yr 2.17%, 30Yr 2.75%) are largely steady. The US 5Yr has good Support at 1.7%, while the 10Yr has good Support at 2.095%.
Supports seen near current levels on the Japanese 5Yr JGB (-0.131%) and the 30Yr JGB (+0.83%), suggesting a possible bounce. Plus the Japanese Yield Curve continues to steepen at the far end, since 22nd June. This might lead to Yen strength, if it continues.
UK Gilt Yields are also testing Supports near current levels (5Yr 0.46%, 10Yr 1.05%) and could be candidates for bounces.