
Sample Category Title
Harvey’s Rains Distract Oil From Venezuela
Hurricane Harvey is a still evolving situation but the real story may be the U.S. turning the screws on Venezuela, bringing default closer.
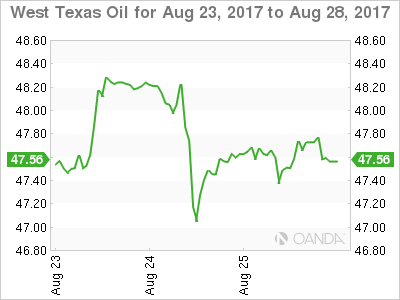
It has all been about Hurricane Harvey this morning as oil markets digest the impact of the storm on U.S. production and refining capacity. It appears that flooding is a major concern now with an incredible 76 cm of rain dumped in the Houston area. Details of the actual damage remain sketchy, but what is for certain is that there may be meaningful and long term damage to Texas' refining capacity.
This has been mostly seen in gasoline futures this morning, erupting higher by some seven percent in what would admittedly be a very thin market. It is therefore somewhat surprising that WTI has had a quiet start trading sideways since the future open at 47.60 around its Friday close. It may well be that the market feels the choke point in Petroleum's value chain is not production but refined products of which Texas is 11.0 percent of the U.S. capacity.
Nevertheless, it is hard to imagine there won't be a knock on effect on crude eventually with WTI spot's technical picture implying that it is poised for a meaningful breakout. The converging triangle has resistance at this morning's high of 48.00 and support at 47.10, a break of which is implying a move in the two to three dollar range. The danger appears to be to the topside for now with a break targeting 48.70 initially and then potentially 50.00 a barrel.
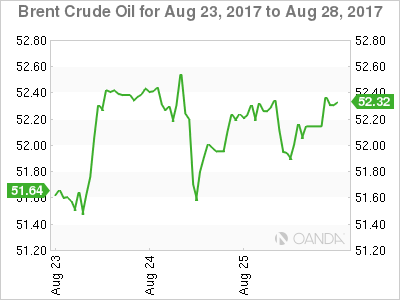
Lost in the winds of Hurricane Harvey was the news that the U.S. has tightened sanctions on Venezuela. It will effectively cut off both the government's and PDVSA's access to financing by U.S. regulated institution's. This will surely bring Venezuela's inevitable bankruptcy closer to fruition, and the resulting drop in oil exports could have the effect of tightening crude supplies and giving a fresh tailwind to OPEC/Non-OPEC's efforts to offset increased Libyan and Nigerian supply. The effect should be seen on WTI rather than Brent as Venezuela's crude is heavy crude which U.S. refineries are optimised.
Brent spot itself should open slightly higher this morning around 52.50, having consolidated its gains of the last ten days nicely into the New York close. Brent spot has solid support at 51.50 with resistance nearby at 52.85, a break of which, opens a run at 53.50 and possibly 54.50 should the Venezuela situation degenerate.
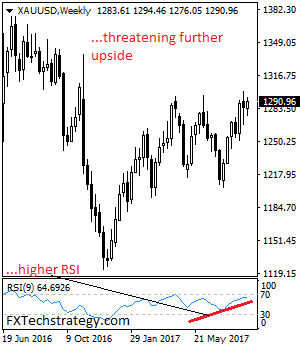
GOLD – Risk Remains Higher On Trend Resumption
GOLD - The commodity continues to face upside pressure as it looks to resume its upside pressure presently on hold. On the downside, support comes in at the 1,280.00 level where a break will turn attention to the 1,270.00 level. Further down, a cut through here will open the door for a move lower towards the 1,260.00 level. Below here if seen could trigger further downside pressure targeting the 1,250.00 level. Conversely, resistance resides at the 1,300.00 level where a break will aim at the 1,310.00 level. A turn above there will expose the 1,320.00 level. Further out, resistance stands at the 1,330.00 level. Its weekly RSI is bullish and pointing higher suggesting further upside pressure. All in all, GOLD looks to weaken further.
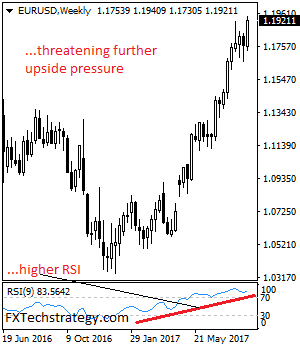
EURUSD – Bullish, Resumes Its Medium Term Upside Pressure
EURUSD - The pair remains biased to upside after resuming its medium term uptrend the past week. Resistance comes in at 1.1950 level with a cut through here opening the door for more upside towards the 1.2000 level. Further up, resistance lies at the 1.2050 level where a break will expose the 1.2100 level. Its weekly RSI is bullish and pointing higher suggesting further upside pressure. Conversely, support lies at the 1.1900 level where a violation will aim at the 1.1850 level. A break of here will aim at the 1.1800 level. All in all, EURUSD faces further upside pressure medium term
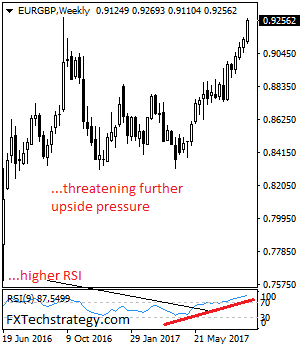
EURGBP – Remains On The Offensive, Extend Bullishness
EURGBP - The cross continues to hold on to its upside pressure closing strongly higher the past week and opening the door for more strength. Support lies at the 0.9200 level where a violation will turn focus to the 0.9150 level. A break will expose the 0.9100 level. Resistance resides at the 0.9250 level where a violation if seen will turn risk towards the 0.9300 level. Further up, resistance resides at 0.9350 level followed by the 0.9400 level. Its weekly RSI is bullish and pointing higher suggesting further upside pressure. All in all, EURGBP remains biased to the upside in the medium term.
EUR/USD Bull Flag Breakout
If you're a market addict who needs to unwind on the weekend, then let's just say that Jackson Hole weekend isn't for you!
While Fed Chair Janet Yellen chose to avoid any discussion around US monetary policy (well, what did we really expect to be honest…), markets were still disappointed. Yellen instead took the time to speak about post-GFC financial reforms, going head to head with Trump's views on deregulation and the the US Dollar took a hit as a result. Central banking v politicians at it's finest.
Keep in mind that a December rate hike remains in play, but the Fed policymakers have sounded lukewarm about another hike in 2017. Futures markets are pricing it in at below 50%, so it's the short USD trade where your monetary policy risk lays if the Fed decides to go the other way.
Moving onto markets and a further look at the EUR/USD bull flag that we had been eyeing off to end the week:
EUR/USD 4 Hourly:
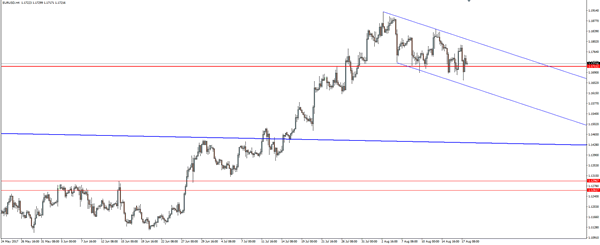
Price really had set up for the Fed's position over the weekend and boy did the pattern deliver:
EUR/USD 4 Hourly:
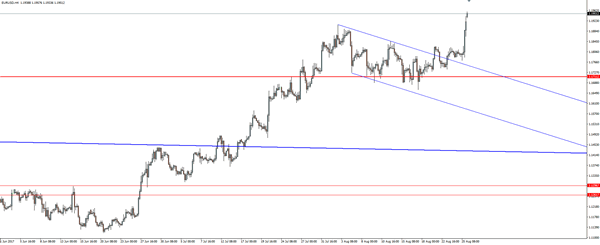
Let's wait and see how price reacts to the swing high resistance level that's now been broken and if it pulls back to retest it today. This is the make or break level for a bullish continuation to start the week.
What is the US Nonfarm Payrolls or NFP?
The United States nonfarm payrolls report is probably one of the most important economic releases every month. The nonfarm payrolls or NFP for short has a strong influence on the markets, even if it's just short-term.
Released every month on the first Friday at 0830 EST, the nonfarm payrolls report that accounts for the number of jobs. In particular, the NFP accounts for jobs in the goods, services, construction and manufacturing sectors.
Farming jobs and not for profit organizations are exempt from the report.
The Nonfarm payroll report is released the US Bureau of Labor Statistics (BLS). The report helps statisticians, economists and monetary policy makers to determine the state of the economy. The data is also used to predict the future levels of the economy.
Did you know? The Bureau of Labor Statistics was created by the US Congress with the Bureau of Labor Act, in 1884.
If you want to learn more about the Bureau of Labor Statistics, read here.
The BLS is also responsible for collecting other key statistics including the Consumer price index (CPI), Producer price index (PPI), and so on.
The nonfarm payrolls report shows the sectors that are creating employment and the sectors that are losing jobs.
What are the components of the nonfarm payrolls?
The official name of the jobs report is called the Employment Situation.
The primary components of the nonfarm payrolls report are:
- The number of jobs created during the month
- The monthly unemployment rate
- The average hours worked during the week
- The average wages earned per hour
- The labor force participation rate
While the number of subpoints in the Employment Situation report might seem a bit too overwhelming, there are only two key data points of interest. The markets mostly react to the headline numbers, which is the number of jobs created and the prevailing unemployment rate.
The BLS also revises the numbers for the past payrolls as well, and this also tends to influence the markets.
Below is a sample of how the official release of the Employment Situation looks like.
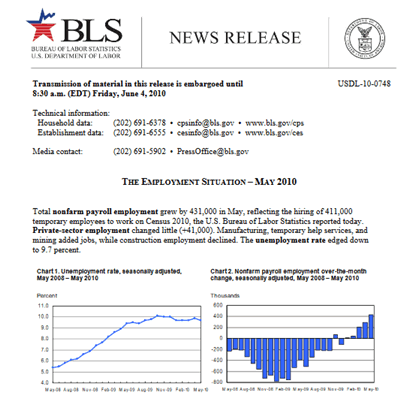
The Employment Situation report. Source: U.S. Bureau of Labor Statistics
The rather lengthy report covers all aspects of the labor market. It also goes into much deeper details such as the major worker groups, long-term unemployed and so on.
In the main jobs report, however, there are only three categories.
- Employed (People who are working)
- Unemployed (People who were laid off or looking for a job)
- Not in labor force (people who are not looking for a job)
How is the Nonfarm payrolls report used by traders?
The nonfarm payrolls report can begin to get more complex when you dig deeper. However, for the markets, the main headline numbers are the ones that matter.
That said, traders should also bear in mind on what the Fed officials are concerned about. For example, despite a strong jobs numbers, if wage growth stagnation is a risk flagged by officials, then that data point matters to the markets.
Therefore, at times you will see that despite a blockbuster report, the markets fall.
For traders, the nonfarm payrolls report is important because it brings a lot of volatility and trading opportunities.
There are many high-frequency trading algorithms dedicated to tracking the NFP release. While this may be frowned upon by some, it brings more liquidity to the markets.
Nonfarm payrolls report - Something for everyone!
What's interesting to note is that the NFP report influences all types of traders.
From the retail forex day traders to stock traders as well. There is always something for everyone watching the NFP report.
For example, a forex day trader will probably look at the NFP report to trade currency pairs such as the EURUSD, USDJPY or GBPUSD. A futures day trader, on the other hand, would be able to trade futures contracts such as the dollar futures, or even interest rate futures.
Stock traders also look to the payrolls report to see which sectors in the stock market are performing the most, by looking at the job creation data.
Finally, bonds traders can assess the economic situation based on the payrolls report and can trade the 10-year, or the Fed funds rate futures accordingly.
To conclude this brief of what is the nonfarm payrolls report; it is one of the monthly occurring events that is important for the markets across all assets. The nonfarm payrolls report released by the US Bureau of Labor statistics shows the number of jobs created during the month as well as the unemployment rate and wage statistics.
The nonfarm payrolls report is important to all, from the retail trader to central bank policymakers.
Tricks of the Trade – The Head and Shoulders Pattern, Part 2
In the previous article, Tricks of the trade - The Head and Shoulders pattern, Part 1, we look at how a few simple tweaks can increase the hit rate when trading the head and shoulders pattern. In this second part, we look at some advanced techniques which can alert you in pre-positioning your trades long before the rest of the crowd.
A with all such methods, due to the early entry the strategy does not offer great results, but when combined with other methods taking the early trade into an evolving head and shoulders pattern can result in some very good profits and in effect keeps your trades at a safer level than having to enter the head and shoulders trade along with everyone else.
Trade Entry at the right shoulder!
Another way to improve the odds and to maximize the profit potential is to identify an evolving head and shoulders pattern. This means, attempting to enter at the reversal near the right shoulder or anywhere between the right shoulder high (or low) and the decline (or rally) to the neckline support (or resistance).
The trick to catching this early entry in the head and shoulder pattern is to keep an eye on a potential neckline support or resistance level that is evolving.
The next chart below describes this visually.
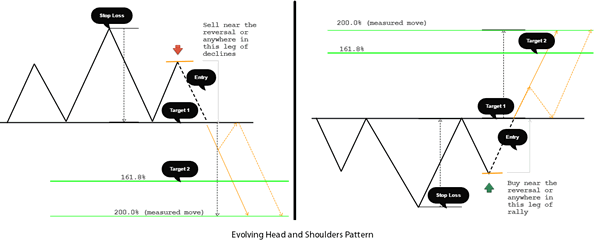
Evolving Head and Shoulders pattern
What you see here is basically buying or selling near the reversal of the right shoulder. This is of course subject to price continuing to the neckline. When the pattern is validated, you are better positioned and your profit levels are also maximized.
Risks of trading the evolving head and shoulders pattern
Catching a pattern at the early stages can be risky without a doubt. But this can be overcome by using good risk management principles and not give in to the greed and go all out on hopes that price will continue to validate the Head and Shoulders pattern.
In terms of stops, they are placed near the low or the high of the head and shoulders, which in itself should offer a fairly good risk reward, set up.
Another way to minimize the risks is to look for the right shoulder's low or high reversing near the 61.8% - 78.6% retracement of the previous wave or the head.
Example:
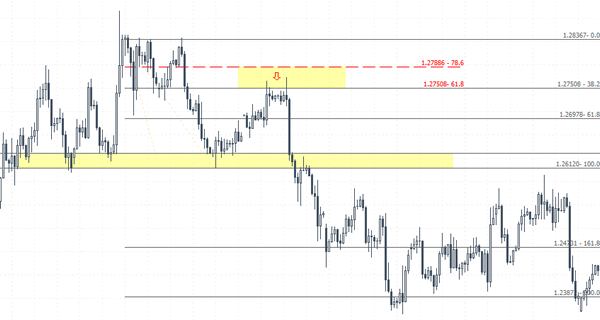
Evolving Head and Shoulders Example with entry near the right shoulder
In the above chart, you can see how Fibonacci can help to identify the reversal area. Price spiked into the 61.8% - 78.6% reversal zone before posting a strong and steady decline.
Now, if you had traded this pattern on the breakout from the neckline at 1.2612 and set your target to 161.8% at 1.2473 as the first target and the full measured move target at 1.2387, your pips in profit would have been 139 pips and 225 pips. On the flip side, your risk would be placing the stops near the right shoulder, which goes without saying vastly reduces the risk reward factor in your trade.
But had you entered anywhere after the reversal of the right shoulder, for example at 1.2697 with three targets of neckline, 161.8% and full measured move, your pips in profit would have been 85, 224 and 310 pips respectively. On the flip side, your risk would be limited to the peak of the head at 1.2836 or 139 pips.
Final Thoughts!
The head and shoulders pattern is one of the reliable reversal patterns. Using the tips outlined in this trading tutorial, you are able to trade more confidently. As they say, the early bird catches the worm. The trick is in catching a head and shoulders pattern that is still evolving which can help you to maximize your trade's potential to the fullest.
Give this strategy some practice and in due time, you won't really need to look at any other strategies or indicators.
Tricks of the Trade – The Head and Shoulders Pattern, Part 1
How to catch better entries with the Head and Shoulders Pattern? In this series of articles learn the different ways you can trade the head and shoulders chart pattern. The first part of this article deals with setting more realistic target levels on the head and shoulders pattern.
Among chart watchers and technical analysts, the head and shoulders pattern ranks among one of the top chart patterns that indicates a reversal (or rare cases a continuation) to the previous trend.
Any trader who has done a bit of studying of chart patterns would have no doubt been drawn to the allure of the head and shoulders pattern. The importance of this pattern is further accentuated by the fact that many analysts in the financial media often refer to this pattern.
The reliability of the head and shoulders pattern (which is bearish) and the bullish inverse head and shoulders pattern is further validated by Tom Bulkowski of the famed thepatternsite.com. It is not surprising therefore to note that the Head and Shoulders top is ranked 1 out of 21, meaning 'the best.' Bulkowski further goes on giving more stats such as a 4% break even failure rate and a 55% probability of price meeting its target.
You can read Bulkowski's deeper analysis on the head and shoulders pattern (along with tons of other patterns).
Anatomy of the Head and Shoulders Pattern
The Head and Shoulders pattern is very easy to spot and can be a caution for traders especially when the pattern occurs at the top end of a rally or its bearish counterpart, the inverse head and shoulders that occurs at the trough of a downtrend.
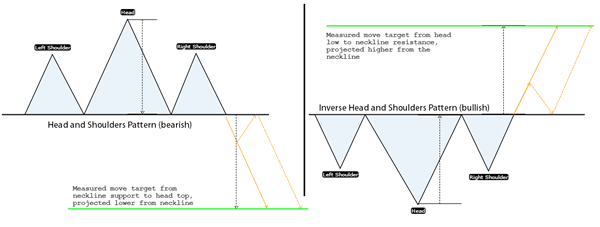
H&S and Inverse H&S Pattern Basic Structure
In the chart above, you can see the basic structure and the set up of the head and shoulders pattern (bullish and bearish). The neckline support (or resistance) is the key as a breakout from this level indicates a shift in the trend.
The most basic way to trade the head and shoulders pattern is to wait for the breakout from the neckline. Some traders prefer to wait for a retest back to the neckline while others simply buy or sell on the breakout. The target is set to a measured move, measured from the head (high or low) to the neckline (support or resistance) and projected from there on.
Drawback of the Head and Shoulders pattern
The head and shoulders pattern is more ideally suited to trade stocks or assets where volume is reliable. Typically, low volume during the formation of the right shoulder is used as one of the markers and prepares traders for the impending breakout. Volume in forex is not as reliable compared to stocks due to the OTC nature. Even if volume were to be used somehow, there is no guarantee that price will reach the target (despite more than 50% probability according to stats).
So how can a trader effectively position themselves to better make use of this reversal pattern? The following ideas can help traders.
Using a 161.8% Fibonacci Extension as the first target
Instead of a full projection in the head and shoulders, using a 161.8% Fibonacci extension as the first target, measured from the head (high or low) to the neckline (support or resistance) can beneficial for traders. The chance of price reaching the 161.8% target is much higher than the full measured move (which is basically a 200% extension). So after the first target is reached, your trade has already taken the reward off the table while leaving the remainder of the position to trade risk-free at the very least.
Example:
In the chart below you can see the relative ease at which the 161.8% Fib extension level of the head and shoulders pattern was reached. In comparison, you can notice that the full measured move of the head and shoulders pattern, prices consolidated briefly and reversed back higher.
If you account for spreads and other factors, there is a very good chance of price falling short of the full measured move target and instead of reversing.
You can also gauge that by setting the price target to 161.8% Fib extension, the initial probability of 55% can be further improved.
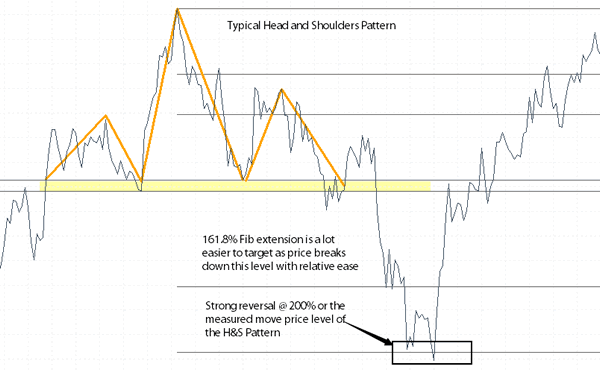
Head and Shoulders Example (161.8% and 200% Fib extension levels)
In the next article, we take a look at how to anticipate the head and shoulders pattern in advance before the pattern is formed.
Making use of a Trading Journal
Operating in the financial markets will forever be a learning process.
Even for the most experienced traders, the above is still true. For that reason, memorizing the subtle nuances of each trade is of the utmost importance, as this is how we recognize mistakes and ultimately mature as traders. How we do this is simple: keep a trading journal.
Keeping a trading journal is, if you think about it, akin to an athlete reviewing previous competitions. Too often, small, yet crucial, details are missed when trying to recall from memory. Therefore, recording your trades in a systematic fashion may reveal strategies or tendencies that can lead to improvements.
The workings of a trading journal
Unfortunately, there is no 'one size fits all' here. Some prefer to journal their trades by simply jotting a few important notes down; others, however, take it much, much further.
While there's absolutely nothing wrong with a minimalist approach here, we personally favour a more in depth profile which includes, but is certainly not limited to, the following:
- Pre-trade analysis (supported with images).
- Trade management analysis (supported with images).
- Post-trade analysis with images (supported with images).
Pre-trade report:
This section should clearly detail your reasoning BEFORE you enter into a trade. In addition, instead of just blindly writing what the market conditions were at the time, why not consider adding a chart or two to complement this, as they do say, 'a picture is worth a thousand words.' This should not really be a big deal since the chart(s) should have already been marked up.
Also just as important in this section is to determine one's exit strategy. Will you trail the position, is the risk/reward ratio favourable, are there levels of significance nearby etc.? Basically, you want to try and avoid surprise and have a plan in place for every eventuality that the market may throw your way, which includes noting any scheduled news events.
Trade management:
It is here that you have the opportunity to note your emotional state during the course of a trade. It is also recommended to supplement this section with in-trade images, as even with notes it's sometimes difficult to picture the scenario from memory.
Was the trade executed in accordance with the pre-trade report? Over and over again, we hear about traders 'jumping the gun' and entering a trade before the entry level is in play. Generally, traders enter the market too soon for fear of missing a move. Not only does this distort the initial risk/reward ratio, but it's also bad practice. Recording timing, therefore, is important to track your patience.
Other than prematurely entering a trade, do you consider deviating from the initial plan once the trade is in motion, or ever think of adding additional risk or take profits before your designated target levels? The information gleaned from trades will help provide an accurate illustration of the strengths and weaknesses of both the trader and trader's methodology. Descriptions of errors and recurring mistakes highlight the areas you need to pay heed to.
The best trading gift you can give to yourself in this section (all three sections actually) is HONESTY.
Post-trade report:
Following trade completion, it's advisable to log the outcome, win or lose. Also, as with the two sections above, adding chart images of the completed trade is beneficial to create a before-and-after scenario.
Was the trading plan followed? If it was not, dig in and find out what the reason was for abandoning your trading rules. If you committed a recurring mistake, note what your thoughts were and how you can improve on the next trade.
In closing:
At the end of each trade, save and file it. Once that is completed you can review the notes at your convenience.
Why is it that so many traders do not bother with trading journals, and likewise so many do not reach consistency in this business? Is that a coincidence? We think not! Without the historical data taken from past trades, how can one expect to grow and improve? We would say it is nearly an impossible feat as our brains can only remember so much! Therefore, do yourself a big favour today and begin a trading journal today.
The above information is, of course, not the be-all and end-all. There are likely other things one can add to their journals that may prove beneficial. It's all down to personal preference.
Is it Possible to Trade Part Time?
'But out of limitations comes creativity'. Debbie Allen.
Every endeavour has its own set of difficulties, with trading being no different! Trading the markets, even if only on a part-time basis, is incredibly challenging, and will, despite what your favourite guru may claim, take time and require a great deal of dedication.
However, the good news is that trading part time is possible!
Once you have a strategy in place as well as a written trading plan, all one then needs is a little creative planning and the discipline to follow your schedule and rules or engagement. Unfortunately, research shows that a lot of traders enter the markets with unrealistic expectations and little preparation.
Don't confuse part-time trading with 'hobby' trading!
A lot of traders, particularly those who are new to the business, mistakenly view trading as a hobby. Trading is a serious business and should always be treated as such, be it as a part-time venture or as one's day job. If you intend on using the markets as a place for amusement or somewhere to have a bet every now and then, you may as well chuck whatever funds you have in your account in the garbage. Better still, send it to a noteworthy charity!
Part-time trading, in our humble view, is not so different to many other businesses in terms of the preparation and planning required. If we think about it rationally for a minute, can you imagine a part-time doctor, lawyer or businessman approaching their business as a hobby? Highly unlikely! So, why should it be any different for trading?
How do I approach part-time trading?
For those with limited time and resources due to work or life commitments, you're going to need to develop a trading schedule that fits your lifestyle. Obviously, each trader has different time constraints, so we felt it'd be best to look at three individual traders to help illustrate how one could look to schedule their trading days:
Trader A has a full-time job and absolutely despises the lower timeframes. He believes, rightly or wrongly, that the lower timeframes are nothing more than noise and should be avoided at all costs.
His job involves him being away from the screen for most of the day (8am-6pm). Thus, he focuses his efforts on the H4 charts and above. An hour before work, he sits down and analyses his chosen markets, altering any positions he may have on, and placing new orders. Upon returning home, he'll scan the market once again for any developments for an hour or so before dinner, and then call it a day. So, all in all, he spends approximately two hours a day behind the screens.
Trader B also has a full-time job, but is lucky enough to be an I.T engineer. This enables him to have the trading platform running in the background. Although he is not at his desk all of the time, he is able to comfortably watch the H1 timeframes (and above) regularly throughout the day.
However, his schedule involves him analysing the charts an hour before work, as well. The reason being is that he likes peace and quiet when exploring the markets for opportunities. Once his levels are marked for the day, he can simply monitor the market using trade alerts from his work station.
Trader C works a part-time job and favours the M15 charts and lower i.e. the lower timeframes. She lives in Asia and finishes her morning shift two hours prior to the London open. Fortunately, she is able to be at the screen for the entire London segment and usually finishes trading by London's lunchtime.
As you can see from the above examples, it's important to select which timeframe(s) to trade and organise a time to analyse the markets when trading part time. You may have also noticed that all three traders use a manual trading methodology, but there are some that focus on automated trading. As far as we're aware, there's a variety of automated trading programs with a full spectrum of functions available on the market. Some may be able to monitor currency prices in real time, place market orders, recognize spreads and automatically place the trade. So, this could be an avenue you may want to investigate if automation is what you're seeking.
Finding the right markets to trade
In addition to arranging a time to be at the screens and choosing the timeframes to base your trades from, appointing which markets to focus on is just as important.
For instance, Trader C only trades the GBP/USD and the EUR/USD pairs as they not only have tight spreads, but also tend to be most active during the London segment. Trader A on the other hand, watches ten currency pairs and also the US dollar index for correlation purposes. Given that he trades much slower timeframes, this enables him to watch more markets. Trader B, nevertheless, chooses to focus on only four currency pairs. He could watch more pairs, but prefers it this way as he also likes to keep up with the fundamental influences surrounding the currencies he trades.
Final word…
Having a full or part-time job, we believe, helps alleviate the stresses that come with trading full time. Not having to rely on your trading profits lessens the psychological impact which is an aspect a great deal of traders struggle with. So, with that being said, does trading part time, with the safety net of a full-time salary, give one a greater chance of success? Certainly something to think about!