
Sample Category Title
Eco Data 8/29/17
[php_everywhere] [/php_everywhere]
Eco Data 8/28/17
[php_everywhere] [/php_everywhere]
Summary 8/28 – 9/1
Monday, Aug 28, 2017
[php_everywhere] [/php_everywhere]
Tuesday, Aug 29, 2017
[php_everywhere] [/php_everywhere]
Wednesday, Aug 30, 2017
[php_everywhere] [/php_everywhere]
Thursday, Aug 31, 2017
[php_everywhere] [/php_everywhere]
Friday, Sep 1, 2017
[php_everywhere] [/php_everywhere].
Weekly Economic and Financial Commentary: Global Economic Growth Steadies Pace
U.S. Review
Housing Sales are Constrained by Inventories
- With a data calendar on the lighter side, current housing market conditions took center stage. Sales were down for both new and existing homes, as activity was constrained by the shortage of homes on the market and under construction.
- We also got the first piece of hard data from the factory sector in July. Headline durable goods orders declined as the volatile component, aircraft orders were down. The underlying details were more positive and showed the manufacturing sector had solid momentum going into the second half of the year.
Data Focuses on Home Sales as Fed Heads to Wyoming
New home sales, existing home sales and durable goods were the highlights of the economic calendar this week. Fresh housing data reiterated that lean inventory is restraining sales activity. Durable goods orders continue to show gradual improvement, though the headline declined as expected due to volatile aircraft orders.
New home sales posted a 9.4 percent monthly drop in July to a 571,000-unit pace, but June's print was revised up 20,000 units to 630,000. While 9.4 percent in one month is eye-catching, new home sales are notoriously volatile and gains or drops of that magnitude are not unheard of. July's print was more of a stumble, and the trend in new home sales remains on a steady upward trend. Demand for new homes appears to be improving further, according to our NAHB/Wells Fargo homebuilder survey, which rose solidly in August. July's stumble in sales alleviated some pressure on inventories, as the months' supply of homes rose. Most of the increased inventory of new homes for sale were either under construction or not yet started. In addition, sales were up on the month for homes not yet started. This suggests that demand remains strong, and the shortage of existing homes on the market further boosts the need for new home development.
Developers are optimistic about demand for new stock, but available building lots are lacking amid increasingly prohibitive construction costs, which are exacerbated by a shortage of labor. These pressures not only inhibit new home sales, but existing homeowners are reluctant to put their home on the market and risk not finding a trade-up home in their price range.
Persistently lean inventories continued to restrain resales in July, with existing home sales registering a slight decline of 1.3 percent to a 5.44 million-unit pace from 5.51 million units in June. The median price of existing homes slipped slightly from its record high in June, while the average price rose to another record. The typical home was on the market for 30 days in July, up from 28 days in June but still marked the fourth month in a row that homes were on the market for less than a month. The solid job market and low mortgage rates support demand, but the dearth of inventory is pushing prices up faster than incomes are rising. Durable goods declined 6.8 percent in July, which we expected as Boeing orders came down to 22 in July, down from 184 in June. The underlying details of the report indicated factory conditions were much better than the headline suggests. Orders for capital goods, excluding aircraft and defense, were up a solid 0.4 percent in July after June's flat reading. Shipments in the same category, which is a useful gauge for the business investment category in the GDP calculations, rose 1 percent in July. The three-month annualized pace accelerated for orders and shipments of core capital goods, a welcome shift in momentum which bodes well for GDP growth in the second half of the year.
Kicking off the Fed's annual symposium in Jackson Hole this morning, Janet Yellen spoke about the financial system and gave little hints on monetary policy this year.
U.S. Outlook
Consumer Confidence • Tuesday
Consumer confidence rebounded to 121.1 in July, its second highest reading in 16 years. Strong assessments of the labor market have helped keep the index riding high since last year's election. The difference in the share of respondents reporting jobs were "plentiful" versus "hard to get" hit a fresh cycle high last month, as did the share of respondents rating business conditions as "good."
We expect the Consumer Confidence Index gave back some ground in August but remained strong at 118.8. The labor market has been solid with initial jobless claims edging lower over the month, but a pullback in the stock market and recent rise in gasoline prices suggest the index will pare back last month's gain.
Previous: 121.1 Wells Fargo: 118.8 Consensus: 120.0
Employment • Friday
After a slowdown this spring, monthly hiring broke back above 200,000 jobs in June and July. We expect another solid payroll print for August. Initial jobless claims declined in recent weeks, consistent with fewer layoffs. Meanwhile, the most recent readings on job openings and difficulty filling open positions sit at cycle highs. However, the BLS has historically underestimated the initial August print more than any other month. Therefore, we suspect the payroll figures will show a more modest gain in August of 186,000 jobs.
The unemployment rate likely stayed at 4.3 percent following two months of above-trend gains in the household measure of employment.
Previous: 209,000 Wells Fargo: 186,000 Consensus: 180,000
ISM Manufacturing • Friday
The ISM manufacturing report showed growth in the factory sector cooled a bit in July but that activity continued to expand at a solid pace. The index slipped 1.5 points to 56.3, which was still well above last year's average of 51.5. Strengthening global growth, relatively steady commodity prices and the recent weakening in the dollar have all lent support to the factory sector.
However, with the recovery from last year's soft patch well established, incremental gains are becoming tougher to come by. We look for the ISM manufacturing index to slip to 56.1 in August, indicating a slightly slower pace of growth in the factory sector.
Previous: 56.3 Wells Fargo: 56.1 Consensus: 56.5
Global Review
Global Economic Growth Steadies Pace
- After several years of below trend growth for the global economy, the signs of a strengthening pace observed earlier this year seems to be giving way to some steadying of the pace of economic growth.
- In Germany, the PMI Markit/BME manufacturing index improved to 59.4 in August versus a 58.1 reading in July, perhaps dispelling some of the market's concern over whether the slight decline in July was an indication of a slowdown in economic activity.
- In Japan, the year-over-year consumer price index increased as expected, up 0.4 percent, the fourth consecutive 0.4 percent year-over-year increase.
Global Economic Growth Steadies Pace
After several years of below trend growth for the global economy the signs of a strengthening pace observed earlier this year seems to be giving way to some steadying of the pace of economic growth. In Germany, the PMI Markit/BME manufacturing index improved to 59.4 in August versus a 58.1 reading in July, perhaps dispelling some of the market's concerns over whether the slight decline in July was an indication of a slowdown in economic activity. In addition, the 59.4 reading in August was very close to the 59.6 print in June, which was the highest print on record. However, perhaps the most important information we got from this index in August is that economic growth in Germany has steadied since the beginning of this year. The same can be said for the PMI services index, which increased marginally from 53.1 in July to 53.4 in August. Meanwhile, the ZEW current situation index also improved marginally, from an 86.4 reading in July to an 86.7 print in August. However, the expectations index declined more than expected, from 17.5 in July to 10.0 in August. This could also be a sign of a steadying pace of economic growth for the German economy. Meanwhile, the IFO business climate index slowed marginally in August, from 116.0 in July to 115.9. However, the expectations index improved from 107.3 to 107.9 while the current assessment index dropped from 125.5 to 124.6.
The Eurozone Markit manufacturing PMI also moved higher, from 56.6 in July to 57.4 on August, probably reflecting the increase we saw in Germany but also supported by a higher manufacturing PMI in France. Germany and France are the two largest economies of the common market. These results may end the discussion of an approaching slowdown in economic activity in the region. Furthermore, even though the services PMI fell slightly in August, from 55.4 to 54.9, the service sector in the Eurozone is still expanding at a healthy clip. The services PMI hit a series' high of 56.4 in April of this year.
In Mexico, final numbers for the second quarter of the year showed a resilient, albeit weak, economy with quarter-overquarter growth up 0.6 percent. On a year-earlier basis, however, the economy slowed down to 1.8 percent due to the Easter holiday effect, which fell in the second quarter this year compared to the first quarter last year. Demand-side numbers are not available at this time. However, we are concerned with the pace of consumer demand. Retail sales increased only 0.4 percent in June yearover- year after growing 4.1 percent for the year ending in May. Furthermore, retail sales declined for a second consecutive month on a month-over-month basis, this time by 1.1 percent.
In Japan, the year-over-year consumer price index increased as expected, up 0.4 percent, the fourth consecutive 0.4 percent yearover- year increase. So, even as Japanese economic growth surged in the second quarter of the year, price pressures remain contained, which in normal circumstances would be a good thing, but with the recent history of the Japanese economy, it does not help much. This will keep the Japanese central bank from joining the rest of the central banks in the developed world that have started to tighten monetary policy.
Global Outlook
Japanese Industrial Production • Thursday
Real GDP in Japan grew at an annualized rate of 4.0 percent in Q2-2017. It was the sixth consecutive quarter in which Japanese GDP growth was positive on a sequential basis, which represents the longest winning streak in more than a decade.
The usual end-of-the-month Japanese data barrage that is slated for next week will give investors a sense of the current state of the economy in Japan. Data on industrial production (IP) will print on Thursday. The 2.2 percent jump in IP in June means that the Japanese factory sector came into the third quarter with a fair amount of momentum. Although the consensus forecast looks for some pullback in production in July, the upward trend in IP probably remains intact. Other important data releases for July that are on the docket next week include the labor market report, retail sales, and housing starts.
Previous: 2.2% Consensus: -0.3% (Month-over-Month)
Brazilian GDP • Friday
The Brazilian economy experienced a deep recession in 2015 and 2016 with real GDP nosediving 8 percent over that period. However, the recession came to an abrupt end in Q1-2017 with real GDP growing more than 4 percent at an annualized rate. Although the year-over-year rate of growth remained in negative territory in Q1, we look for it to return to positive territory—we estimate that real GDP rose 0.5 percent on a year-ago basis in Q2.
The GDP release should be the data highlight of the week in Brazil, but one of the many CPI inflation indices will also be released next week. Inflation in Brazil has receded sharply this year due to the generally depressed nature of the Brazilian economy and the stabilization in the value of the currency. This marked decline in inflation has given the central bank scope to slash its main policy rate this year. Most analysts look for further monetary easing in coming quarters.
Previous: -0.4% Wells Fargo: 0.5% Consensus: 0.1% (Year-over-Year)
Canadian GDP • Friday
Real GDP in Canada grew at an annualized rate of 3.7 percent in the first quarter, which lifted the year-over-year rate of GDP growth to a 10-quarter high of 2.3 percent. Growth was broad-based in Q1, with real personal consumption expenditures growing in excess of 4 percent and investment spending surging 10.0 percent. Real GDP growth would have been even stronger in Q1 had imports not jumped nearly 14 percent. GDP data for the second quarter will print on Friday. Although we look for some deceleration on a quarterly basis—we forecast that real GDP grew 2.4 percent in Q2— a surge in monthly GDP for May suggests upside risk both for this quarter as well as our published forecast of 2.7 percent for full-year 2017 growth. With the economy showing signs of strength, we look for the Bank of Canada to follow the 25 bps rate hike that it announced last month, with another increase in its main policy rate as early as its October meeting.
Previous: 3.7% Wells Fargo: 2.4% Consensus: 3.6% (Quarter-over-Quarter, annualized)
Point of View
Interest Rate Watch
If Unsustainable, It Will Stop
Given the pattern of slower-than-expected inflation, and thereby higher-thananticipated real interest rates, the implied future pattern of the federal funds rate implied in the FOMC's dot plot is unsustainable.
Lower Inflation
As illustrated in the top graph, the upward swing for inflation since early 2015 has broken down and actual inflation, measured by several series, has actually declined since the start of the year.
Therefore Higher Real Rates Ahead?
A rising tension between implied FOMC increases in the nominal funds rate and continued moderate inflation (middle graph) gives rise to higher real rates and increased tighter restraint on the shortterm credit markets.
Over this same period, we anticipate that top-line revenue growth at firms will be limited given the state of global competition and modest gains in nominal GDP. Meanwhile, the lag of productivity gains to offset even the modest rise we have seen in labor compensation dictates a rising unit labor cost pattern that will exert a squeeze on corporate profits.
As illustrated in the middle graph, the balance between the nominal funds rate and the PCE deflator starts 2018 at zero and therefore implies a rise in the real rate of interest and the gap disappears entirely by the end of 2018.
So What Is the Bias on Risk?
From our vantage point, the bias on risk is to the downside on inflation and thereby for higher real short-term interest rates than currently discounted by the FOMC, and possibly the financial markets.
As illustrated in the bottom graph the probability of disinflationary pressure, lower inflation than in the recent past, six months ahead is around 40 percent compared to a rise in the pace of inflation of just about 10 percent. The probability of stable prices comes in at 50 percent. As a result, our view is that the path of the fed funds rate increases implied in the current dot plot pattern is unsustainable and thereby unlikely to come about.
Credit Market Insights
Mortgage Delinquencies Improve Q2
The Mortgage Bankers Association of America (MBA) released second quarter data this week on mortgage delinquencies in the United States. The data showed that on a seasonally adjusted basis total past due mortgages improved to 4.24 percent in the quarter, compared to 4.71 percent in Q1. This quarter's reading was the lowest level since Q2-2000.
Seriously delinquent mortgages, those past 90 days due, fell 27 bps to 2.49 percent which is a ten-year low. Mortgage loans in foreclosure also improved to 0.26 percent, which is a 6 basis point improvement over the year. The improvement in mortgage delinquencies was broad based in the quarter, as the rates dropped in every delinquency category across all loan types: conventional, Federal Housing Association (FHA), and Veterans Affairs (VA). The FHA and VA mortgages fared particularly well, as the FHA reached 7.94 percent and the VA registered 3.72 percent. Respectively, these are the lowest levels since 1996 and 1979.
The encouraging delinquency statistics this quarter are being pushed by the strong job growth seen in the first half of the year, according to the MBA. Rising home prices and affordability concerns could become cause for reversal of the improving mortgage delinquency figures, however, as slower relative income growth to home prices could slash loan-to-value ratios.
Topic of the Week
Border Wall Blocking Legislative Progress?
Congress returns from its August recess Tuesday September 5 with a long to-do list of legislative deadlines, including lifting the debt ceiling, funding the government beyond the end of September, reauthorizing a number of federal programs and passing a budget resolution to serve as the vehicle for changes to tax law. Our expectation is that the debt ceiling will be lifted before the projected September 29 deadline with bipartisan support. We have a bit more concern about the path forward on funding the federal government beyond the end of September. The probability of a partial federal government shutdown rose this week with President Trump's speech at a campaign rally where he stated "if we have to close down our government, we're building that wall."
While we have increased our probability of a government shutdown to 35 percent, we still think a funding bill will clear Congress before federal funding runs out. The most likely outcome given the very short timeline entails passing a continuing resolution (CR) that funds the government through the first or second week in December. Kicking the can to December will buy more time for a longer-term funding bill to be worked out in the remaining months of the year and allow Congress to turn to the other legislative deadlines it is facing in September. The CR will require at least eight Democrats to join with Republicans to keep the government functioning, making funding for a border wall unlikely. Should the President veto a CR passed by Congress if it does not contain border wall funding, it is unlikely that the bill would have a veto-proof majority and thus a partial federal government shutdown would result. Beyond the optics of a partial government shutdown, such actions could also put at risk the possibility of tax cuts progressing anytime soon.
The Weekly Bottom Line: Washington Likely to Keep Markets on Edge
U.S. Highlights
- A very quiet week for economic data had markets anticipating Chair Yellen's remarks at Jackson Hole. Her speech largely went over old ground on financial stability and the role of regulation.
- Next week, President Trump is expected to join the chorus of Republicans promoting tax reform. We still don't know the details, but September is likely to see the debate heat up as Congress gets down to brass tacks writing legislation.
- Add to that the potential for an 11th hour solution on the debt ceiling and funding government beyond September, and investors could be kept on the edge of their seats over the next couple of months.
Canadian Highlights
- NAFTA negotiations this week progressed behind closed doors, as the U.S. President repeated a campaign threat to repeal the agreement, suggesting a tough bargaining stance.
- Retail trade data this week confirmed that household consumption would contribute strongly to economic growth in the second quarter, owing largely to a continuation of solid performance for consumer durables.
- Looking ahead, rising interest rates and weaker home prices are likely to provide material headwinds to household consumption growth.

U.S. - Washington Likely to Keep Markets on Edge
September is likely to keep markets on the edge of their seats awaiting details of tax reform plans, and the potential for fireworks surrounding the debt ceiling and funding government beyond September (see recent report). The GOP surely needs some kind of legislative achievement to show voters in the mid-term elections, raising the stakes to get some kind of tax reform done in short order. Last week's market turmoil demonstrated just how sensitive markets are to signs that Trump might not be able to implement his lower-tax pro-business agenda.
President Trump is scheduled to start making speeches in support of tax reform next week. Joining in with the chorus of GOP Members of Congress stumping their tax reform plans throughout August. But, we still do not know the details of what that agenda will look like. The high level statement of principles released before the August recess by the "Group of Six", was meant to give direction to the two tax-reform writing committees (House Ways & Means and Senate Budget) that will hash out the gory details of the package in September.
We know the controversial border adjustment tax is off the table. Reading between the lines of the statement, they are (not surprisingly) seeking to lower the corporate tax rate, lower taxes for "pass-through" businesses, and likely move towards full expensing of capital expenditures. Recent leaks from the process suggest a corporate rate between 22-25% is being considered. The Tax Foundation has estimated that reducing the CIT rate to 25% and allowing full expensing costs $1.2 trillion (tn) over ten years. On the flip side, eliminating the deductibility of interest payment would generate $1.2 tn, at current tax rates. Allowing companies to repatriate cash from overseas at a one-time low tax rate, is almost certain to be included and would generate between $140-150 billion.
On the personal side, there is talk of capping the mortgage interest deduction. That could generate over $300 bn if it is the level of eligible debt is capped at $500K, and would largely be paid by taxpayers in the top 20% of incomes. Repealing the state and local tax deduction, would also generate significant revenue (potentially $1.7 tn). These "pay-fors" could fund lower personal tax rates or double the standard deduction, which would improve simplicity, and benefit middle-income taxpayers the most.
On a back of the envelope basis, these potential tax changes don't yet appear to be deficit neutral. There are three ways the GOP can overcome this: cut government spending, reduce the size of tax breaks or allow tax cuts to "sunset" like the Bush tax cuts. A sunset clause would create a new fiscal cliff ten years down the line and reduce the economic impact of he changes. Budget proposals have between $4 tn (Trump) and nearly $7 tn (House) in spending cuts relative to CBO's baseline. While these are unlikely to pass in their current form, they would generate plenty of fiscal room for tax cuts. Or, the GOP could opt for a much more modest package, and call it a "down payment" on further reforms they could implement if they manage to secure a filibuster-proof majority in the Senate in 2018. With markets clearly sensitive to developments in Washington, this fall should prove to be exciting, for better or worse.
Canada - Strong Household Spending to Wane
The week prior to quarterly Canadian GDP releases are typically quiet, and this week was no exception. Earlier in the week, the U.S. President repeated a campaign threat to scrap NAFTA, revealing a tough bargaining stance less than a week after negotiations began. While initially this threat caused the Canadian dollar to selloff slightly, this quickly reversed later in the week following the release of June's retail trade data.
Retail sales rose 0.5% month-on-month in June, marking the sixth consecutive increase in volume terms. This was the last piece of evidence to confirm that household consumption has contributed strongly to second quarter economic growth. Indeed, the 8.8% (quarterly annualized) rate of expansion in retail sales volumes follows on the heels of two stellar performances in the previous two quarters. Overall, we anticipate that next week's Statistics Canada report will reveal the Canadian economy expanded at a 3.7% quarterly annualized rate, with household consumption contributing more than two percentage points for the second consecutive quarter.
With second quarter economic growth now all but confirmed, the obvious question is what does this mean for future economic activity. More directly, how long can Canadian households sustain this level of spending? The average Canadian household is highly indebted (Chart 1), largely owing to mortgage growth when the housing market was in an upcycle in an ultra-low interest rate environment. In addition, recent strength in consumer spending has been fueled by the purchase of consumer durables; big-ticket items such as cars, trucks, furniture and appliances.
Global and domestic interest rates are clearly on the rise. The economic recovery in a number of advanced economies is nearly complete, and monetary policymakers are looking to remove the extraordinary measures undertaken to help combat the Great Recession. The Fed is on track to begin balance sheet normalization this fall, and will likely raise rates by a cumulative 75bps by the end of 2018. Similarly, robust economic activity in Canada to date should lead the Bank of Canada to remove remaining emergency stimulus this year, then tighten monetary conditions twice more in 2018.
Given the reliance of Canadian consumption on household credit and house price related wealth effects (Chart 2), it's difficult to make a case that the recently observed pace of consumption growth can continue in a rising interest rate environment, especially absent a substantial increase in household income. Moreover, new housing regulations introduced by the provincial government, together with increased mortgage lending oversight by OSFI, seems to have at least temporarily knocked the wind out of the GTA housing market, but the ripple effects on the Canadian economy are still forthcoming.
Altogether, higher interest rates and weaker house prices are likely to provide a headwind to household consumption growth in upcoming quarters. This was noted in our June quarterly economic forecast in which household consumption growth was forecast to slow to 1.7% next year from its above 3.0% pace this year. Canadian automotive, furniture, and appliance dealers take note: enjoy the good times while they last.
U.S.: Upcoming Key Economic Releases
U.S. Personal Income & Spending - July
Release Date: August 31, 2017
Previous Result: Income 0.0% m/m, Spending 0.1% m/m
TD Forecast: Income 0.4% m/m, Spending 0.4% m/m
Consensus: Income 0.3% m/m, Spending 0.4% m/m
Headline PCE inflation is expected to reaccelerate to 1.6% in July, reflecting a 0.1% rise in prices on the month. A drag from energy prices will be offset by gains in food and core categories. We expect a 0.1% rise in the core PCE index, leaving the core inflation rate stable at 1.5% y/y. By comparison, the core CPI rose 0.1% in July, reflecting a continued drag from cellphone services and vehicle prices. We expect a similar gain in the PCE index, with downside risk given the potential for healthcare services prices to underperform the recorded rise in the CPI.
Nominal PCE (personal spending) is expected to post a solid 0.4% rise in July, providing solid footing for Q3 consumer spending which we track just under a 3% annual pace. The July gain should reflect broadly based increases across goods and services. We also expect a solid 0.4% increase in July personal income, following a flat read in the previous month that was caused by a sharp drop in dividends.
U.S. ISM Manufacturing Index - August
Release Date: September 1, 2017
Previous Result: 56.3
TD Forecast: 56.7
Consensus: 56.5
TD looks for ISM Manufacturing to rebound to 56.7 vs 56.3. Regional surveys on balance point to a pickup, as does steady growth in core manufacturing production. Forward-looking indicators (new orders) remained a robust levels through July, consistent with healthy activity in Q3. One source of downside risk in August are market risk sentiment and political risk factors, including the start of Nafta renegotiations and political controversy stemming from the administration.
U.S. Employment - August
Release Date: September 1, 2017
Previous Result: 209k, unemployment rate 4.3%
TD Forecast: 175k, unemployment rate 4.3%
Consensus: 180k, unemployment rate 4.3%
We expect August nonfarm payroll employment to moderate to a 175k pace after registering a robust 209k gain in July, which left the 6-month average little changed at 179k. While data is limited so far for the month of August, the past trend in survey and hard data indicators point to job growth well above its breakeven pace of roughly 100k. In August, we call for a small deceleration led by private services, which picked up by a strong 183k in July, and a potential contraction in mining jobs in line with the decline in rig counts. Manufacturing jobs are expected to maintain a steady pace of growth near 10k.
We expect the unemployment rate to be unchanged at 4.3%, with risks balanced as further improvement in labor participation cannot be excluded in the near-term. On wages, we expect a 0.2% m/m increase, taking in account unfavorable calendar effects that bias the monthly gain downward. The rise should lead average hourly earnings slightly higher on a year-on-year basis to 2.6% vs 2.5%. Overall, the combination of solid job growth and a pickup in wage gains argues for a hawkish report, though the market response will be tempered by concerns over low inflation and near-term political risks.
Canada: Upcoming Key Economic Releases
Canadian Real GDP - June
Release Date: August 31, 2017
Previous Result: 3.7% q/q, 0.6% m/m
TD Forecast: 3.7% q/q, 0.1% m/m
Consensus: 3.6% q/q, 0.1% m/m
The Canadian economy is expected to have expanded by 3.7% (q/q, annualized) in the second quarter of 2017 - matching its performance from the first quarter of the year. Just like in the first quarter, consumer spending (+3.9%) will provide a healthy support for economic growth with particular strength in durable goods (+8.4%) spending as auto sales rose above 2.1 million units (annualized) for the first time ever. Non-residential fixed investment (+6.3%) should also contribute strongly to growth with both equipment and structures seeing solid gains - the latter helped by rebounding drilling activity in energy producing provinces. Net trade should also provide a helping hand. After largely flat performance over the previous two quarters, exports are expected to rebound sharply (+10.6%) and outpace the still healthy import growth (+7.6%). The net trade pickup is a welcome development that came just as a key driver of growth in previous quarters, residential investment, fizzled out. After growing by 15.7% in the first quarter, residential investment (-2.5%) will decline alongside a sharp pullback in existing home sales in the Greater Toronto Area. Finally, a slower inventory build-up than in the first quarter should also provide a modest drag to growth in the second quarter.
Looking to the month of June, we expect industry-level GDP to expand 0.1%. Growth will be dragged down by real estate industry, on account of declining activity in the existing home market and goods-producing sector given the weakness in manufacturing activity during the month. At the same time, retail and leisure should provide an important offset with construction activity also likely posting a healthy gain. The relatively soft print for June GDP should provide a relatively weak handoff to Q3, where we expect growth to moderate to below 2% - a pace that's largely consistent with potential economic growth.
Dollar Awaiting Week of US Employment Reports
USD Weaker After Yellen's Jackson Hole Comments
The US dollar is lower against most majors as the central bank summit in Jackson Hole kicked off. The Euro has regained January 2015 levels on Friday. Fed Chair Janet Yellen, in what could be her last appearance at the Wyoming gathering as chief of the US central bank, focused on financial regulation with limited comments on monetary policy. Yellen's term ends in February and at this point it seems unlikely President Trump will renominate her after his criticisms of the Fed last year. Trump's chief economic advisor Gary Cohn, favourite for the Fed top job, said that tax reform will be pushed through by the end of the year. The market expectations of tax reform and infrastructure spending after Trump's victory in November have been downgraded after the administration went after more divisive policies and has spent political capital on tougher policies with little to show for it. Next week's details on tax reform could boost the US dollar if the ambitious timetable can be achieved.
US employment will guide markets as the ADP private payrolls report to be released on Wednesday, August 30 at 8:15 am starts the jobs data rollout. Analysts are forecasting a 186,000 job gain following the 178,000 jobs added in July. The biggest indicator will be released on Friday, September 1 at 8:30 am when the Bureau of Labor Statistics publishes the U.S. non farm payrolls (NFP). The last two months have exceeded expectations and the market is anticipating a 180,000 addition of new positions in August. Inflation data in the job reports will be highlighted as the Fed appears to be slowing down on its tightening policy as wages and prices remain sluggish even as the number of jobs have been steady throughout the recovery.
US economic indicators will be plentiful with the NFP closing the week but with the market also keeping an eye on consumer confidence data to be released on Tuesday, August 29 at 10:00 am by the Conference Board. American consumers have remained confident on the US economy although that confidence has not correlated highly to spending. Central bankers have not given the market any strong signals in Jackson Hole and the market will look to more hard data released during the week.
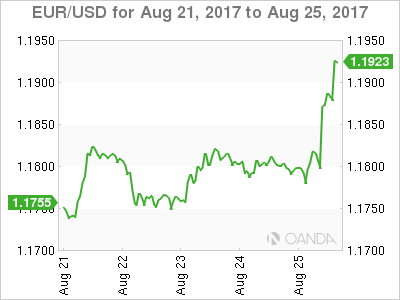
The EUR/USD rose 0.918 in the last five days. The single currency is trading at 1.1867 near weekly highs against the US dollar. The central bank summit at Jackson Hole was anticipated to bring more details on monetary policy, but instead both Janet Yellen and Mario Draghi focused on more high level themes giving very little insight on their next steps. Yellen talked about regulation and it could be read as a line in the sand against deregulating financial institutions as promised by Donald Trump, which could further jeopardize her already slim chances of staying at the Fed past February.
Mario Draghi issued a similar statement on regulation with an emphasis on free trade that seemed to target the Trump administration with its protectionist agenda. Both central bank chiefs stayed far away from commenting on foreign exchange or the particulars of their upcoming monetary policy plans even as the Fed seemed to be cooling on its tightening efforts and the European Central Bank (ECB) is being pressured by a strong currency and low inflation.

Oil rose on Friday but will remain 1.895 percent in the red for the week. The price of West Texas Intermediate is trading at $47.73 as crude inventories continue to drop in the US, a weak dollar and Hurricane Harvey could not offset the drop in the price of energy. The Organization of the Petroleum Exporting Countries (OPEC) has left all its options open as the production cut agreement has only stabilized prices but has failed at driving prices higher. Production disruptions have been the only factors moving prices higher, but that is not a sustainable strategy and despite the optimism from OPEC members there is still a long way to go toward a rebalancing of the market.
Compliance with the production cut agreement were near 100 percent before July, but have now dropped to 75 percent levels among OPEC members and even lower for other producers that signed the deal. The seasonal increase from Saudi Arabia was the biggest blow as the major backer of the agreement it had at one point overcut its production to bring the deal under full compliance.
The Energy Information Administration (EIA) will release US crude inventories on Wednesday, August 30 at 10:30 am with another drawdown of 3 million barrels expected. The impact of Hurricane Harvey could end up limiting US output. Oil production in the US has gone up dramatically and is one of the reasons prices have been low as the OPEC has not been able to reduce the global glut as demand has not grown on par with supply.
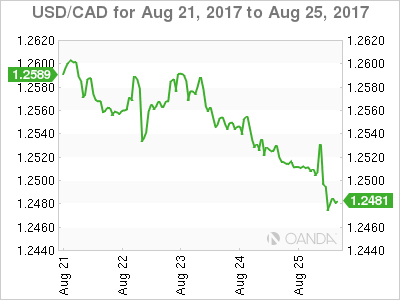
The USD/CAD lost 0.696 percent in the last week. The pair is trading at 1.2490 and is near weekly lows after the USD continues to retreat against the loonie despite lower oil prices. US durable good fell on Friday and with little support from Janet Yellen at Jackson hole the USD kept depreciating against the Canadian currency.
The US currency has been bogged down by political turmoil as Donald Trump has issued statements on the debt ceiling and NAFTA negotiations that have put downward pressure on the dollar. The US, Canada and Mexico have signed a non-disclosure agreement (NDA) on their trade talks as the uncertainty of the outcome reached a new low this week. Both the US and Mexico would like a speedy resolution ahead of elections in 2018, but with the Trump administration's comments negotiations could end sooner, but with a negative outcome for all nations.
Market events to watch this week:
Tuesday, August 29
- 10:00 am USD CB Consumer Confidence
Wednesday, August 30
- 8:15 am USD ADP Non-Farm Employment Change
- 8:30 am USD Prelim GDP q/q
- 10:30 am USD Crude Oil Inventories
- 9:30 pm AUD Private Capital Expenditure q/q
Thursday, August 31
- 8:30 am CAD GDP m/m
- 8:30 am USD Unemployment Claims
- 9:45 pm CNY Caixin Manufacturing PMI
Friday, September 1
- 4:30 am GBP Manufacturing PMI
- 8:30 am USD Average Hourly Earnings m/m
- 8:30 am USD Non-Farm Employment Change
- 10:00 am USD ISM Manufacturing PMI
*All times EDT
Canadian Dollar Higher After Jackson Hole Statements
The Canadian dollar will end the week higher against the dollary after disappointing durable goods data in the US and few details out of the central bank summit in Jackson hole offered little support for the currency that has been bogged down by political turmoil.
The loonie has been decoupled from oil prices as crude ended the week on a negative note even as Hurricane Harvey could disrupt Gulf energy producers. NAFTA talks have grabbed headlines as Donald Trump has once again threatened to pull out of the trade deal. In an effort to have a more productive first round of negotiations the three nations have signed NDAs. The trade talks kick off on September 1 in Mexico.
US employment will guide markets as the ADP private payrolls report to be released on Wednesday, August 30 at 8:15 am starts the jobs data rollout. Analysts are forecasting a 186,000 job gain following the 178,000 jobs added in July. The biggest indicator will be released on Friday, September 1 at 8:30 am when the Bureau of Labor Statistics publishes the U.S. non farm payrolls (NFP). The last two months have exceeded expectations and the market is anticipating a 180,000 addition of new positions in August. Inflation data in the job reports will be highlighted as the Fed appears to be slowing down on it's tightening policy as wages and prices remain sluggish even as the number of jobs have been steady throughout the recovery.
Canadian data will be scarce next week with the release of the gross domestic product (GDP) the main highlight to be released on Thursday, August 31 at 8:30 am EDT. Growth is anticipated to have slowed down in June with a 0.1 percent gain. Despite the lower gain the Canadian economy would have advanced 3.7 percent in annual terms, but could grow below 2 percent in the second half of the year. The lower growth will not be enough to derail the expected Bank of Canada (BoC) rate hike in October. Another 25 basis points could be added to the benchmark rate after the two rate cuts in 2015 in response to falling oil prices are no longer needed.

The USD/CAD lost 0.696 percent in the last week. The pair is trading at 1.2490 and is near weekly lows after the USD continues to retreat against the loonie despite lower oil prices. US durable good fell on Friday and with little support from Janet Yellen at Jackson hole the USD kept depreciating against the Canadian currency.
The US currency has been bogged down by political turmoil as Donald Trump has issued statements on the debt ceiling and NAFTA negotiations that have put downward pressure on the dollar. The US, Canada and Mexico have signed a non-disclosure agreement (NDA) on their trade talks as the uncertainty of the outcome reached a new low this week. Both the US and Mexico would like a speedy resolution ahead of elections in 2018, but with the Trump administration's comments negotiations could end sooner, but with a negative outcome for all nations.
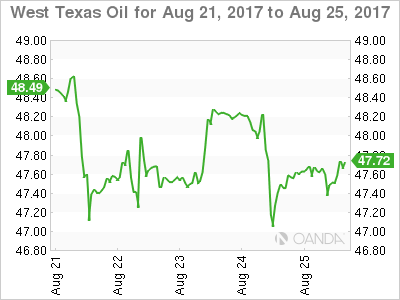
Oil rose on Friday but will remain 1.895 percent in the red for the week. The price of West Texas Intermediate is trading at $47.73 as crude inventories continue to drop in the US, a weak dollar and Hurricane Harvey could not offset the drop in the price of energy. The Organization of the Petroleum Exporting Countries (OPEC) has left all its options open as the production cut agreement has only stabilized prices but has failed at driving prices higher. Production disruptions have been the only factors moving prices higher, but that is not a sustainable strategy and despite the optimism from OPEC members there is still a long way to go toward a rebalancing of the market.
Compliance with the production cut agreement were near 100 percent before July, but have now dropped to 75 percent levels among OPEC members and even lower for other producers that signed the deal. The seasonal increase from Saudi Arabia was the biggest blow as the major backer of the agreement it had at one point overcut its production to bring the deal under full compliance.
The Energy Information Administration (EIA) will release US crude inventories on Wednesday, August 30 at 10:30 am with another drawdown of 3 million barrels expected. The impact of Hurricane Harvey could end up limiting US output. Oil production in the US has gone up dramatically and is one of the reasons prices have been low as the OPEC has not been able to reduce the global glut as demand has not grown on par with supply.
Market events to watch this week:
Tuesday, August 29
- 10:00 am USD CB Consumer Confidence
Wednesday, August 30
- 8:15 am USD ADP Non-Farm Employment Change
- 8:30 am USD Prelim GDP q/q
- 10:30 am USD Crude Oil Inventories
- 9:30 pm AUD Private Capital Expenditure q/q
Thursday, August 31
- 8:30 am CAD GDP m/m
- 8:30 am USD Unemployment Claims
- 9:45 pm CNY Caixin Manufacturing PMI
Friday, September 1
- 4:30 am GBP Manufacturing PMI
- 8:30 am USD Average Hourly Earnings m/m
- 8:30 am USD Non-Farm Employment Change
- 10:00 am USD ISM Manufacturing PMI
*All times EDT
Gold Gains On Mixed Durable Reports, Yellen Remarks
Gold has posted gains in the Friday session. In North American trade, spot gold is trading at $1291.95, up 0.44% on the day. In economic news, durable goods reports were mixed. Core Durable Goods Orders improved to 0.5%, edging above the estimate of 0.4%. However, Durable Goods Orders declined 6.8%, missing the forecast of -6.0%. At the Jackson Hole meeting of central bankers, Janet Yellen has concluded her speech and gold has responded with gains.
Friday is Day 2 of the Jackson Hole Symposium, and featured the star of the show, Federal Reserve Chair Janet Yellen. However, did not take advantage of an ideal opportunity to address US monetary policy, choosing instead to discuss financial reforms. Yellen said that measures put in place in 2007 and 2009 in response to the financial crisis had been effective, adding that future reforms should remain modest. Her comments seemed aimed at a domestic audience, as her message to exercise caution comes at a time when President Trump is looking into wide-ranging reforms in the finance industry. The pro-business Trump has complained that the financial sector is over-regulated and has said that he wants to ease current regulations.
There was some disappointment in the markets as Janet Yellen did not address interest rate policy at her speech in Jackson Hole, and the dollar responded with losses, as gold has moved higher. A December rate hike remains on the table, but the Fed policymakers have sounded lukewarm about another hike in 2017, and the odds of a rate hike in December remain below 50%. One of the principal impediments to rate hike is inflation, which remains at stubbornly low levels. This, despite solid economic growth and a labor market that is close to capacity.
Dollar Sold after Fed Yellen Did Not Mention Monetary Policy
The dollar was sold across the board after Fed chief Janet Yellen did not mention monetary policy in her long-awaited Jackson Hole speech.
Yellen said that reforms put in place after the crisis started have strengthened financial system without affecting economic growth, with future changes expected to be modest.
As most of observers expected, Yellen said nothing about monetary policy, keeping markets guessing about Fed's next steps, as most expect one more hike towards the end of the year.
Recent hawkish comments from Dudley and dovish tone from the minutes of the last FOMC meeting remain the only firm signals from Fed for now.
US central bank is likely to keep its policy unchanged in September's meeting, while current expectations for December's meeting are around 60% for no change and around 37% for a quarter-percent hike, with bets expected to decrease after Yellen stayed quiet about policy today.
Traders will be focusing FOMC's September meeting for fresh signals.
(ECB) Mario Draghi – Sustaining Openness in a Dynamic Global Economy
Speech by Mario Draghi, President of the ECB, at the Economic Policy Symposium of the Federal Reserve Bank of Kansas City, Jackson Hole, 25 August 2017
The global recovery is firming up. In some countries like the United States, this process has been visible for some years, in others like Europe and Japan, the consolidation of the recovery is at an earlier stage. So it is fitting that our discussions are now focusing not only on how to stabilise the economy, but also on how to make it more dynamic – while at the same time improving people's welfare. At the centre of this debate is the question of how to raise potential output growth, which has slowed from around 2% in OECD countries in 2000 to around 1% today.
Without stronger potential growth, the cyclical recovery we are now seeing globally will ultimately converge downwards to those slower growth rates. Slower growth will in turn make it harder to work through the debt and demographic challenges facing many advanced economies.
With the population growth rate in those economies projected to slow, the burden of raising potential growth must fall on productivity. There are a number of areas in which domestic policies can encourage an upward shift in productivity growth, such as competition, research and development, and insolvency regimes.
But when thinking about the global economy, one of the key ingredients for raising productivity is openness. Open trade, investment and financial flows play a key role in the diffusion of new technologies across borders that drive forward efficiency improvements.
The social consensus on open markets has, however, been weakening in recent years. This is driven not so much by a belief that open markets no longer create wealth, but by the perception that the collateral effects of openness outweigh its benefits. People are concerned about whether openness is fair, whether it is safe and whether it is equitable.
As Karl Polanyi observed many years ago, if the dislocation created by an open market goes beyond a certain point, protectionism is society's natural response.
So a central element of efforts to raise productivity growth – and build a dynamic global economy – must involve responding to these concerns about openness. And this is a feat countries cannot accomplish by themselves. Although domestic welfare policies are, of course, essential to the task, a commitment to working together through multilateral institutions is just as important.
This is because fears about fairness, safety and equity ultimately reflect a lack of trust in other countries' regulation and enforcement. One of the main reasons why multilateral institutions exist is to create regulatory convergence, and therefore to increase trust between countries. And perhaps the most important area where this applies today is global financial sector regulation.
Openness as the key to a dynamic global economy
One of the key questions facing the global economy is whether the trend towards ever greater economic openness, which has defined the last three decades, is coming to an end. Temporary trade barriers have indeed risen from covering around 1% of products in 2000 to more than 2.5% today, with the crisis accelerating this pattern. The same is true of anti-dumping actions.
That said, at the global level openness is still viewed favourably; three-quarters of people consider growing trade and business ties with other countries to be a positive trend. But those polled in rich countries are more negative than in the pre-crisis period.
Given the established gains of trade, this is plainly a concerning trend for the global economy. International trade results in a more efficient use of production factors and in specialisation where comparative advantage exists, thereby raising productivity growth. And welfare gains from trade for firms and consumers follow from the wider availability of cheaper and better quality products.
Moreover, for advanced economies the importance of trade may actually be growing. As economies converge towards the global technological frontier, innovation becomes more important for sustained productivity growth. And as OECD research has shown, openness to trade is a crucial factor in enabling an economy to benefit from frontier innovation.
According to OECD estimates, in the case of a 2% acceleration in multi-factor productivity (MFP) growth in a frontier economy, the productivity spillover will be 0.3 percentage points higher for a country that trades intensively with the frontier economy than for one which trades less intensively. To put this in context, MFP growth has averaged only around 0.5% in OECD countries since 2000.
Thus a turn towards protectionism would pose a serious risk for continued productivity growth and potential growth in the global economy. And this risk is particularly acute in the light of the structural challenges facing advanced economies.
Old-age dependency ratios are rising, putting more pressure on public finances. By 2025 there will be 35 people aged 65 and over for every 100 persons of working age in OECD countries, compared with 14 in 1950. At the same time, public debt levels have surged in those countries from 56% of GDP in 2007 to around 87% today. Only higher potential growth can provide a lasting solution.
So, clearly, to foster a dynamic global economy we need to resist protectionist urges. But to do so, we also need to identify how best to respond to protectionism.
The role of multilateral cooperation in making openness sustainable
Much has been written over the past few years about the negative effects of free trade and the need to pay more attention to those who benefit less from it. The debate has typically focused on the extent to which welfare policies can be used to share the gains of trade more evenly.
Though this is a complex issue, I have no doubt that making better use of public policies to support the more vulnerable members of society, not just financially but also through education and retraining, is a vital part of the equation. More work needs to be done in this area and it is important to learn from best policy practices.
But the other key question is: how can we work together to make openness sustainable? What role can multilateral cooperation play towards this goal? This is the angle I would like to address today. Its importance becomes clear when one thinks about the three main areas of concern that people have about open markets that I mentioned earlier.
First, there is the concern about whether openness is fair – i.e. whether all are playing by the same rules and applying the same standards. This manifests itself in fears about currency manipulation by trading partners, dumping practices and lack of reciprocal market access.
Second, there is the concern about whether openness is safe – i.e. whether it exposes people to harmful spillovers from abroad. This is perhaps most visible, at least for economists, in the case of cross-border capital flows, but it also applies in areas such as agriculture and biotechnology.
Third, there is the concern about whether openness is equitable – that is, whether it disproportionately benefits some groups in society over others. Though it is not straightforward to disentangle the effects of trade and technology on inequality – and they may in fact be linked – the perception that openness contributes to inequality has become more widespread.
In each case, multilateral cooperation, leading to regulatory convergence, is a precondition for addressing the underlying causes of these concerns. To demonstrate this, let me draw on our experience of managing openness within the European Union.
As regards fairness, the point is obvious: regulatory convergence provides the strongest assurance that the playing field is level right across the European market. This is why, as borders have opened within Europe, common supranational powers of legislation and enforcement have strengthened in parallel.
For example, the Single European Act in 1986 not only launched the single market, it also substantially extended the powers of the EU to make laws, the role of the European courts to rule on them, and the powers of the Commission to execute them. The logic was that a single market could only be sustainable over time if all participants could be certain that they faced the same rules, and had recourse to the same courts in the case of infractions.
Despite the political events of last year, this symmetry between regulatory convergence and market deepening has, by and large, been a success. In fact, the free movement of people, goods and services within Europe is regularly mentioned in polls as one of the two most positive aspects of the EU, the other being peace among its Member States.
Similarly, what has permitted the Single Market to survive various financial and consumer protection crises is its ability to restore safety by adapting market-wide regulation and enforcement.
To give an illustration, the internal market for frozen foods overcame the mis-selling scandal of 2013, when horsemeat was sold as beef, in large part because it was met with an improved food labelling and EU-wide inspection regime that restored trust. By contrast, a perceived lack of regulatory convergence between the EU and other countries, especially regarding food safety, is one reason for opposition to preferential trade agreements, such as the TTIP.
More fundamentally, following the sovereign debt crisis, the euro area experienced first-hand the risks of a diverging supervisory and regulatory framework for cross-border finance – and faced a serious threat of financial market fragmentation when those flows reversed. Safety was restored by elevating supervision and resolution to the European level with the banking union. This was key to re-establishing trust in the banking system and reviving cross-border capital flows within Europe. These are only the first steps, but the direction of travel has been drawn.
When it comes to the effects of openness on equity, it is admittedly less obvious how multilateral cooperation represents a solution to the fears being expressed. As I said, such fears typically have to be addressed by national distributional policies. But there is also an important international dimension, in particular related to tax avoidance.
Indeed, the problem many have with openness is not just that it redistributes income between different social groups. Almost everything that happens in a market economy – skill-biased innovation, churning of firms – redistributes income in some way, and we have in place mechanisms to deal with those outcomes, such as tax systems.
Where trade may differ from these other market forces, however, is in the perception that, in Dani Rodrik's words, it "undercuts the social bargains struck within a nation and embedded in its laws and regulations". For example, increasing openness to trade and finance is perceived by some to shift the burden of taxation from footloose capital to labour, or to create pressures to reduce labour protections to boost the competitiveness of domestic producers – the "race to the bottom".
Such perceptions, and the sense of injustice they fuel, are deeply damaging to public faith in open markets – and this is where multilateral solutions can play a role.
Addressing tax arbitrage between jurisdictions, for instance, can clearly best be achieved by countries cooperating via international institutions. Likewise, taking a stand against race-to-the-bottom dynamics that threaten labour protections, calls for a common regulatory approach. Again, our experience in Europe offers some insights into how this can work, as well as into some of the difficulties involved.
Thanks to its common legal framework, the EU has successfully upheld labour standards even as its market has expanded to lower-income countries. The Single Market has no doubt prompted some relocation of jobs across countries, and this has at times triggered fears of "social dumping". But in fact openness has not fundamentally challenged labour protections.
One main reason for this is that safeguards central to the European social model have been progressively embedded in European law, ensuring gradual convergence in labour standards among EU countries. Thus, while there is still heterogeneity, the gap between them is narrowing.
Preferences about the degree and type of social and labour protection differ across the world, and I am not claiming that those in the EU should be a model for everybody. The point here is that through multilateral decision-making, the EU has successfully built and defended the single market, addressing the perception that openness is always a source of inequality.
At the same time, in areas where unanimous decision-making is more prevalent, Europe has not always used the potential of its multilateral structure to the same extent. This is the case, for instance, in combatting profit-shifting and tax avoidance, although progress is now being made, which clearly chimes with the mood of EU citizens.
In short, there are certain concerns about equity that can most effectively – and perhaps only – be addressed through multilateral actions. As such, in tandem with well-targeted welfare policies, they are a key part of the policy toolbox for making openness sustainable.
Implications for the global economy
Clearly, the European model involves several unique features. In particular, it depends on a relatively advanced political structure that helps reconcile multilateral cooperation with democratic control, which is difficult to replicate elsewhere. Still, EU countries are generally more open than other advanced economies and perhaps have fewer problems of skewed income distribution. So what lessons can we draw for the global economy from our experience?
The most salient is that, at a time when disaffection with openness is growing, multilateral institutions become more, not less important. They provide the best platform to address concerns about openness without sacrificing open markets.
So organisations like the WTO, which make sure that trade is governed by rules and is subject to fair arbitration, remain vital to ensuring that global trade is perceived as fair and safe – while at the same time avoiding protectionism in disguise. And bodies that foster global cooperation, such as the G20, remain just as necessary to reconcile openness with equity. The OECD/G20 initiative to combat tax base erosion and profit-shifting is just one example of such cooperation.
That said – and going by our experience in Europe – the area where we need a special focus today is cross-border finance. Organisations that facilitate convergence in financial regulation and supervision, such as the Financial Stability Board and the Basel committees, are key in this context.
Within these committees, a substantial amount of work has been done since the crisis to strengthen microprudential regulation, as well as to design and calibrate macroprudential tools. This work has been essential for at least three reasons.
The first reason is that finance is the most mobile production factor, and therefore the most likely to cause dangerous spillovers. This makes convergence in financial regulation one of the most important components of a sustainable open economy.
And we should remember that diverging financial regulation would endanger not only financial openness, but also global trade, since they are often two sides of the same coin: finance and trade are complementary in spreading knowledge and underpinning global value chains. A striking feature of the global financial crisis was indeed the collapse in world trade: between the third quarter of 2008 and the second quarter of 2009 global trade volumes declined by approximately 15%.
The second reason is that we have only recently witnessed the dangers of financial openness combined with insufficient regulation. International financial flows both contributed to and propagated the global financial crisis and the ensuing collapse of trade, output and employment.
Financial integration only survived relatively unscathed because the global regulatory response was swift and decisive, creating a financial system that posed fewer risks to the world economy. Any reversal would call into question whether the lessons of the crisis have indeed been learnt – and thus whether financial integration can still be considered safe.
Third, financial regulation interacts critically with monetary policy. Lax regulation implies an underestimation by regulators of incentives which lead to behaviour that is individually profitable, but socially costly. Given the large collective costs that we have observed, there is never a good time for lax regulation. But there are times when it is especially inopportune.
Specifically, when monetary policy is accommodative, lax regulation runs the risk of stoking financial imbalances. By contrast, the stronger regulatory regime that we have now has enabled economies to endure a long period of low interest rates without any significant side-effects on financial stability, which has been crucial for stabilising demand and inflation worldwide.
With monetary policy globally very expansionary, regulators should be wary of rekindling the incentives that led to the crisis.
To design and agree, in reciprocal trust, a regulation that preserves financial stability without unnecessarily restricting the flow of credit to the economy, while revisiting the post-crisis regulatory framework where necessary, the FSB and the Basel committees remain essential. This is also because, for large economies, changes in domestic regulation have international consequences. Global financial conditions account for 20-40% of the variation in countries' domestic financial conditions, as shown by recent research from the IMF.
Conclusion
Let me conclude.
To inject more dynamism into the global economy we need to raise potential output growth, and to do so with ageing societies we need to lift productivity growth. For advanced economies that are close to the technological frontier, this depends crucially on openness to trade.
Yet openness to trade is under threat, and this means that policies aimed at answering this backlash are a vital part of the policy mix for dynamic growth. Some of those policies can be implemented domestically, but some can only be effectively enacted through multilateral cooperation.
Multilateral cooperation is crucial in responding to concerns about fairness, safety and also equity. By encouraging regulatory convergence, it helps protect people from the unwelcome consequences of openness. And protection ensures that we do not lapse into protectionism over time.
The European experience provides some insights into the opportunities and challenges involved. It also shows the importance of ensuring that, at all times, openness remains under democratic control. Multilateral institutions are necessarily staffed by experts. But it is essential that they always remain accountable to elected representatives who set the parameters and have the final say.