
Sample Category Title
Trade Idea Update: USD/CHF – Hold long entered at 0.9620
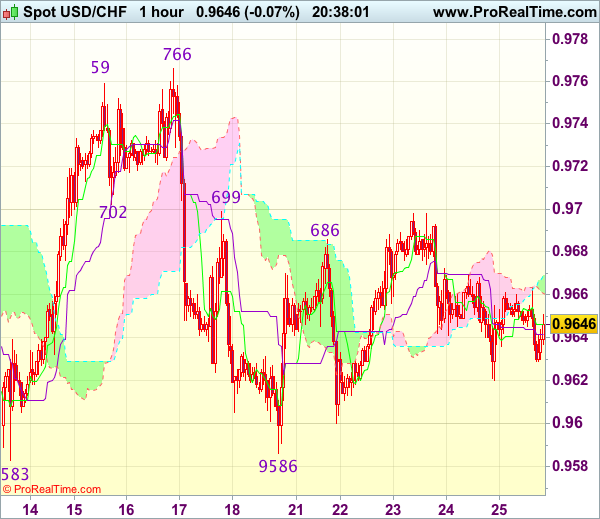
USD/CHF - 0.9649
Original strategy :
Bought at 0.9620, Target: 0.9720, Stop: 0.9595
Position : - Long at 0.9620
Target : - 0.9720
Stop : - 0.9595
New strategy :
Hold long entered at 0.9620, Target: 0.9720, Stop: 0.9595
Position : - Long at 0.9620
Target : - 0.9720
Stop : - 0.9595
Although the greenback retreated after faltering below resistance at 0.9699, outlook remains consolidative and reckon yesterday’s low at 0.9620 would limit downside, bring another rebound later, above indicated resistance at 0.9699 would signal the fall from 0.9766 has ended at 0.9586 last week and mild upside bias is seen for gain to 0.9720, then 0.9740, having said that, reckon resistance at 0.9766-73 would cap upside and bring further consolidation. Only a break of 0.9773 would retain bullishness and signal early rise from 0.9438 has resumed and extend gain to 0.9800.
In view of this, we are holding on to our long position entered at 0.9620. Below 0.9600 would risk test of strong support at 0.9583-86 but only break there would signal a downside break of recent broad range has occurred, bring subsequent fall to 0.9550.
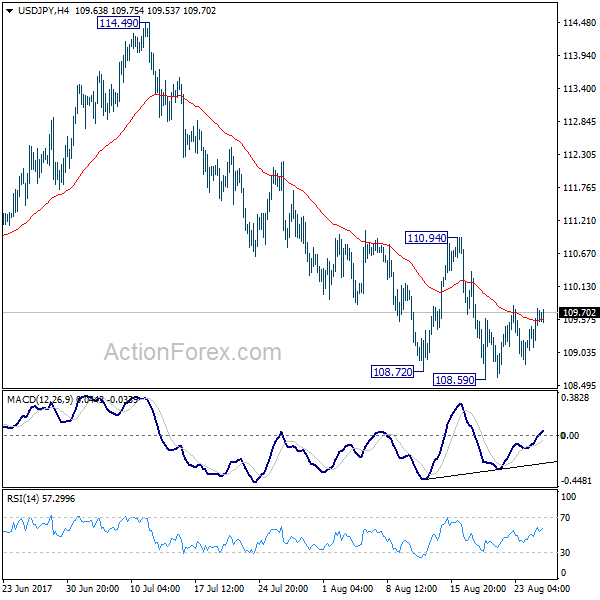
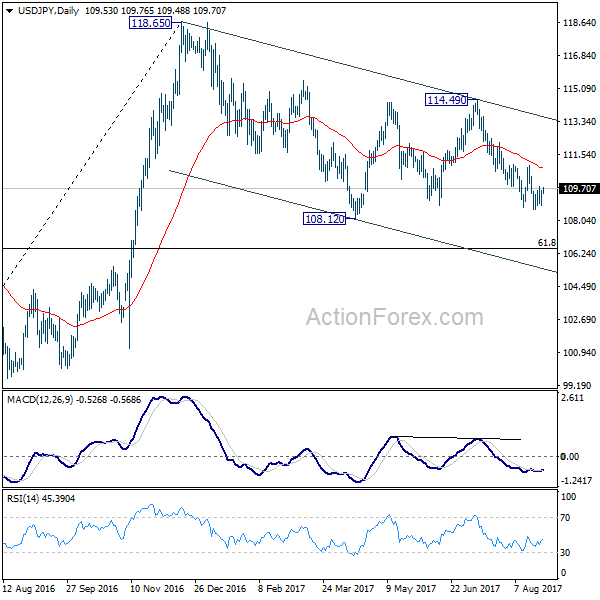
USD/JPY Mid-Day Outlook
Daily Pivots: (S1) 109.05; (P) 109.33; (R1) 109.81; More...
USD/JPY recovers mildly today but it's staying well below 110.94 resistance. Intraday bias remains neutral with bearish outlook. Deeper decline is still expected. Break of 108.59 will target a test on 108.12 low. Whole corrective decline from 118.65 is possibly resuming and break of 108.12 will target 61.8% retracement of 98.97 to 118.65 at 106.48. Nonetheless, firm break of 110.94 will indicate short term bottoming and turn bias back to the upside.
In the bigger picture, the corrective structure of the fall from 118.65 suggests that rise from 98.97 is not completed yet. Break of 118.65 will target a test on 125.85 high. At this point, it's uncertain whether rise from 98.97 is resuming the long term up trend from 75.56, or it's a leg in the consolidation from 125.85. Hence, we'll be cautious on topping as it approaches 125.85. If fall from 118.65 extends lower, downside should be contained by 61.8% retracement of 98.97 to 118.65 at 106.48 and bring rebound.
Trade Idea Update: GBP/USD – Buy at 1.2755
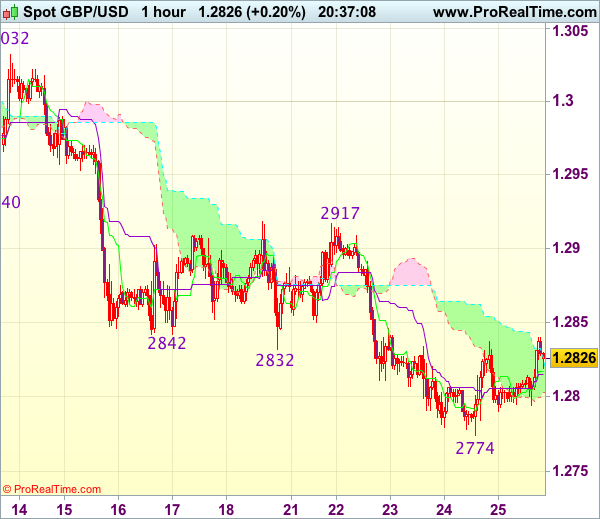
GBP/USD - 1.2804
Original strategy :
Buy at 1.2760, Target: 1.2860, Stop: 1.2725
Position : -
Target : -
Stop : -
New strategy :
Buy at 1.2755, Target: 1.2855, Stop: 1.2720
Position : -
Target : -
Stop : -
As cable has retreated again after meeting resistance at 1.2837, retaining our view that near term downside risk remains for recent selloff to extend one more fall, however, loss of downward momentum should prevent sharp fall below 1.2750-55, risk from there has increased for a rebound to take place soon, above 1.2845-50 would suggest a temporary low is possibly formed, bring a stronger recovery to 1.2870, break there would add credence to this view, then retracement of recent decline would commence for further gain to 1.2900.
In view of this, we are inclined to turn long on next decline. Below 1.2740-50 would risk weakness to 1.2720-25, however, still reckon downside would be limited to 1.2700-05 (100% projection of 1.3269-1.2940 measuring from 1.3032) and risk from there remains for another rebound to take place later.
Yen Lower on Risk Appetite, Trading Subdued ahead of Yellen and Draghi
Trading remains relatively subdued as markets await speeches of Fed chair Janet Yellen and ECB President Mario Draghi at Jackson Hole symposium today. Yen is trading generally lower following mild come back in risk appetite. Major European indices are in positive zone while US futures point to higher open. On the other hand, dollar is trading broadly lower as comments from Fed officials in the symposium continue to show division on views on December hike. Sterling is trading mildly higher today but remains one of the weakest over the week. Released in US, durable goods orders dropped -6.8% in July, below expectation of -5.8%. Ex-transport orders, however, rose 0.5%, above expectation of 0.4%.
Bundesbank: ECB's QE helped growth but not inflation
According to Bundesbank's report, ECB's EUR 2.3T asset purchase program did little to lift inflation even though it propped up growth. The paper concluded that "we find that ECB balance sheet policies, in the form of direct asset purchases, bring down financial stress for some periods after the shock." And, "this positive effect is reversed thereafter as stress increases above its pre-shock level." And, "at the same time, asset purchase shocks have an expansionary effect on economic activity, while the effect on prices remains insignificant."
German Ifo dropped 0.1 in August
German Ifo business climate dropped slightly to 115.9 in August, down from 116.0 but beat expectation of 115.5. Expectation gauge rose to 107.9, up from 107.3 and beat expectation of 106.8. Current assessment gauge dropped to 124.6, down from 125.5, below expectation of 125.0. Ifo president Clemens Fuest noted that "the sentiment among German businesses remains very strong." Regarding Euro's strength, Fuest noted that "most companies do not change prices immediately in their foreign markets when the exchange rate changes -- that means their margins will be smaller and I'm sure the export industry is concerned about that." And, "if the euro rises above something like $1.20, I think companies will be concerned about it. But it's just one factor." Also from Germany, Q2 GDP was finalized at 0.6% qoq, unrevised.
Japan CPI improved but still way below target
Japan national CPI core ticked up to 0.5% yoy in July, up fro 0.4% yoy and met expectation. Tokyo CPI core rose to 0.4% mom in August, up from 0.2% yoy and beat expectation of 0.3% yoy. Corporate service price slowed to 0.6% yoy in July, down from 0.7% yoy and missed expectation of 0.8% yoy. The inflation reading is still nowhere near to BoJ's 2% target even though growth outlook improved. And the central bank just slashed its annual inflation forecast last month. BoJ expects that inflation won't hit target before 2020.
USD/JPY Mid-Day Outlook
Daily Pivots: (S1) 109.05; (P) 109.33; (R1) 109.81; More...
USD/JPY recovers mildly today but it's staying well below 110.94 resistance. Intraday bias remains neutral with bearish outlook. Deeper decline is still expected. Break of 108.59 will target a test on 108.12 low. Whole corrective decline from 118.65 is possibly resuming and break of 108.12 will target 61.8% retracement of 98.97 to 118.65 at 106.48. Nonetheless, firm break of 110.94 will indicate short term bottoming and turn bias back to the upside.
In the bigger picture, the corrective structure of the fall from 118.65 suggests that rise from 98.97 is not completed yet. Break of 118.65 will target a test on 125.85 high. At this point, it's uncertain whether rise from 98.97 is resuming the long term up trend from 75.56, or it's a leg in the consolidation from 125.85. Hence, we'll be cautious on topping as it approaches 125.85. If fall from 118.65 extends lower, downside should be contained by 61.8% retracement of 98.97 to 118.65 at 106.48 and bring rebound.
Economic Indicators Update
| GMT | Ccy | Events | Actual | Forecast | Previous | Revised |
|---|---|---|---|---|---|---|
| 23:30 | JPY | National CPI Core Y/Y Jul | 0.50% | 0.50% | 0.40% | |
| 23:30 | JPY | Tokyo CPI Core Y/Y Aug | 0.40% | 0.30% | 0.20% | |
| 23:50 | JPY | Corporate Service Price Y/Y Jul | 0.60% | 0.80% | 0.80% | 0.70% |
| 06:00 | EUR | German GDP Q/Q Q2 F | 0.60% | 0.60% | 0.60% | |
| 08:00 | EUR | German IFO - Business Climate Aug | 115.9 | 115.5 | 116 | |
| 08:00 | EUR | German IFO - Expectations Aug | 107.9 | 106.8 | 107.3 | |
| 08:00 | EUR | German IFO - Current Assessment Aug | 124.6 | 125 | 125.4 | 125.5 |
| 12:30 | USD | Durable Goods Orders Jul P | -6.80% | -5.80% | 6.40% | |
| 12:30 | USD | Durables Ex Transportation Jul P | 0.50% | 0.40% | 0.10% | |
| Jackson Hole Symposium |
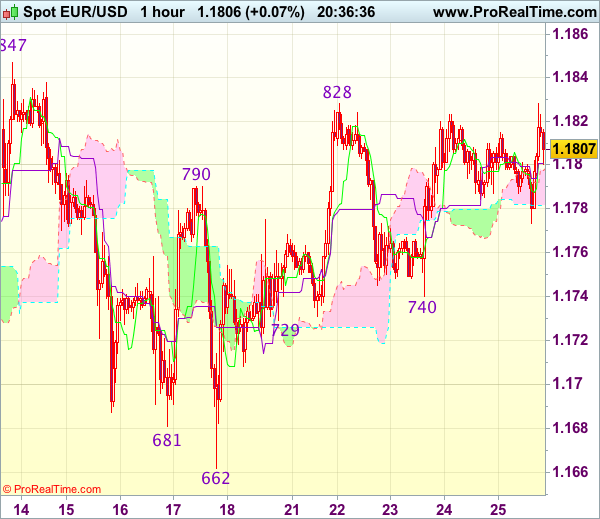
Trade Idea Update: EUR/USD – Hold long entered at 1.1765
EUR/USD - 1.1805
Original strategy :
Bought at 1.1765, Target: 1.1865, Stop: 1.1770
Position : - Long at 1.1765
Target : - 1.1865
Stop : - 1.1770
New strategy :
Hold long entered at 1.1765, Target: 1.1865, Stop: 1.1770
Position : - Long at 1.1765
Target : - 1.1865
Stop : - 1.1770
As the single currency has rebounded after holding above indicated support at 1.1770, retaining our bullishness and test of said resistance at 1.1828 would be seen, however, break there is needed to extend the rise from 1.1662 low to resistance at 1.1847, break there would provide confirmation that the pullback from 1.1910 has ended and encourage for headway to 1.1870-80 but reckon said resistance at 1.1910 would hold from here.
In view of this, we are holding on to our long position entered at 1.1765. Only below 1.1740 support would abort and suggest the rebound from 1.1662 has ended instead, risk weakness to 1.1695-00 first.
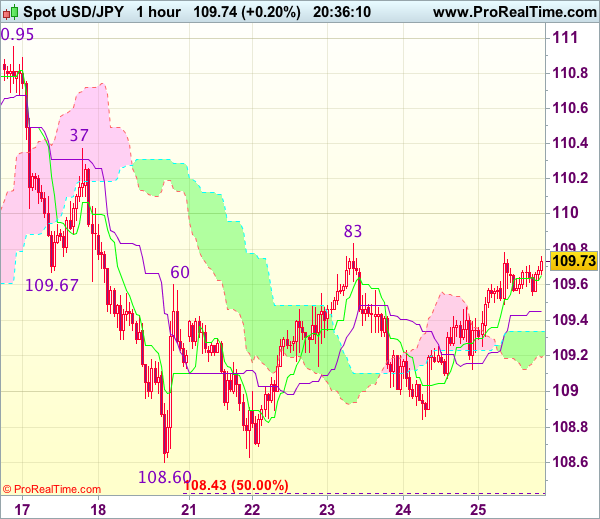
Trade Idea Update: USD/JPY – Buy at 109.25
USD/JPY - 109.72
Original strategy :
Exit long entered at 110.00
Position : - Long at 110.00
Target : -
Stop : -
New strategy :
Buy at 109.25, Target: 110.25, Stop: 108.90
Position : -
Target : -
Stop : -
As the greenback found renewed buying interest at 108.84 yesterday and staged another rebound, suggesting a test of resistance at 109.83 (this week’s high) would be seen, break there would signal low has been formed at 108.60 earlier, bring further gain to 110.00 and later towards previous resistance at 110.37 which is likely to hold on first testing due to near term overbought condition.
In view of this, we are looking to buy dollar on dips as 109.20-25 should limit downside. Only below said support at 108.84 would abort and bring retest of said support at 108.60, break there would revive bearishness and confirm recent decline has resumed for further weakness to 108.30 (1.618 times projection of 110.95-109.67 measuring from 110.37), then towards 108.00.
USD/JPY Downside Still An Option?
Price stays higher and tries to retest the resistance levels (support turned into resistance), a further drop is somehow expected, but only if the Nikkei stock index will slide further. This scenario is clouded as the JP225 is trading in the green and tries to climb much higher after the failure to close below the 19309 previous low.
I've said in the previous reports that the index shows some oversold signs, has lost the bearish momentum, so another leg higher will punish the Yen, which will depreciate versus all its rivals.
The Yen decreased on the mixed Japanese data, the National Core CPI rose by 0.5%, matching the 0.5% estimate, has beaten the 0.4% growth in the former reading period, while the Tokyo Core CPI surged by 0.4%, exceeding the 0.3% estimate and the 0.2% growth in the former reporting period. Moreover, the SPPI increased by 0.6%, but less versus the 0.8% estimate and compared to the 0.7% in the former reading period.
Price is retesting the warning line (wl1) and the minor red uptrend line, the perspective remains bearish as long as the rate stays under these levels. However a breakout above the mentioned dynamic resistance levels, followed by a wl1 retest will signal an important upside movement in the upcoming weeks.
Is moving sideways and looks like that the behavior will change as the rate makes higher lows, I hope that we'll have a clear direction after the Jackson Hole Symposium.
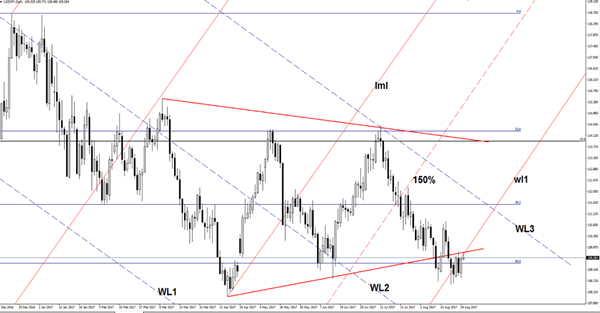
USD/CHF Upside Clouded
USD/CHF failed to close above the median line (ml) of the minor descending pitchfork and now goes down. Is almost to hit the second warning line (WL2) of the major ascending pitchfork, a valid breakdown will open the door for more declines in the upcoming period. I want to remind you that a valid breakout above the median line (ml) will most likely validate also the Inverse Head and Shoulders pattern.
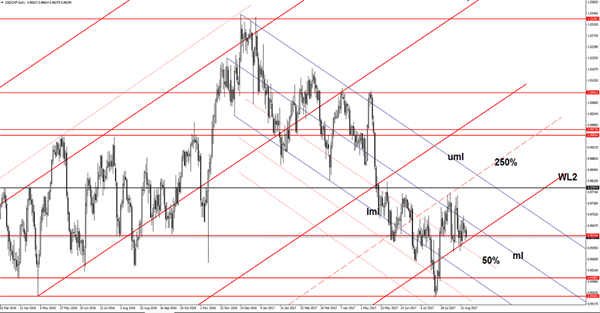
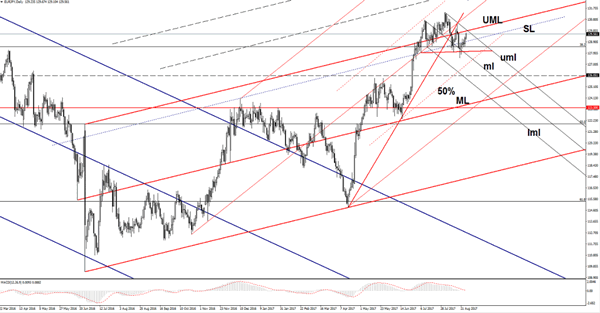
EUR/JPY Attracted By Confluence Area
Price edges higher again and is almost to hit the confluence area formed by the upper median line (UML) with the upper median line (uml) of the minor descending pitchfork. A valid breakout will accelerate the upside momentum and will invalidate the minor Head and Shoulders pattern. Only a rejection from here will keep the a bearish bias on the short term.
CRUDE OIL Rejection At Downwards Trendline
Crude oil is trading mixed. Hourly support is given at 46.46 (17/08/2017 high). Strong resistance can be found at 50.41 (31/07/2017). Expected to show continued short-term sideways move.
In the long-term, crude oil has recovered after its sharp decline last year. However, we consider that further weakness are very likely. Strong support lies at 35.24 (05/04/2016) while resistance can now be found at 55.24 (03/01/2017 high).
