

Sample Category Title
EUR/USD Mid-Day Outlook
Daily Pivots: (S1) 1.1753; (P) 1.1796 (R1) 1.1822; More...
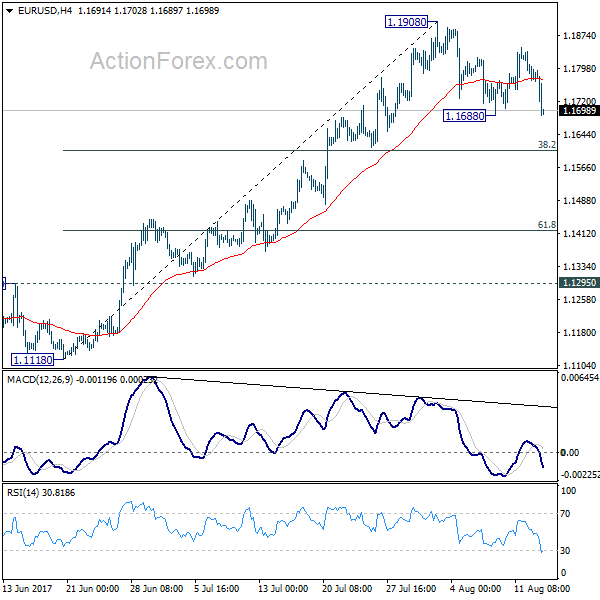
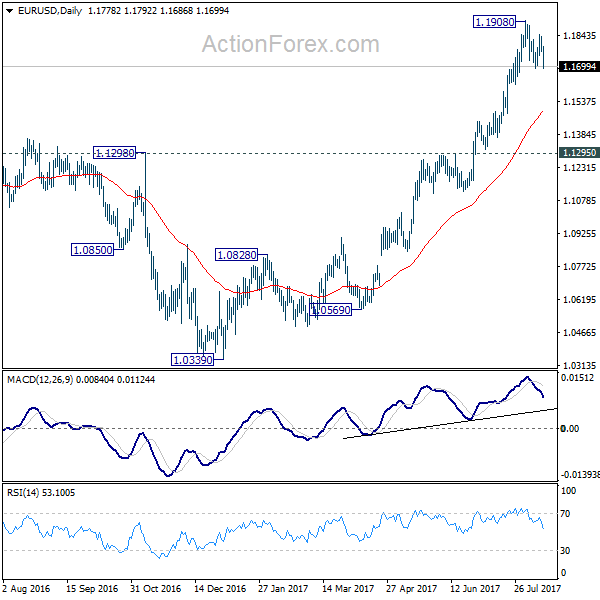
EUR/USD drops sharply in early US session but after all it's staying in consolidation from 1.1908. Break of 1.1688 will bring deeper pull back. But downside should be contained by 38.2% retracement of 1.1119 to 1.1908 at 1.1606 to bring rebound. On the upside, break of 1.1908 will extend recent up trend to 1.2042 long term support turned resistance next.
In the bigger picture, an important bottom was formed at 1.0339 on bullish convergence condition in weekly MACD. Sustained trading above 55 month EMA (now at 1.1768) will pave the way to key fibonacci level at 38.2% retracement of 1.6039 (2008 high) to 1.0339 (2017 low) at 1.2516. While rise from 1.0339 is strong, there is no confirmation that it's developing into a long term up trend yet. Hence, we'll be cautious on strong resistance from 1.2516 to limit upside. But for now, medium term outlook will remain bullish as long as 1.1295 support holds, in case of pull back.
USD/CHF Mid-Day Outlook
Daily Pivots: (S1) 0.9642; (P) 0.9687; (R1) 0.9765; More...
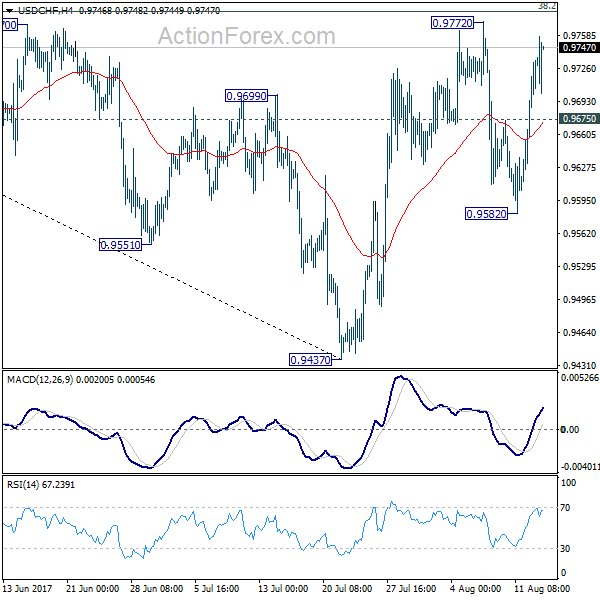
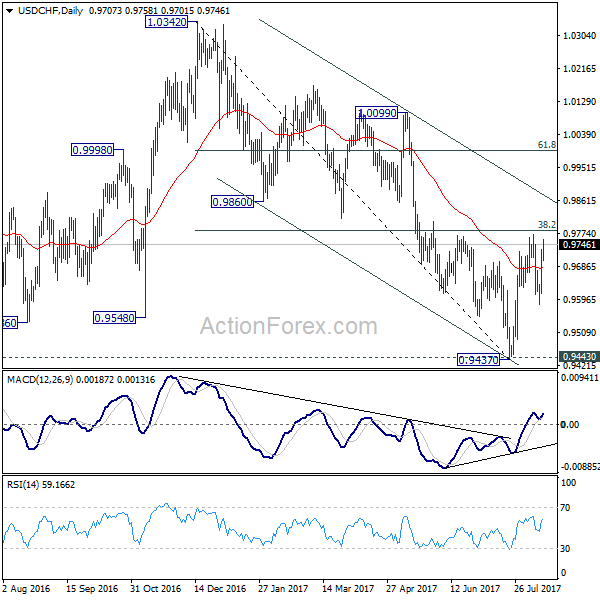
USD/CHF's rise from 0.9582 is still in progress and intraday bias remains on the upside for 0.9772 resistance. Decisive break there will revive the bullish case of reversal. That is, whole decline from 1.0342 has completed at 0.9437 after defending 0.9443 support. USD/CHF should then target channel resistance (now at 0.9880) next. On the downside, below 0.9675 minor support will turn intraday bias neutral first. Also, the pair is bounded inside medium term falling channel and limited below 38.2% retracement of 1.0342 to 0.9437 at 0.9783 for the moment. Break of 0.9582 will dampen our bullish view and turn bias back to the downside for 0.9437. This could also extend the fall from 1.0342 through 0.9437/43 key support level.
In the bigger picture, current development argues that USD/CHF has successfully defended 0.9443 key support level. And long term range trading in 0.9443/1.0342 is extending with another rise. At this point, there is no sign of an up trend yet. Hence, while further rise is expected in USD/CHF, we'll start to be cautious on loss of momentum above 61.8% retracement of 1.0342 to 0.9437 at 0.9996. However, firm break of 0.9443 will carry larger bearish implication and would target next key support at 0.9072.
USD/JPY Mid-Day Outlook
Daily Pivots: (S1) 109.18; (P) 109.48; (R1) 109.95; More...
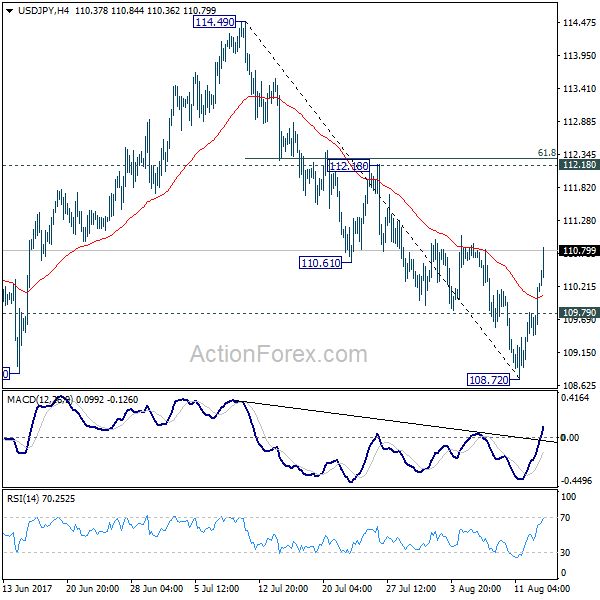
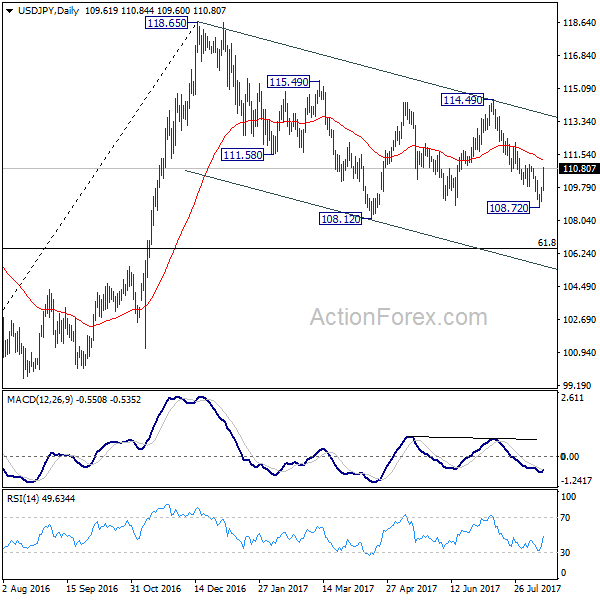
USD/JPY's rebound from 108.72 extends to as high as 110.78 so far. The break of 110.61 support turned resistance argues that decline form 114.49 is already completed at 108.72. Intraday bias is turned back to the upside for 112.18 resistance first. Break there will target 114.49 key near term resistance again. On the downside, break of 108.79 minor support will turn focus back to 108.72 instead.
In the bigger picture, the corrective structure of the fall from 118.65 suggests that rise from 98.97 is not completed yet. Break of 118.65 will target a test on 125.85 high. At this point, it's uncertain whether rise from 98.97 is resuming the long term up trend from 75.56, or it's a leg in the consolidation from 125.85. Hence, we'll be cautious on topping as it approaches 125.85. If fall from 118.65 extends lower, downside should be contained by 61.8% retracement of 98.97 to 118.65 at 106.48 and bring rebound.
GBP/USD Mid-Day Outlook
Daily Pivots: (S1) 1.2939; (P) 1.2980; (R1) 1.3004; More...
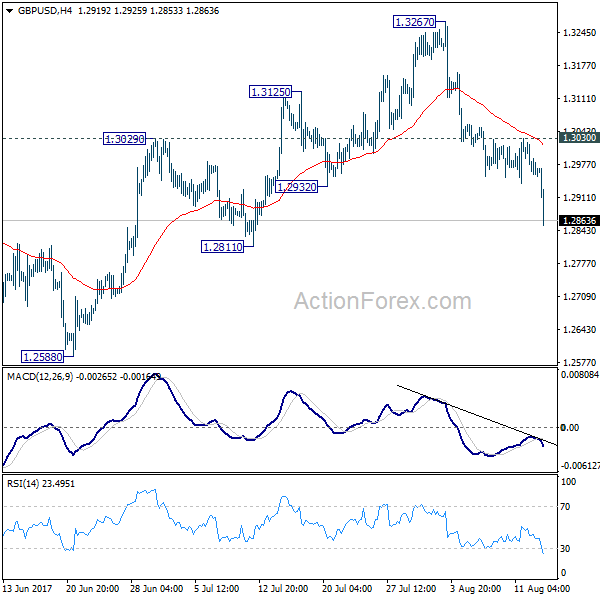
GBP/USD's fall from 1.3267 resumed by breaking 1.2932 support and reaches as low as 1.2853 so far. The development affirm our bearish view that correction from 1.1946 is completed at 1.3267. Intraday bias is back on the downside for 1.2588 key near term support for confirming our view. On the upside, break of 1.3030 resistance is needed to indicate short term bottoming. Otherwise, outlook will stay cautiously bearish in case of recovery.
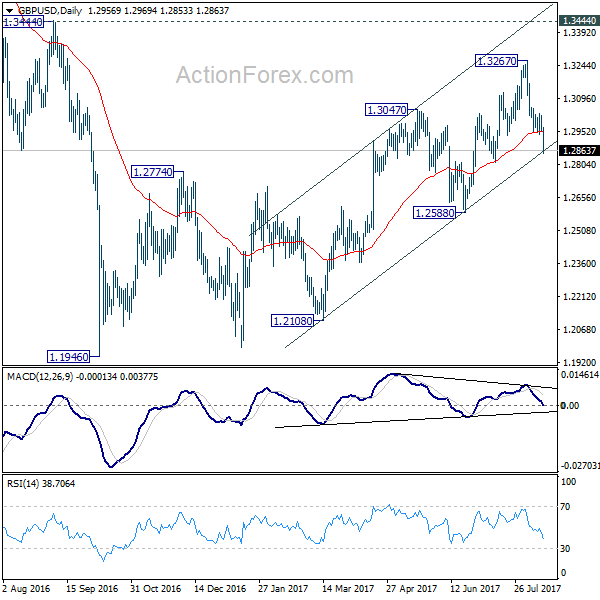
In the bigger picture, overall, price actions from 1.1946 medium term low are seen as a corrective pattern. While further rise cannot be ruled out, larger outlook remains bearish as long as 1.3444 key resistance holds. Down trend from 1.7190 (2014 high) is expected to resume later after the correction completes. And break of 1.2588 will indicate that such down trend is resuming.
Dollar Surges Further after Strong Retail Sales, UK Tumbles Again on CPI Miss
Dollar is extending this week's rebound in early US session after a string of solid economic data. Meanwhile, Sterling is trading as one of the weakest after another CPI miss. From US, headline retail sales rose 0.6% in July versus expectation of 0.4%. Ex-auto sales rose 0.5% versus expectation of 0.3%. Empire state manufacturing jumped to 25.2 in August and beat expectation of 10.3%. Import price index rose 0.1% mom in July. Technically, GBP/USD's break of 1.2932 is seen as a key near term bearish signal and the pair is now heading back to 1.2588 support. USD/JPY's break of 110.62 resistance also is also taken as a sign of near term reversal. But for the moment, EUR/USD is holding well above 1.1606 and maintains bullish outlook.
Rebound of the greenback started earlier this week as threat of imminent war between US and North Korea abated. New York Fed President William Dudley's comments yesterday gave Dollar another boost. Dudley, an influential member of FOMC, affirmed that he remained in "favor of doing another rate hike later this year". He prefers a rate hike despite soft inflation as "1) monetary policy is still accommodative, so the level of short-term rates is pretty low, and 2) and this is probably even more important, financial conditions have been easing rather than tightening". He indicated that "financial conditions are easier today than they were a year ago". Dudley added that it is not unreasonable to announce the balance sheet reduction plan in September. He forecast the portfolio would shrink to between USD 2.5-3.5T after five years.
Sterling dives on another CPI miss
Sterling tumbles broadly today, except versus Yen, as UK CPI missed expectations again. Headline CPI dropped -0.1% mom in July versus expectation of 0.0% mom. Annual rate of CPI was unchanged at 2.6% yoy, below expectation of 2.7% yoy. Core CPI was also unchanged at 2.4% yoy, below expectation of 2.5% yoy. RPI, on the other hand, rose to 3.6% yoy, up from 3.5% yoy and beat expectation of 3.5% yoy. Another downside surprise in CPI further reduced the chance of an early rate hike by BoE. And there are talks that UK CPI won't even hit 3% level later in the year as BoE projected. Also from UK, PPI input slowed to 6.5% yoy, PPI output slowed to 3.2% yoy while PPI output core slowed to 2.4% yoy. House price index rose 4.9% yoy in June.
German GDP solid but missed expectation
German GDP rose 0.6% qoq in Q2, below expectation of 0.7% qoq. Year on year growth was pushed up to 2.1%, highest in three years. While Euro dips mildly after the release, it's staying bullish against other currencies in general. Also from Germany, the constitutional court requested European court to make a ruling on ECB's EUR 2.3T monetary financing. The German constitutional court said that "significant reasons indicate that the ECB decisions governing the asset purchase programme violate the prohibition of monetary financing and exceed the monetary policy mandate of the European Central Bank, thus encroaching upon the competences of the Member States."
Staying in Germany, Finance Minister Wolfgang Schaeuble said the he hoped ECB's ultra-loose monetary policy would end in the foreseeable future. He noted that "no one seriously disputes that interest rates are rather too low for the strength of the German economy and the exchange rate of the euro, which is rising now." And in his view, most people expect ECB to take a further step at the upcoming meeting in September.
RBA minutes paint positive outlook
RBA's minutes for the August meeting revealed that policymakers were optimistic over the global and domestic economies. The central bank forecast that the economy would soon be growing at an annual rate of 3%, assuming that there's no major change in the Australian dollar. The central bank added that 'This assumption was one source of uncertainty'. Policymakers went to warn of the Aussie's strength, suggesting that 'a further appreciation of the Australian dollar would be expected to result in a slower pick-up in inflation and economic activity than currently forecast'. Meanwhile, RBA also signaled concerns over the housing market and household debt, while appeared more comfortable over the employment situation. More in RBA's Main Concerns Shifted to Housing Market From Employment
GBP/USD Mid-Day Outlook
Daily Pivots: (S1) 1.2939; (P) 1.2980; (R1) 1.3004; More...
GBP/USD's fall from 1.3267 resumed by breaking 1.2932 support and reaches as low as 1.2853 so far. The development affirm our bearish view that correction from 1.1946 is completed at 1.3267. Intraday bias is back on the downside for 1.2588 key near term support for confirming our view. On the upside, break of 1.3030 resistance is needed to indicate short term bottoming. Otherwise, outlook will stay cautiously bearish in case of recovery.
In the bigger picture, overall, price actions from 1.1946 medium term low are seen as a corrective pattern. While further rise cannot be ruled out, larger outlook remains bearish as long as 1.3444 key resistance holds. Down trend from 1.7190 (2014 high) is expected to resume later after the correction completes. And break of 1.2588 will indicate that such down trend is resuming.
Economic Indicators Update
| GMT | Ccy | Events | Actual | Forecast | Previous | Revised |
|---|---|---|---|---|---|---|
| 01:30 | AUD | RBA Minutes Aug | ||||
| 04:30 | JPY | Industrial Production M/M Jun F | 2.20% | 1.60% | 1.60% | |
| 06:00 | EUR | German GDP Q/Q Q2 P | 0.60% | 0.70% | 0.60% | 0.70% |
| 07:15 | CHF | Producer & Import Prices M/M Jul | 0.00% | 0.00% | -0.10% | |
| 07:15 | CHF | Producer & Import Prices Y/Y Jul | -0.10% | 0.00% | -0.10% | |
| 08:30 | GBP | CPI M/M Jul | -0.10% | 0.00% | 0.00% | |
| 08:30 | GBP | CPI Y/Y Jul | 2.60% | 2.70% | 2.60% | |
| 08:30 | GBP | Core CPI Y/Y Jul | 2.40% | 2.50% | 2.40% | |
| 08:30 | GBP | RPI M/M Jul | 0.20% | 0.10% | 0.20% | |
| 08:30 | GBP | RPI Y/Y Jul | 3.60% | 3.50% | 3.50% | |
| 08:30 | GBP | PPI Input M/M Jul | 0.00% | 0.40% | -0.40% | -0.30% |
| 08:30 | GBP | PPI Input Y/Y Jul | 6.50% | 6.90% | 9.90% | 10.00% |
| 08:30 | GBP | PPI Output M/M Jul | 0.10% | 0.00% | 0.00% | |
| 08:30 | GBP | PPI Output Y/Y Jul | 3.20% | 3.10% | 3.30% | |
| 08:30 | GBP | PPI Output Core M/M Jul | 0.10% | 0.10% | 0.20% | |
| 08:30 | GBP | PPI Output Core Y/Y Jul | 2.40% | 2.50% | 2.90% | |
| 08:30 | GBP | House Price Index Y/Y Jun | 4.90% | 4.30% | 4.70% | 5.00% |
| 12:30 | USD | Import Price Index M/M Jul | 0.10% | 0.10% | -0.20% | |
| 12:30 | USD | Empire State Manufacturing Index Aug | 25.2 | 10.3 | 9.8 | |
| 12:30 | USD | Advance Retail Sales Jul | 0.60% | 0.40% | -0.20% | |
| 12:30 | USD | Retail Sales Less Autos Jul | 0.50% | 0.30% | -0.20% | |
| 14:00 | USD | NAHB Housing Market Index Aug | 64 | 64 | ||
| 14:00 | USD | Business Inventories Jun | 0.40% | 0.30% | ||
| 20:00 | USD | Net Long-term TIC Flows Jun | 91.9B |
EUR/USD Looks Exhausted
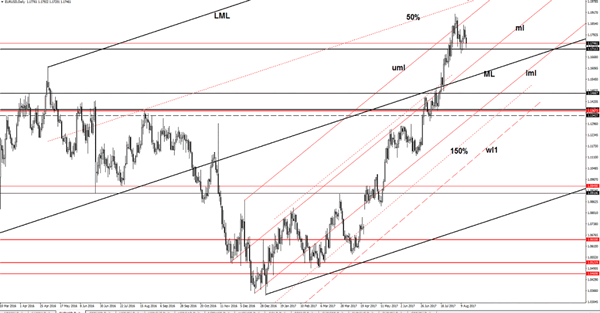
The EUR/USD is trading in the red and extends the yesterday's sell-off as the USDX looks determined to take out the 93.81 static resistance. The pair drops after the failure to retest a dynamic resistance, but we need a confirmation that will start another leg lower. The current drop could be only temporary if the US data will disappoint later.
Is trading above a critical support, only a valid breakdown will confirm a further drop in the upcoming period. Right now it is consolidating and waits for the US data to come out. You should be careful in the afternoon because we may have a high volatility.
The United States Retail Sales could increase by 0.3% in the previous month, the indicator could jump in the positive territory after 3-months, while the Core Retail Sales may increase by 0.3% in July versus the 0.2% drop in June.
The Import Prices could increase by 0.1% in June versus the 0.2% drop in the former reading period, while the Empire State Manufacturing Index could jump from 9.8 to 10.1 points.
Price is going down after failure to retest the upper median line (uml) of the minor ascending pitchfork, signaling that the bears are in control. Was almost to reach and retest the 1.1712 major support (resistance turned into support). Technically is expected now to approach and reach the median line (ml) of the minor ascending pitchfork. We have a major downside obstacle also at the median line (ML) of the major ascending pitchfork, the perspective is still bullish as long as the mentioned support levels are intact.
NZD/USD Breakdown Needs Confirmation
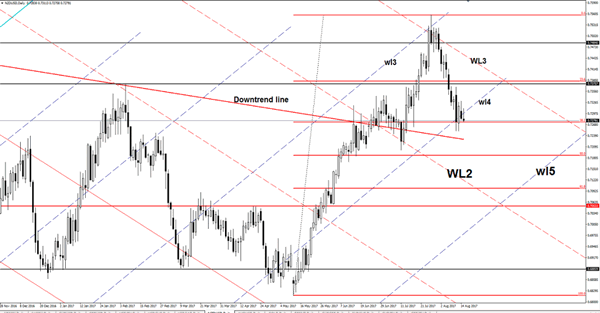
Price managed to drop below the fourth warning line (wl4) again and now is challenging the 38.2% retracement level, a valid drop below this obstacle if all what we need to know for sure that will drop further. Technically should drop further, having the next major target at the fifth warning line (wl5), will approach this level if will ignore the support from 50% and 61.8% retracement levels. Could be attracted by the confluence formed by the wl5 with the WL2.
EUR/GBP Breakout In Play
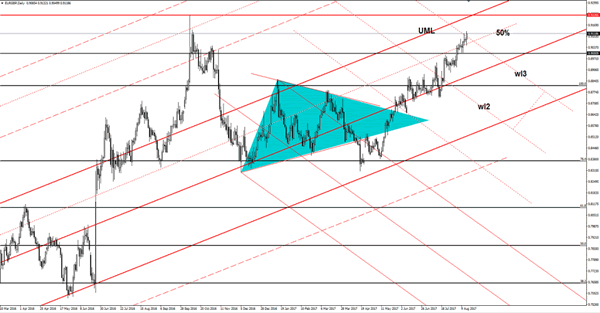
EUR/GBP is strongly bullish and has managed to jump above the third warning line (wl3). A valid breakout will attract more buyers, which will drive the rate towards the upper median line (UML) and towards the 0.9226 horizontal resistance. I've said in the previous analysis that price should take out the dynamic resistance because is attracted by the confluence area formed between the 0.9226 with the UML.
EURUSD – Follows Through Lower, Vulnerable
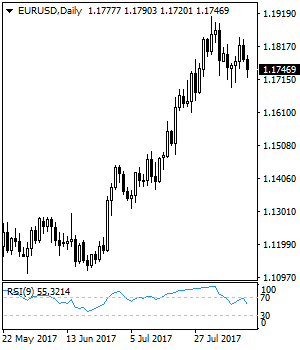
EURUSD - The pair followed through lower on Tuesday leaving risk of more weakness on the cards. Resistance comes in at 1.1800 level with a cut through here opening the door for more upside towards the 1.1850 level. Further up, resistance lies at the 1.1900 level where a break will expose the 1.1950 level. Conversely, support lies at the 1.1700 level where a violation will aim at the 1.1650 level. A break of here will aim at the 1.1600 level. All in all, EURUSD faces further downside pressure.
DAX Continues To Climb As North Korea Fears Abate
The DAX index has posted gains in the Tuesday session, continuing the upward movement seen on Monday. The DAX is trading at 12,200.80, up 0.29% on the day. On the release front, there is only one euro zone indicator on the schedule. German Preliminary GDP in the second quarter edged lower to 0.6%, missing the forecast of 0.7%. On Wednesday, the euro zone releases Flash GDP.
Tensions in the Korean peninsula last week weighed on global stock markets, and the DAX declined 2.4%. Washington and Pyongyang exchanged sharp warnings, with North Korea threatening to attack Guam, which hosts a major US military base. Tensions between North Korea and the US remain high, but the prevalent sentiment in the markets is that a diplomatic solution will be found to end the crisis. The stock markets are excellent barometers of geopolitical tensions, and the gains we are seeing this week are a direct result of the lowering of tensions. Still, Donald Trump and Kim Jon-un are unpredictable leaders, and a move by either side could easily ratchet up hostilities and send stock markets lower.
The robust German economy continues to perform well in 2017, as German GDP expanded 0.6% in the second quarter. Consumer spending, a key driver of economic growth, continues to propel economic growth, and Germany has now posted 12 straight quarters of growth. Higher wages and increased government spending has also boosted the economy. The export sector remains strong, despite the stronger euro, as global demand for German products, especially cars, remains firm. Positive economic conditions in Germany have translated into a stronger euro zone economy, which has experienced higher growth and lower unemployment.
The ECB has long insisted that it would not begin to wind up its quantitative easing (QE) before inflation moves higher, but at the July meeting, the bank appeared to change directions. In July, the ECB said it would hold discussions on the q scheme in “the autumn”, and analysts are split as to whether that means September or October. Either way, this means that the markets expect to hear an announcement regarding QE, and such a statement could have a significant impact on the euro. The ECB tapered QE earlier in 2017, from EUR 80 billion to 60 billion/mth, and there are calls to reduce this to 40 EUR billion/mth. The ECB is scheduled to terminate the asset purchases program in December, and could start tapering in early 2018. The bloc’s economy is forecast to expand a healthy 2.0% this year, and the eurozone outperformed both the US and the UK in the first half of 2017. The sore point remains inflation, which is stuck at low levels, despite the ECB’s ultra-accommodative monetary policy. Another factor which policymakers must deal with is the ECB’s bloated balance sheet, which stands at more than EUR 2 trillion.