Sample Category Title
Euro Lower As German Preliminary GDP Misses Estimate
EUR/USD has edged lower on in the Tuesday session. Currently, the pair is trading at 1.1756, down 0.31% on the day. On the release front, there is just one euro zone indicator. German Preliminary GDP in the second quarter edged lower to 0.6%, missing the forecast of 0.7%. In the US, the key releases are Core Retail Sales and Retail Sales, which are expected to come in at 0.3% and 0.4% respectively. US Empire State Manufacturing Index is expected to improve to 10.1 points. On Wednesday, the euro zone releases Flash GDP. In the US, we'll get a look at Building Permits and Housing Starts. As well, the FOMC releases its minutes from the July FOMC meeting.
It's been a quiet August for the euro, but the currency has pushed upwards in recent months, with EUR/USD jumping 3.5% in July. The euro has received a boost from a stronger euro zone economy, as well as growing political risk, with the Trump administration failing to pass a new healthcare bill through Congress. The latest fiasco for Trump is the alt-right protest in Charlottesville, where one protester was killed by a suspected white supremacist. Trump initially refused to condemn white supremacists for the violence, and faced a strong backlash of criticism from both Democrat and Republican lawmakers. Trump finally came out with a statement on Monday which condemned hate groups, including white supremacists. Meanwhile, far away in the Korean peninsula, tensions between North Korea and the US have abated, after some serious saber-rattling which pushed global stock markets lower last week. European markets have started the week with gains, as the markets are hopeful that a diplomatic solution to the crisis will be found.
Germany's economy has looked strong in 2017, and GDP expanded 0.6% in the second quarter. Consumer spending, a key driver of economic growth, continues to propel economic growth, and Germany has now posted 12 straight quarters of growth. Higher wages and increased government spending has also boosted the economy. The export sector remains strong, despite the stronger euro, as global demand for German products, especially cars, remains firm. Positive economic conditions in Germany have translated into a stronger euro zone economy, which has experienced higher growth and lower unemployment.
Risk Appetite Gradually Returning But Caution Remains
- Gold lower as traders gradually increase risk exposure;
- GBP tumbles as inflation falls short of expectations;
- EUR recovers after German GDP miss;
- US retail sales and manufacturing data eyed.
The risk rebound continues in financial markets on Tuesday, as tensions between the US and North Korea appear to ease and investors gradually unwind their safe haven trades from last week.
Gold – the ultimate traditional safe haven – is on course for a second day of losses and is currently trading around $1,273, finding some support around the level it ran into difficulty around a couple of weeks ago. A break below here could see $1,260 come into play and even $1,250, where it also found support this time last week. Assuming we don't see another flare up in the war of words between the two countries – or worse – then Gold could remain under pressure in the days ahead, although traders are understandably cautious still.
The British pound fell to a one month low against the dollar on Tuesday after CPI data for July showed inflation remained unchanged from a month earlier, despite expectations for a small increase. The data reduces the need for the Bank of England to tighten monetary policy in response to above target inflation, which peaked a couple of months ago just below 3%. With price pressures appearing to have cooled and the economy still facing a couple of years of uncertainty and slower growth, markets appear to once again be pricing out a rate hike this year and possibly next.
The euro has recovered to trade only slightly lower against the dollar on the day, having coming under some selling pressure earlier in the session in response to weaker than expected German GDP data. While the number fell short of expectations, it still represents a strong quarter of growth in the euro areas largest economy and came with an upward revision to the previous quarter.
The timing is also very good, with Angela Merkel out on the campaign trail ahead of the September election. While consumer spending was a big driver of growth in the second quarter, ramped up government spending also contributed to the stronger output which the sceptics among us may think is no coincidence given the proximity to the election. That said, strong growth has been a consistent feature in Germany for some years now and unemployment is very low which should continue to support the economy and help Merkel's case next month, not that she needs it if recent poll numbers are to be believed.
We still have more data to come today from the US, with the most notable being retail sales for July. Consumer spending is a critical component of the US economy and something that has remained adequate yet unremarkable for some time. We've actually seen a gradual slump in spending over the course of the year, something I'm sure the Fed would like to see a reversal of in the second half. The New York empire state manufacturing index will also be released today, among some other tier 2 data.
Dollar Rallies As North Korea Blinks
Tuesday August 15: Five things the markets are talking about
Global equities trade better bid while the 'mighty' U.S dollar finds much needed support ahead of the U.S open after North Korea's Kim Jong Un signalled that he would delay plans to fire a missile near Guam, easing tensions and prompting investors to move back into beaten-down riskier assets.
Aiding higher rates stateside, and the dollar, was New York Fed President Dudley comments Monday indicating that it was 'not unreasonable' to think the Fed would begin trimming its +$4.2T balance sheet next month and raise rates again this year.
This gave investors the green light to begin unwinding a portion of their 'bearish' bets made last week after Friday's disappointing U.S inflation data dampened market expectations that the Fed would raise interest rates again in 2017.
U.S data this morning will give some indication on how the U.S economy is doing in H2. July retail sales are expected to rise month-over-month (08:30 am EDT), while housing starts and industrial production (10:00 am EDT) is expected to be subdued.
Note: North Korea is celebrating its Liberation Day today to mark the end of Japanese rule.
1. Stocks reclaim lost territory
Global equity markets have happily retraced most of last Friday's pullback, as robust Asian corporate earnings and reduced fears of imminent military conflict between the U.S and North Korea supports buying interest.
In Japan, stocks have rebounded overnight, snapping a four-day losing streak and have moved away from their three-month low print hit on Monday. The Nikkei share average rallied +1.1%, after falling -1.0% in the previous session. The broader Topix index finished the day +1.1% higher.
Down-under, Australia's S&P/ASX 200 Index gained +0.5% at the close, while Hong Kong's Hang Seng index added +0.3% as the Shanghai Composite Index rose +0.4%.
Note: Markets in South Korea and India are closed Tuesday for holidays.
In China, stocks ended the day higher, but weak sentiment limited those gains. The blue-chip CSI300 index rose +0.3%, while the Shanghai Composite Index gained +0.4%.
In Europe, stocks opened higher and maintain a positive position on easing of geopolitical tensions around Korea. Macro data out of Germany (see below) is also helping support equities.
U.S stocks are set to open in the black (+0.2%).
Indices: Stoxx50 +0.1% at 3,460, FTSE +0.3% at 7,379, DAX +0.2% at 12,189, CAC-40 +0.3% at 5,139, IBEX-35 flat at 10,461, FTSE MIB +1.7% at 21,722, SMI -0.3% at 9,004, S&P 500 Futures +0.1%
2. Oil prices steady after dollar surge, gold lower
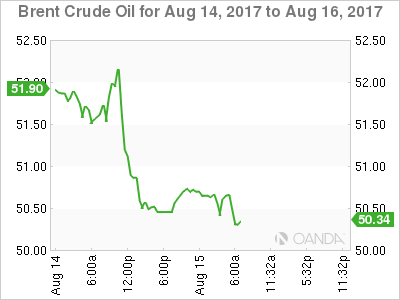
Crude oil prices have stabilized ahead of the U.S open after yesterday's heavy sell-off following a rally in the dollar. Signs of weaker demand in in China have also been pressuring the black stuff this week.
Benchmark Brent crude is little changed at +$50.73 a barrel, while U.S light crude (WTI) is -5c lower at +$47.54.
Data this week showed that Chinese oil refineries operated in July at their slowest daily rates since September. The drop was steeper than expected, raising concerns over the state of Chinese demand (the worlds second largest consumer) and level of domestic stocks.
Note: Brent and U.S crude both reached two-month highs in last week, but have fallen gradually in the last few days, as investors have been happy to book some well-deserved profits.
Investor focus remains on OPEC, U.S inventories (today's API and Wednesday's EIA report) and disappointing China demand, to shape the futures oil curve.
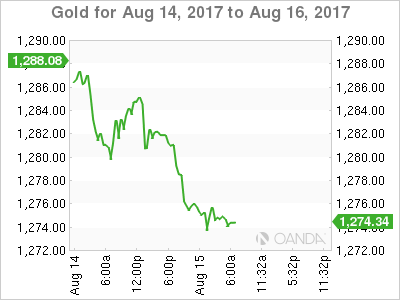
Gold prices are under pressure (down -0.6% at +$1,274.31 per ounce) on rising risk appetite as North Korea tensions eases. The 'yellow' metal continues to trade atop of its two-month highs touched last week as the market keeps an eye on developments in the peninsula.
3. Global yields back up
U.S Treasury prices have started this week's second session on the back foot as investors feel a tad better about the geopolitical situation and are willing to put their money to work in riskier assets.
U.S 10-year yields have backed up +2 bps to +2.24%. The move remains modest as global yields are expected to face strong headwinds if they're going to climb much higher.
Note: After another soft U.S inflation report last Friday, the market continues to remain highly skeptical that the Fed will raise rates again this year, and this despite NY Fed Dudley's 'hawkish' comments yesterday. Fed funds odds see a +42% chance of a rate hike at the Fed's December meeting, up from +36% late Friday.
In Europe, the eurozone's benchmark German 10-year bond yield is trading up +2 bps to +0.42%, adding to Monday's +3 bps rise and moving further off Friday's six-week low of +0.38%. U.K Gilts have backed up +3 bps to +1.101%.
4. U.S dollar up ahead of July retail sales
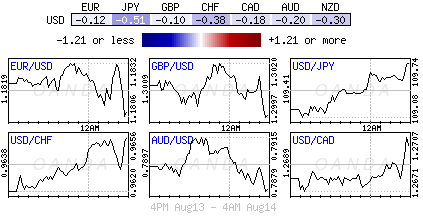
The U.S dollar is better bid ahead of this morning's July retail sales data release (08:30 am EDT). The EUR/USD is down -0.2% at €1.1757. The market consensus is for a rise of +0.4% compared with a fall in June, but with last weeks softer inflation numbers it would not be too much of a surprise to see the headline print come in below expectation. If it does, it could send USD/JPY to fresh intraday lows. USD/JPY is up +0.7% at ¥110.39.
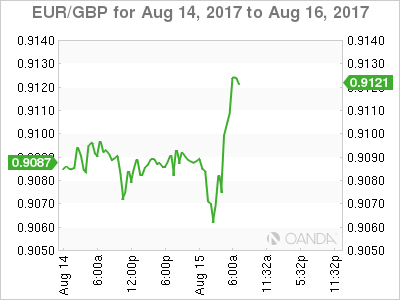
In the U.K, July CPI missed expectations (see below), a second consecutive month, and has dented any 'hawks' bid for potential near-term hike by the Bank of England (BoE). Sterling is down -0.6% at £1.2890.
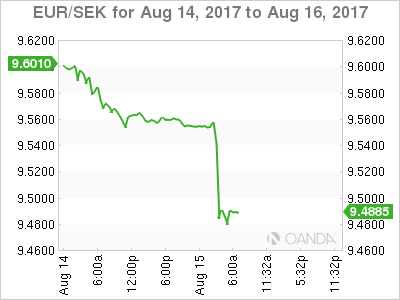
Elsewhere, the SEK has strengthened significantly outright (-0.46% to $8.0690) this morning after Sweden's higher-than-expected inflation figures. July CPI inflation rose +2.2% on the year compared to the Riksbank's +1.6% forecast, while CPIF inflation (calculated with a fixed interest rate) rose by +2.4%, against the Riksbank forecast of +1.8%. EUR/SEK has fallen -0.7% to €9.4874.
Down-under, there were brief gains for the AUD (A$0.7842) overnight following the release of this month's RBA minutes. The minutes judged 'steady' policy consistent with growth and inflation targets. The RBA expects growth is likely to pick up pace in Q2 and sees GDP around +3% for both 2018 and 2019. Policy makers are also confident in a pick-up in inflation and jobs.
5. Germany continues strong performance, U.K inflation steady
Data this morning showed that the German economy continues its strong performance with another 'above-trend growth rate' in Q2.
Germany's statistics body revealed that the German economy grew at a quarterly clip of +0.6% in Q2 and also lifted its Q1 growth estimate to +0.7% from a previous estimate of +0.6%.
In the U.K, annual inflation held steady in July as falling oil prices offset higher prices for clothing and food. Consumer prices rose +2.6% on the year, a smaller rise than the +2.7% increase the market had expected.
Separately, the annual increase in companies' raw material costs slowed in July to +6.5% from +10% in June, the biggest month-to-month slowdown in five years, as the effect of last summer's depreciation of the pound continues to fade.
UK Inflation Data Miss Consensus Forecast
Inflation still overshoots the BOE target
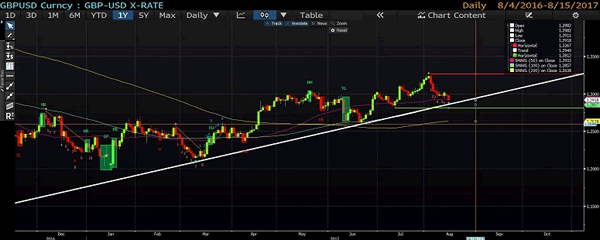
The downtrend continues as the price breaks the 50 DMA
Fundamental Analysis
The immediate reaction of the economic data on the Sterling dollar pair was negative and investors pushed the pair lower. It appears that the inflation data is losing steam. The UK home grown prices are still somewhat muted and it is something which the MPC is comfortable about. The inflation data overshooting the bank's target is blamed on the sterling weakness. Going forward, the growth picture still looks subdued and this does not appear to be changing in 2018 as well. More notably, one can not disregard the influence of higher energy prices from Big six energy suppliers making its way to the CPI basket.
Technical Analysis
The candle session shows that the downward trend has more room to go.
Price piercing the 50-DMA is a sign of weakness.
As long as the price is above the upward trend line and both: 100 and 200 DMA, the bulls still control the momentum.
The support is at 1.2812 which is the low of 12 July, however, the area where the price could bounce back up is 1.2877.
The resistance is at 1.3270
GBP/USD Elliott Wave Analysis
GBP/USD – 1.2883
As cable has slipped again after brief recovery and broke below indicated support at 1.2999 and 1.2933, adding credence to our view that top has been formed at 1.3269 earlier this month and few weeks of consolidation below this level would be seen with downside bias for at least a correction of recent upmove, hence further weakness to support at 1.2812 is likely, break there would encourage for decline to 1.2775-80 (38.2% Fibonacci retracement of 1.1986-1.3269), then towards 1.2700, however, near term oversold condition should limit downside to 1.2650-60 and reckon 1.2620-30 (50% Fibonacci retracement) would hold from here, price should stay well above previous chart support at 1.2589, bring rebound later.
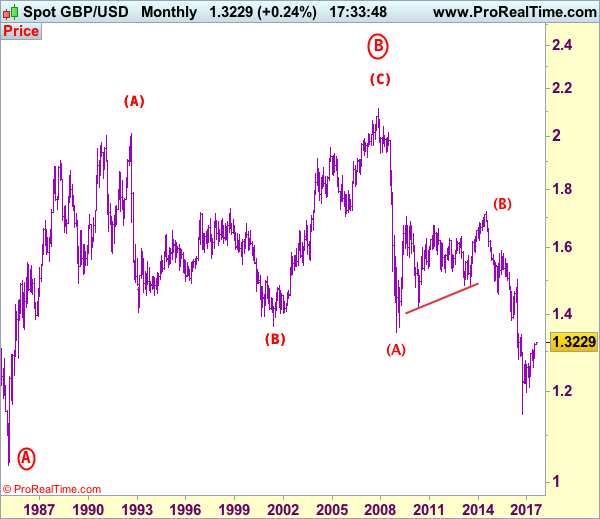
Our preferred count on the daily chart is that cable's rebound from 1.3500 (wave (A) trough) is unfolding as a wave (B) with A ended at 1.7043, followed by triangle wave B and wave C as well as wave (B) has possibly ended at 1.7192, below support at 1.4232 would add credence to this count, then further fall to 1.4000 level would follow but reckon downside would be limited to 1.3655 support and price should stay above previous support at 1.3500.
On the upside, expect recovery to be limited to 1.2950-60 and renewed selling interest should emerge below resistance at 1.3032, bring another decline. A daily close above 1.3055-60 would defer and risk a stronger rebound to 1.3100-10 but still reckon upside would be limited to 1.3165 and price should falter well below said resistance at 1.3269, bring another decline later.
Recommendation: Sell at 1.3030 for 1.2800 with stop above 1.3130.
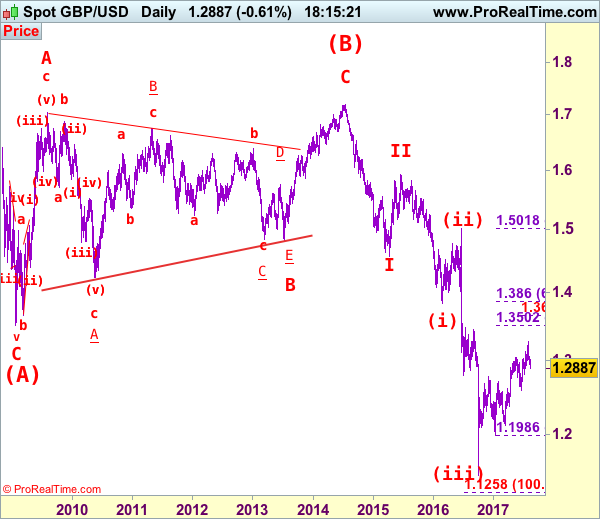
Longer term - Cable's rise from 1.0520 (Feb 1985) to 2.0100 (September 1992) is seen as [A], the decline to 1.3682 is labeled as (B) and (C) wave rally has ended at 2.1162 (9 Nov, 2007) which is also the top of larger degree wave B with circle. The selloff from there is a 5-waver with wave (A) ended at 1.3500 (23 Jan 2009), wave (B) itself is labeled as A: 1.6733, triangle wave B: 1.4813 and wave C as well as top of wave (B) ended at 1.7192 (2014), hence the selloff from there is an impulsive wave (C) with wave I : 1.4566, wave II 1.5930, an extended wave III is unfolding and already exceeded our downside target at 1.3500 and 1.3000, hence weakness to 1.2500 and possibly 1.2000 cannot be ruled out, however, price should stay well above psychological level at 1.0000.
Daily Technical Analysis: USD/CAD Flat Top Ascending Triangle Uptrend
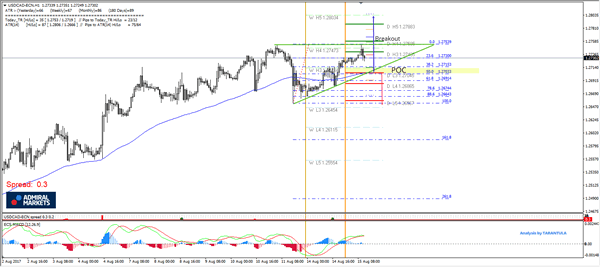
The USD/CAD has been in a steady uptrend. The price has formed an ascending flat top triangle that suggest an uptrend continuation. But the price has already reached the W H4 camarilla pivot so bulls need to be careful. If the pair breaks 1.2760 then 1.2805 will be possible. If there is no breakout to the upside then a retracement towards the POC 1.2700-15 (50.0, D L3, ascending triangle trend line, EMA89) will be possible. New buyers might appear within the POC zone and spike the price up towards the 1.2760 and above mentioned targets. However, bulls should pay attention to 1.2700 break to the downside. If that happens, the pair might experience a temporary weakness leading to 1.2656-45 zone.
GBP/JPY Elliott Wave Analysis
GBP/JPY – 146.05
Sterling’s anticipated selloff to 141.25 (last week’s low) adds credence to our view that temporary top has been formed at 147.75 last month and although price has rebounded this week, reckon upside would be limited to 144.40-50 and price should falter below resistance at 145.30, bring another decline later this month. Below said support at 141.25 would signal the fall from 147.75 top is still in progress for correction of early upmove to 140.50 then towards psychological support at 140.00, however, near term oversold condition should limit downside to 139.85 support and price should stay well above previous chart support at 138.70.
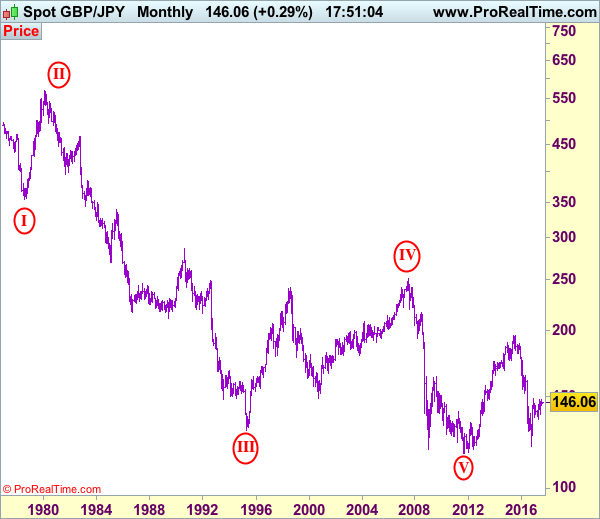
Our preferred count is that larger degree wave V with circle is unfolding from 251.12 with wave (I) 219.34, (II): 241.38 and wave (III) is subdivided into 1: 192.60, 2: 215.89 (23 Jul 2008) and wave 3 ended at 118.87 earlier in 2009. The correction from there to 162.60 is wave 4 which itself is a double three and is labeled as first a-b-c ended at 151.53, followed by wave x at 139.03, 2nd a ended at 162.60, 2nd b at 146.75 and 2nd c leg of wave 4 ended at 163.00. Therefore, the decline from 163.00 to 116.85 is now treated as wave 5 which also marked the end of larger degree wave (III), hence wave (IV) major correction has commenced for retracement of the wave (III) from 241.38 and upside target at 183.95-00 (50% Fibonacci retracement of the wave (II) from 241.38) had been met, a drop below 160.00 would suggest wave (IV) has ended at 195.85, bring decline in wave (V) for initial weakness to 130 (already met) and 120.
On the upside, although current rebound from 141.25 may bring initial recovery to 143.30-35 and possibly 144.00, reckon upside would be limited to 144.50-60 and bring another decline to aforesaid downside targets. Above 145.30 would dampen this bearish scenario and suggest first leg of decline from 147.75 has ended instead, bring a stronger rebound d to 145.90-0-0 but price should falter below resistance at 146.80, bring another decline later.
Recommendation: Short entered at 146.50 met target at 144.50 with 200 points profit and would sell again at 144.50 for 141.50 with stop above 145.50.

The long-term downtrend from 570.99 (29 Feb 1980) is labeled as an impulsive wave with III with circle ended at 129.77 (20 Apr 1995) and the corrective rebound to 251.12 (20 Jul 2007) is treated as wave IV with circle and the wave V with circle selloff from 251.12 has possibly ended at 116.80 (almost reached our indicated target at 116.00) and major correction has commenced from there and indicated upside target at 183.90-00 (50% Fibonacci retracement of 251.10-116.85) had been met, reckon upside would be limited to 199.80-90 (61.8% Fibonacci retracement) and bring wave (V) decline in later part of 2017.
CRUDE OIL Wide-Open For Further Weakness
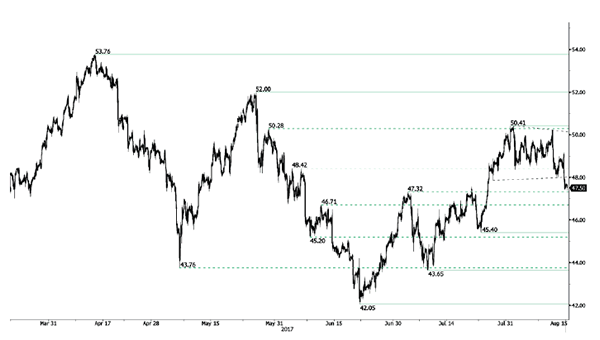
Crude oil is trading lower. Hourly support is given at a distance at 45.40 (24/07/2017 low). Strong resistance can be found at 50.41 (31/07/2017). Expected to show short-term weakness.
In the long-term, crude oil has recovered after its sharp decline last year. However, we consider that further weakness are very likely. Strong support lies at 35.24 (05/04/2016) while resistance can now be found at 55.24 (03/01/2017 high).
SILVER Short-Term Bearish Pressures
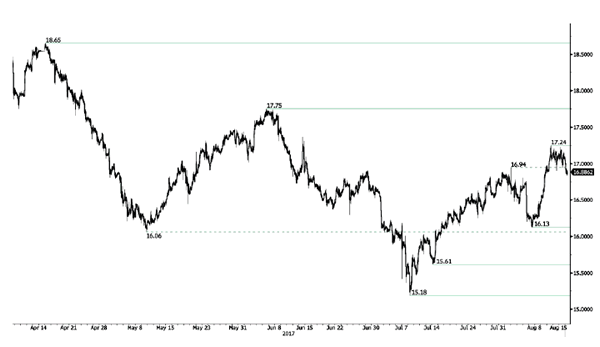
Silver's bullish pressures are on. Hourly resistance lies at 17.24 (10/08/2017 high) while support can be found at 16.13 (07/08/2017 high). Expected to show continued current bullish momentum.
In the long-term, the death cross indicates that further downsides are very likely. Resistance is located at 25.11 (28/08/2013 high). Strong support can be found at 11.75 (20/04/2009).
GOLD Bearish Consolidation
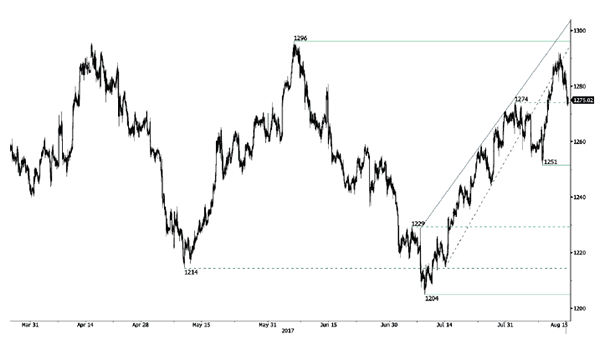
Gold is consolidating lower. Hourly support is given at 1251 (08/08/2017 low). Stronger support lies at 1204 (10/07/2017 high). The commodity is heading towards resistance given at 1296 (06/06/2017 high). Expected to show conitnued buying pressures.
In the long-term, the technical structure suggests that there is a growing upside momentum. A break of 1392 (17/03/2014) is necessary ton confirm it, A major support can be found at 1045 (05/02/2010 low)