Sample Category Title
US Futures Higher | RBA Minutes Dovish | Safe Havens Quelled
Risk off trade a major theme
Gold eased off but not no major sell off
Dollar Index moving higher on Dudley's comment
Oil price struggles due to lack of demand
The US futures show that markets would extend their gains and investors would also continue to reward the equity markets. The geopolitical fear has faded due to the violence in Charlottesville. The volatility index took a nosedive on the back of this and the relief rally prompted a slide in the index. It is safe to say that the safe haven demand is badly quelled.
Having said that, the latest comments by the US defence secretary has upped the ante somewhat by saying if North Korea fires a missile at the United States, it would mean a war. So the latest pull-back in the gold price doesn't mean that the bulls are out of energy. The US economic data is abate if not derailing and the wind of protectionism is still strong. North Korea is not going to change its stance towards the US and another missile test would be just around the corner. The planned joint military exercises between the US and South Korea towards the end of this month could spark some counter-reaction from North Korea. Therefore, the pull-back in the gold price could be an opportunity. The gold price is likely to test the level of $1300 and this could happen if the US retail sales number disappoints. But, as the wage growth has picked up in the US, it is likely that we may see an uptick in the US retail sales number.
The dollar index secured another day in the green territory despite the fact that the core inflation in the US remains far off from the Fed inflation target. Another rate hike for this year looks really dull. At the same time, the three months annualised core CPI is not miles away from the Fed's inflation target. Thus, ruling out an interest rate hike completely could be naive. Investors will be looking for a more encouraging reading for the US retail sales number. A small change in the consumer behaviour will be reflected in the retail sales number and that would provide support for the dollar bulls. However, shaving some profit off ahead of the US retail sales number would remain the famous trade.
The oil price continues to struggle and the Chinese industrial economic data further dampen the demand outlook for the commodity.
The Euro was burnt on the back of shrinking industrial Eurozone data. The currency is retracing from its highs against the dollar. For Sterling, it is the UK CPI number which is going to keep Mark Carney, the governor of the Bank of England, on his toes. The bank left the inflation target unchanged in its latest quarter inflation report despite the fact that the forecast for the wage growth was lowered. The manufacturing and services PMI have both moved lower in their latest reading, so the best outcome for the retail sales data may not be that rosy.
The Aussie is feeling the pain after the RBA released its minutes. Lowering the GDP forecast was the recent reaction by the bank and it also came out with some dovish comments by stating that higher currency would damage the GDP growth and unemployment. The bank shifted its focus on household debt as an excuse to justify their dovish tone.
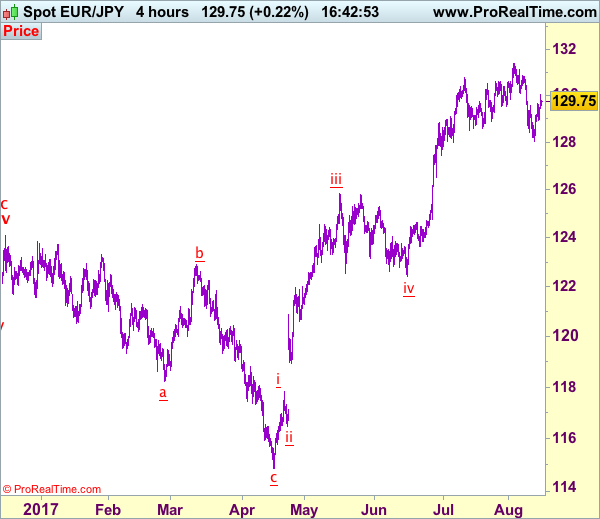
Trade Idea: EUR/JPY – Buy at 129.00
EUR/JPY - 129.78
Recent wave: A 5-waver is unfolding from 114.85 with wave iii and iv ended at 125.82 and 122.40 respectively, wave v has possibly ended at 131.40.
Trend: Near term up
New strategy :
Buy at 129.00, Target: 130.50, Stop: 128.40
Position: -
Target: -
Stop:-
As the single currency has surged again after staging a strong rebound from 128.05, adding credence to our view that at least the first leg of decline from 131.40 top has ended there and consolidation with mild upside bias is seen for further gain to 130.50, then towards 130.85-90, however, as broad outlook remains consolidative, upside would be limited and said resistance at 131.40 should remain intact, bring another retreat later this week.
In view of this, we are looking to turn long on dips as 128.90-00 should limit downside and bring another rebound. Below 128.50 would risk retest of Friday’s low at 128.05 but break there is needed to revive bearishness and signal the decline from 131.40 top is under way for retracement of early upmove to 127.50-60, then towards 127.00-10.
Our latest preferred count is that wave (ii) is ABC-X-ABC which ended at 123.33 and wave (iii) is unfolding with wave iii ended at 100.77, followed by wave iv at 111.57 and wave v as well as the wave (iii) has ended at 97.04, followed by wave (iv) at 111.43 and wave (v) has ended at 94.12 which is also the end of the larger degree v, this also implied the major wave (C) has also ended there, hence major correction has commenced from there with (A) leg unfolding in its lower degree wave c which has possibly ended at 145.69. Under this count, A-B-C wave (B) has commenced with A leg ended at 136.23, wave B at 143.79 and wave C has possibly ended at 149.79.
Our larger degree count is that the decline from 139.26 is wave (C) and is sub-divided into a diagonal triangle i-ii-iii-iv-v with wave i - 105.44, wave ii- 123.33, wave iii - 97.03, wave iv - 111.43, followed by the final wave v as well as the end of wave (C) at 94.12, this also mark the bottom of larger degree wave B. Under this count, major rise in wave C has commenced as an impulsive wave with minor wave III ended at 145.69, wave V is still in progress for further gain to 150.00. Having said that, this so-called wave V could well be the first leg of larger degree 5-waver wave C and this wave C should bring at least a retest of wave A top at 169.97 (July 2008).
Trade Idea: AUD/USD – Sell at 0.7915
AUD/USD – 0.7847
Recent wave: Wave 5 ended at 1.1081 and major correction has commenced for fall to 0.7000 and then towards 0.6500-10
Trend: Near term up
Original strategy :
Sell at 0.7940, Target: 0.7790, Stop: 0.8000
Position: -
Target: -
Stop: -
New strategy :
Sell at 0.7915, Target: 0.7675, Stop: 0.7975
Position: -
Target: -
Stop:-
As aussie has remained under pressure after recent anticipated selloff, adding credence to our view that top has been formed at 0.8066 (wave iii peak) and bearishness remains for this move to bring retracement of early upmove in wave iv to 0.7786 support, however, near term oversold condition should prevent sharp fall below 0.7750 and price should stay above i top at 0.7712, bring rebound later.
In view of this, would not chase this fall here and would be prudent to sell aussie again on subsequent rebound as 0.7915-20 should limit upside. Only above indicated resistance at 0.7980 would abort and suggest low is formed instead, bring a stronger rebound to 0.8000, then towards 0.8043 resistance, above there would signal the pullback from 0.8066 top has ended instead, bring retest of this level first. We are keeping our latest bullish count that recent impulsive waves is unfolding as (1 2, (i)(ii), i ii) and may extend headway towards 0.8150.
On the 4-hour chart, the move from 0.8066 is the wave 5 with i: 0.8860, ii: 0.8315, wave iii is an extended move ended at 1.0183, iv: 0.9706 and wave v has ended at 1.1081 (also the top of entire wave 5). The subsequent selloff is the major correction which is unfolding as ABC-X-ABC and 2nd A leg has ended at 0.8848, followed by a-b-c wave B which ended at 0.9758, hence, 2nd C wave is now in progress and indicated downside target at 0.7000 and 0.6950 had been met, so further fall to 0.6710-20 cannot be ruled out.

Safe Havens Give Up Gains As North Korea Tensions Ease
Overnight, media reports suggested that the North Korean leader Kim Jong-un decided not to launch missiles against the US territory of Guam, at least for now. He was quoted by state media as saying that he will watch US actions 'a little more' before deciding what to do. This marks a significant step towards deescalating the situation in our view, as it may imply a temporary ceasefire in the recent war of words between the two sides. Market participants seem to be in agreement that tensions may be easing, evident by safe haven assets such as gold, JPY, and CHF coming under selling pressure yesterday, giving back some of their recent gains. The sell-off accelerated following these news overnight. In the absence of any further headlines, we would expect the latest price action to continue for a few days. Specifically, safe havens could remain under pressure, while riskier assets such as equities may recover further.
USD/JPY traded higher overnight, after it hit support near the 109.40 (S2) level. The rate broke above the 109.90 (S1) hurdle, which acted as the lower bound of the range that had been containing the price action from July 28th to August 10th, between that zone and 111.00 (R1). Given that the pair is now back within that range, and that it also broke above a short-term downtrend line taken from the high of the 14th of July, we see the case for further upside extensions, perhaps towards the upper bound of the range at 111.00 (R1). The fact that the rate rebounded from near an upside support line taken from the low of the 17th of April also enhances the case for more bullish advances. If buyers manage to overcome 111.00 (R1), they could initially aim for the 111.70 (R2) area.
RBA minutes do not jawbone the AUD; Wage data in focus
The RBA may not be that concerned with the recent strength of the Australian dollar, the minutes of the latest policy gathering showed overnight. Policymakers only noted that 'further appreciation' of AUD could weigh on the outlook for inflation and growth. In an indirect way, this is similar to the RBA saying that the levels the Aussie is currently trading at are tolerable. Importantly, the minutes also reiterated the Bank's concerns regarding low wage growth. As such, we think that the wage price index for Q2, due out during the Asian morning Wednesday, is likely to attract a lot of attention. The consensus is for wages to have grown at the same pace as previously. We view the risks surrounding that forecast as tilted to the upside, considering that the NAB business survey for Q2 showed that growth in labor costs accelerated notably. A positive surprise in this index could alleviate some of the RBA's concerns about subdued wage growth and thereby, support the Aussie.
AUD/USD traded lower on Monday, after it found fresh sell orders near the 0.7910 (R1) area. The rate declined to hit support near the 0.7840 (S1) level and subsequently it rebounded somewhat. Given the price structure on the 4-hour chart and the pair's proximity to the key barrier of 0.7800 (S2), we maintain our flat view for now. That barrier acted as the upper bound of the sideways range that contained the price action from March 2016 until July 2017 and thus, we remain mindful that it may be proved a rebound zone now. In addition, in case we are right about a positive surprise in tonight's wage data, the bulls could retake control and push the battle higher. A potential break above 0.7910 (R1) could open the way for the next resistance of 0.7950 (R2).
Today's highlights:
In the UK, CPI data for July will take center stage. The forecast is for both the headline and core CPI rates to have ticked up. Even though a rebound in these rates could keep alive some speculation about a BoE rate hike in the near-term and thereby support the pound, we remain skeptical on whether a hike will actually materialize. Policymakers showed little urgency for such action at the latest BoE meeting, and we do not blame them considering the still-lackluster economic growth and wage prints. Germany preliminary GDP data for Q2 are also due out.
We also get CPI data for July from Sweden, and the forecast is for both the headline and the underlying inflation rates to have risen. Such a rebound in inflation could amplify speculation that the Riksbank may remove its interest rate easing bias soon and as a result, bring SEK under renewed buying pressure.
From the US, we get retail sales for July and expectations are for both the headline and the core rates to have rebounded after declining for two consecutive months. Such prints could prove positive for the dollar, but we think that the currency's near-term direction may be decided primarily by the FOMC July minutes due out tomorrow. We also get the Empire State manufacturing and the NAHB housing market indices, both for August.
USD/JPY
Support: 109.90 (S1), 109.40 (S2), 108.70 (S3)
Resistance: 111.00 (R1), 111.70 (R2), 112.20 (R3)
AUD/USD
Support: 0.7840 (S1), 0.7800 (S2), 0.7750 (S3)
Resistance: 0.7910 (R1), 0.7950 (R2), 0.8000 (R3)
Technical Outlook: AUDUSD Extends Weakness After RBA Minutes
The Aussie dollar extends weakness on Tuesday and hit fresh one-month low at 0.7824, on probe below daily Kijun-sen support (0.7834). Recovery of the greenback and release of RBA minutes overnight, contributed to fresh weakness of Australian dollar. RBA is likely to keep rates on hold for some time and said that higher AUD could lower inflation and economic growth. Fresh bears found footstep just above 50% retracement of 0.7571/0.8065 rally at 0.7818 but daily techs turning into bearish setup see risk of further weakness. Break below 0.7818 could trigger extension towards 0.7760 (Fibo 61.8% of 0.7571/0.8065). Session high at 0.7876 marks initial resistance, ahead of more significant falling 10 SMA (currently at 0.7900) which is expected to limit upside attempts.
Res: 0.7876, 0.7900, 0.7930, 0.7948
Sup: 0.7818, 0.7760, 0.7719, 0.7688
EUR/JPY: Industrial Production
The EUR/JPY revealed almost no reaction on the disappointing Euro zone industrial production report. The European single currency lost against the Yen one base point to keep showing the downward trend. However, by the end of the session the pair roared back to the 129.49 area.
The Eurostat reported that the industrial production in the Euro zone fell 0.6% over the month of June, while analysts anticipated a slightly weaker 0.4% drop. A contraction in the industrial output suggests that the economy across the 19-country bloc failed to consolidate the healthy growth pace. Moreover, any signs that the Euro zone economic growth is faltering would raise concerns that the European Central Bank is likely to unwind its monetary stimulus.
EUR/USD: German Prelim GDP Q/Q
Weaker-than-expected preliminary report of the German GDP growth in the Q2 managed to strengthen bearish sentiment in the EUR/USD pair. The Euro rose initially against the Greenback, but continued to trade below the 1.1763 mark. Though, during the Tuesday's session, the further direction would be determined by the US economic reports.
Destatis revealed that its preliminary estimate for the Germany's economic expansion rose 0.6% in the June quarter, following an upwardly revised 0.7% gain in the Q1. The country's economic growth was driven by higher industrial production and retail sales. However, risks of deterioration in the Euro zone's largest economy could result in more cautious ECB stance towards the next policy changes.
Technical Outlook: USDJPY Extends Recovery Above 110.00, Eyes US Retail Sales For Further Support
The dollar extends strong recovery rally on Tuesday to 110.46 (50% retracement of 112.19/108.72 downleg) after surge through important barrier at 110.00.
Fresh bullish momentum could drive the price higher for test of key barriers at 111.00 zone (Fibo 38.2% of 114.49/108.72 descend at 110.93/04 Aug post-NFP high at 111.04), break of which would generate another strong bullish signal.
Broken 110.00 hurdle (Fibo 38.2% of 112.19/108.72 bear-leg/10SMA) now acts as solid support.
US retail sales data are due later today and expected to further support the dollar on release at/above forecast for July at 0.4%.
Res: 110.61, 110.93, 111.04, 111.30
Sup: 110.00, 109.80, 109.60, 109.40
Technical Outlook: GBPUSD At The Back Foot Ahead Of UK CPI Data
Cable remains in red on Tuesday, following previous day's bearish close and pressuring Friday's low at 1.2939 (reinforced by 55SMA).
The pair is awaiting UK inflation data for fresh signal (forecast for July is 2.7% vs 2.6% in June) and release at/above forecasted level would be supportive for renewed attempts towards key points: psychological 1.3000 barrier and 1.3031 (near-term congestion top / falling 10SMA).
Conversely, release below 2.7% would add pressure on sterling for final break below near-term congestion and risk extension towards 1.2857/48 (100SMA / Fibo 61.8% of 1.2588/1.3268 rally).
Res: 1.2970, 1.3000, 1.3031, 1.3054
Sup: 1.2930, 1.2900, 1.2857, 1.2848
Technical Outlook: EURUSD – Bearish Inside Day On Monday And Weak German GDP Data Keep The Pair Under Pressure
The Euro extends lower in early Tuesday's trading after Monday's bearish Inside Day signaled fresh weakness, following repeated recovery rejection.
Additional pressure came on weaker than expected German Q2 GDP (0.6% vs 0.7% f/c) released at the beginning of European session that pushed the price below initial support at 1.1775 (hourly cloud base).
Next strong support at 1.1741 (rising 20SMA which tracks the uptrend since 27 June) is under pressure, with break here to open key near-term support at 1.1689 (09 Aug correction low) and risk an extension towards 1.1607 (Fibo 38.2% of 1.1188/1.1910 rally).
Broken hourly cloud base now acts as immediate resistance at 1.1775, followed by 10SMA at 1.1793, which caps today's action for now and hourly cloud top at 1.1811, break of which is needed to shift near-term focus higher.
Res: 1.1775, 1.1793, 1.1811, 1.1846
Sup: 1.1741, 1.1689, 1.1640, 1.160