Sample Category Title
GBP/USD Candlesticks and Ichimoku Analysis
Weekly
• Last Candlesticks pattern: Long white candlestick
• Time of formation: 16 Jan 2017
• Trend bias: Down
Daily
• Last Candlesticks pattern: Long white candlestick
• Time of formation: 18 Apr 2017
• Trend bias: Near term up
GBP/USD – 1.2961
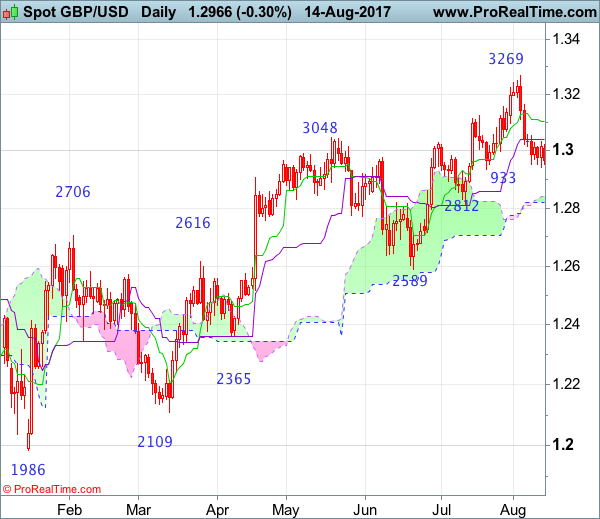
Cable continued meeting renewed selling interest just above 1.3000 level and has remained under pressure, adding credence to our view that a temporary top has been formed earlier at 1.3269 and further consolidation below this level would take place with mild downside bias for a test of indicated previous support at 1.2933, once this level is penetrated, this would signal recent upmove is over, bring further fall to 1.2890, then towards previous support at 1.2812 which is expected to contain downside.
On the upside, whilst recovery to 1.3020-30 cannot be ruled out, reckon upside would be limited to 1.3055-60 and bring another decline later. A daily close above the Tenkan-Sen (now at 1.3105) would defer and risk a stronger rebound to 1.3150 and possibly towards 1.3200 but price should falter well below said resistance at 1.3269, bring another leg of corrective decline later. A daily close above 1.3200 would risk another test of said resistance at 1.3269 but break there is needed to confirm recent upmove has resumed and extend gain to 1.3300-10, having said that, loss of upward momentum should prevent sharp move beyond resistance at 1.3425 and price should falter well below 1.3500-05 (50% Fibonacci retracement of 1.5018-1.1986).
Recommendation: Sell at 1.3050 for 1.2850 with stop above 1.3150.
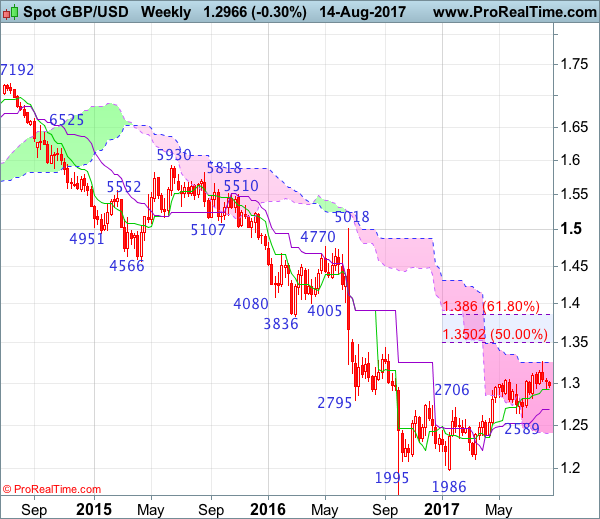
On the weekly chart, the British pound ran into resistance at 1.3269 earlier this month and has retreated since, the black candlestick with a long upper shadow (shooting star alike) suggests a temporary top is possibly formed there and consolidation with mild downside bias is seen for test of the Tenkan-Sen (now at 1.2929), a weekly close below this level would bring correction of recent rise to 1.2880-85, however, reckon downside would be limited to support at 1.2812 and downside would be limited to 1.2700-10, price should stay well above support at 1.2589, bring a rebound later.
On the upside, expect recovery to be limited to 1.3055-60 and bring such a retreat later to aforesaid downside targets. Above 1.3165 resistance would defer and suggest the retreat from 1.3269 has possibly ended, bring retest of this level, break there would extend the erratic rise from 1.1986 low for retracement of early downtrend to 1.3300-10 and 1.3350-60, however, near term overbought condition should limit upside to previous resistance at 1.3425 and reckon 1.3500-05 (50% Fibonacci retracement of 1.5018-1.1986) would hold, price should falter below 1.3670-75, bring another decline in Q4.
USD/CHF Candlesticks and Ichimoku Analysis
Weekly
• Last Candlesticks pattern: Shooting star
• Time of formation: 7 Mar 2017
• Trend bias: Sideways
Daily
• Last Candlesticks pattern: Morning star
• Time of formation: 9 May 2017
• Trend bias: Near term up
USD/CHF – 0.9733
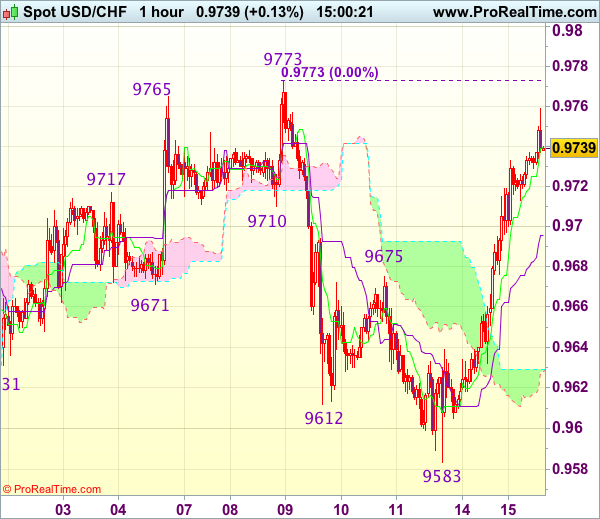
Although the greenback retreated to as low as 0.9583 on Friday, dollar did find renewed buying interest there and has staged a strong rebound, suggesting the retreat from 0.9773 has possibly ended there and consolidation with upside bias is seen for gain to said resistance but break there is needed to signal another leg of rise from 0.9438 low is underway for further gain to resistance at 0.9808. Looking ahead, a break above this level is needed to retain bullishness and encourage for subsequent rise to 0.9845-50 (61.8% Fibonacci retracement of 1.0100-0.9438), having said that, near term overbought condition should limit upside to 0.9900-10 and price should falter well below psychological resistance at 1.0000, bring retreat later.
On the downside, whilst initial pullback to the Tenkan-Sen (now at 0.9678) cannot be ruled out, reckon the lower Kumo (now at 0.9652) would contain downside and bring another rebound later. Below 0.9630 would risk another test of said support at 0.9583 but break there is needed to shift risk to downside for weakness to 0.9550, then towards support at 0.9490. Only a drop below this level would abort and signal the rebound from 0.9438 has ended instead, risk retest of this level, once this support is penetrated, this would indicate recent decline from 1.0344 (2016 high) has resumed and extend weakness to 0.9390-00, then towards 0.9330-40.
Recommendation: Hold long entered at 0.9600 for 0.9800 with stop below 0.9640

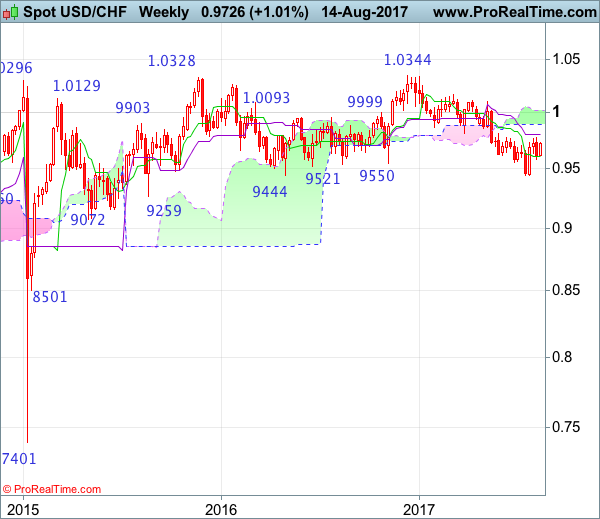
On the weekly chart, although dollar’s retreat from 0.9773 formed a black candlestick last week and consolidation below this level would be seen, reckon downside would be limited to 0.9580-85 and bring another rebound, above said resistance at 0.9773 would add credence to our view that a temporary low is possibly formed at 0.9438 last month, bring retracement of recent selloff to 0.9805-08 (current level of the Kijun-Sen and previous resistance), above there would provide confirmation, bring subsequent gain to 0.9845-50 (61.8% Fibonacci retracement of 1.0100-0.9438) and possibly test of the lower Kumo (now at 0.9894) but price should falter below psychological resistance at 1.0000, bring another decline later.
On the downside, expect pullback to be limited to the Tenkan-Sen (now at 0.9606) and 0.9583 should hold, bring another rise later. Only a drop below support at 0.9490 would abort and suggest the rebound from 0.9438 has ended, bring retest of this level later. Once this recent low is penetrated, this would signal the decline from 1.0344 (2016 high) is still in progress and may extend weakness to 0.9350, then towards 0.9290-00, however, loss of near term downward momentum should prevent sharp fall below 0.9250 and reckon 0.9200-10 would hold from here, risk from there has increased for a rebound later.
Risk Appetite Returns
North Korea's official news agency reported on Monday that leader Kim Jong Un will watch the actions of the United States for a while longer before making a decision to fire missiles at Guam. President Trump did not respond to this latest comment but Defense Secretary Mattis warned that the US Military is ready to intercept any missiles fired by North Korea. This latest 'war of words' relieved market concerns with a move away from safe havens and a degree of risk-on sentiment. To add to USD demand was the recent comments made by New York Federal Reserve President Dudley who, on Monday, suggested that if economic data holds up then it was not unreasonable to think that the FOMC would begin trimming its $4.2 trillion balance sheet next month and hiking interest rates by the years' end. In the early hours of Tuesday morning the minutes from the last Reserve bank of Australia policy meeting put the focus back on household debt. The RBA, in keeping to its monetary policy, commented for the 'need to balance the risks associated with high household debt in a low-inflation environment'.
EURUSD gave up recent gains as USD demand increased. Overnight EURUSD has traded as low as 1.1768 and currently trades around 1.1780.
USDJPY has gained over 0.7% overnight, reaching a current high of 110.42, as demand for safe haven JPY has diminished. Currently USDJPY is trading at the daily high.
GBPUSD is generally flat from last nights close. Currently GBPUSD is trading around 1.2965.
Gold declined 0.5% overnight, following comments from Kim Jong Un, to trade as low as $1,272.97. Currently Gold is trading around $1,275.
WTI fell on Monday as fears of falling oil demand in China overshadowed news that Libya's crude supply was disrupted. WTI added 0.2% overnight to currently trade around $47.75pb.
A plethora of US economic data will help give some indication as to whether H2 GDP will outperform H1. July retail sales are expected to rise from June, while housing starts and industrial production may be muted.
At 09:30 BST UK National Statistics will release Consumer Price Index (YoY) for July. Market consensus is calling for 2.7% from the previous reading of 2.6%. Inflationary pressure will add more credibility to a Bank of England rate hike later this year.
At 13:30 BST US Census Bureau will release Retail Sales (MoM) for July. Consensus is calling for a robust increase to 0.4% from the previous poor reading of -0.2%. An increase will help the FOMC adhere to their plans to have one more rate hike this year.
In The US, Retail Sales Figures For July Are Out Today
Market movers today
The UK CPI inflation figure for July released today is likely to at tract significant attention. The development of inflation will be scrutinised because it will be a key factor in t he BoE's decision of whether or not to hike rates before 2018.
In the US, retail sales figures for July are out today. We do not expect retail sales to deviate significantly from their only moderately growing trend. Overall, we expect consumption growth to continue at a decent pace, which should be mirrored by positive retail sales growth. Further, the Empire manufacturing PMI for August is also released today.
In the euro area, the first estimate of German GDP growth for Q2 is out . Throughout Q2, German activity indicators have reached historical highs signalling strong growth in Q2. The euro area reported quarterly growth of 0.6% last week and we expect a similar quarterly growth rate in Germany.
In the Scandi countries, Swedish CPI and CPI Figures for July are the main event today, where we expect CPI Ftobreach 2% (for further information, please see page 2). Additionally, we also get the Danish GDP indicator for Q2 and Norwegian trade balance figures.
Selected market news
Overnight , Asian equities followed US and European equities higher amid signs that a military conflict between the US and North Korea is not imminent . According to the North Korean news agency, North Korean leader Kim Jong Un is reviewing missile strike plans and said that he will watch what t he US is doing a “ little more”. Meanwhile, according to a Bloomberg story, the US defence secretary James Mat t is said t he US could “ take out ” any missile from North Korea and added that doing so “ could escalate int o war very quickly”.
President Trump yesterday signed a presidenial memorandum which will set in mot ion a US trade investigation of China's intellectual property policies, which could lead to new tariffs on Chinese import s. China react ed yesterday through st at e media warning the US to avoid “ making [a] rash decision”, signalling t hat t he investigation could poison the overall China -US relationship especially at a time when the two countries are trying to deal with the North Korea issue. The risk of an immediate trade war is unlikely however as a senior US official signalled that the investigation could take up to a year and would involve consultations with China.
Yesterday, New York Fed governor William Dudley signalled that another rate hike this year is very much on the cards and suggested that the Fed would announce its tapering plans next month. He also predicted inflation would move somewhat higher as the labour market tightens further. The markets are currently pricing in about a 40% chance of a rate hike at the December meeting. We continue to have as a base case that the Fed will hike rates in December, followed by one or two rate hikes next year.
Trade Idea : USD/CHF – Buy at 0.9695
USD/CHF - 0.9744
Most recent candlesticks pattern : N/A
Trend : Near term up
Tenkan-Sen level : 0.9740
Kijun-Sen level : 0.9696
Ichimoku cloud top : 0.9629
Ichimoku cloud bottom : 0.9628
New strategy :
Buy at 0.9695, Target: 0.9795, Stop: 0.9660
Position : -
Target : -
Stop : -
As the greenback has continued heading north after this week’s anticipated rally, suggesting the retreat from 0.9773 has ended at 0.9583, hence consolidation with upside bias remains for another test of said resistance, however, break there is needed to confirm early rise from 0.9438 low has resumed and extend gain to 0.9808 and possibly 0.9825 resistance, however, near term overbought condition should limit upside and price should falter below previous support at 0.9859.
In view of this, we are looking to reinstate long on pullback as 0.9695-00 should limit downside and bring another rise later. Below previous resistance at 0.9675 would defer and risk weakness towards 0.9640 but downside should be limited to 0.9615-20 and bring another rise later.
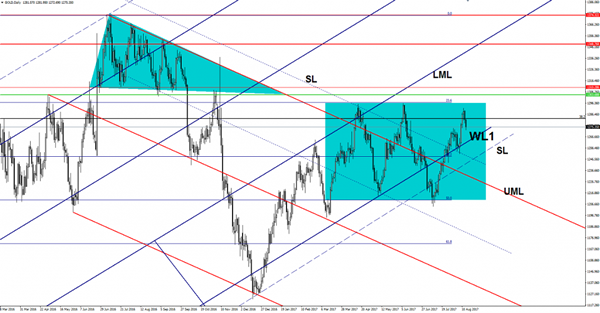
Gold Focused On Correction
Gold is very heavy on the Daily chart and looks unstoppable. It should hit the warning line (WL1) in the upcoming days. The yellow metal could start another leg lower if the United States data will impress in the afternoon. The current drop is natural after the failure to reach and retest the 23.6% retracement level and the $1295 per barrel.
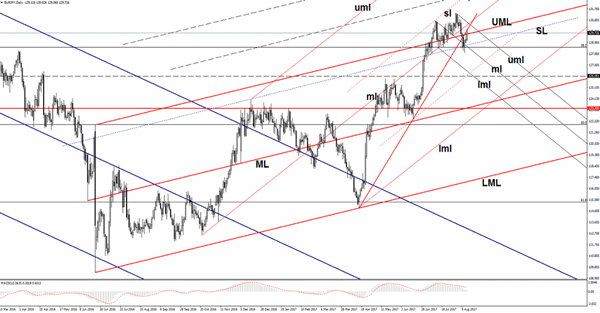
EUR/JPY Head And Shoulders?
Price turned to the upside after the false breakdown below the confluence area formed by the 38.2% retracement level with the sliding line (SL) and with the median line (ml) of the minor descending pitchfork. Now is pressuring the upper median line (UML) of the major ascending pitchfork, has retested the red uptrend line as well.
Could still increase to retest the confluence formed by the uptrend line with the upper median line (uml), or the one formed between the median line (ml) of the black ascending pitchfork with the upper median line (ml) of the minor descending pitchfork.
A rejection from the mentioned confluence areas will signal a Head and Shoulders pattern, it will be confirmed only after a valid breakdown below the 38.2% retracement level.
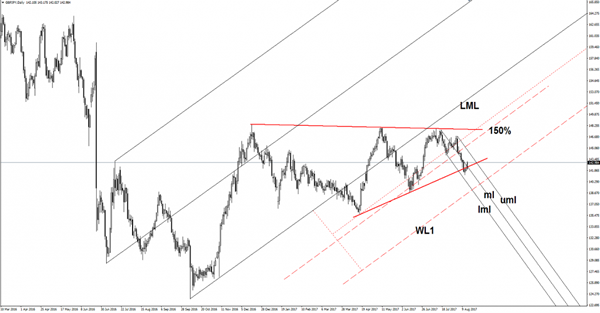
GBP/JPY Truned To The Upside
Price rallies aggressively as the Yen is demolished by the Nikkei's impressive jump. GBP/JPY is trading in the green and looks motivated to climb much above the 143.00 psychological level. Today's rally invalidated a crucial breakdown, we still need a confirmation that will increase further in the upcoming period.
The Yen drops versus all its rivals as the JP225 started an aggressive bullish momentum, has opened with a gap up today as well, signaling that the bulls are in full control. The index is trading above the 19700 major static resistance and could climb towards the 20058 long term upside obstacle.
I want to remind you that the Nikkei is still under massive pressure despite the current rebound, could drop anytime again as long as stays under the 20058 horizontal resistance.
You should be careful later as the UK is to release high impact data, the CPI is expected to increase by 2.7% in the last month, more versus the 2.6% growth in the former reading period, while the Core CPI could increase by 2.5%, beating the 2.4% in June. The RPI, HPI, PPI Input and the PPI Output will be released as well.
Looks like we had a false breakdown below the red uptrend line, a retest of this obstacle will signal a further increase in the upcoming period. The rebound is natural after the failure to reach the lower median line (lml) of the minor descending pitchfork.
A bounce back at least till the median line (ml) was expected, right now should climb to retest the upper median line (uml).
Trade Idea : GBP/USD – Stand aside
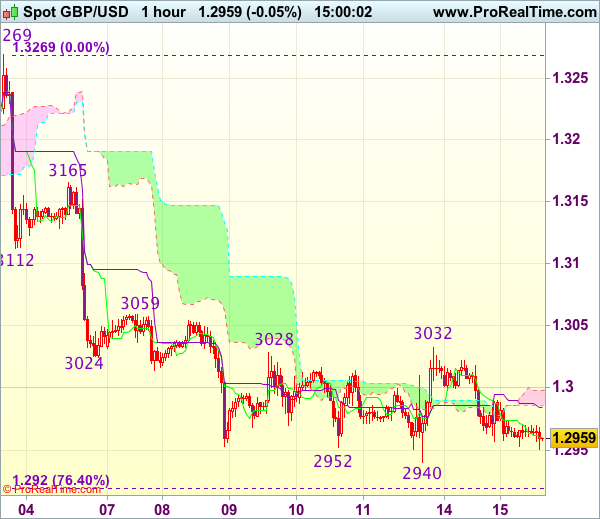
GBP/USD - 1.2947
Most recent candlesticks pattern : N/A
Trend : Near term down
Tenkan-Sen level : 1.2958
Kijun-Sen level : 1.2982
Ichimoku cloud top : 1.2998
Ichimoku cloud bottom : 1.2986
New strategy :
Stand aside
Position : -
Target : -
Stop : -
As the British pound has remained under pressure, adding credence to our bearish view that the decline from 1.3269 top is still in progress for retracement of early upmove, hence downside bias remains for test of previous chart support at 1.2933 but break there is needed to bring further fall to 1.2900, having said that, near term oversold condition should limit downside to 1.2870-75 and 1.2850 should hold from here, bring rebound later.
In view of this, would not chase this fall here and would be prudent to stand aside in the meantime. Above 1.2990 would bring another bounce towards resistance at 1.3032 but break there is needed to signal a temporary low is formed, bring correction back to resistance at 1.3059 first.
Trade Idea : EUR/USD – Sell at 1.1770
EUR/USD - 1.1733
Most recent candlesticks pattern : N/A
Trend : Sideways
Tenkan-Sen level : 1.1763
Kijun-Sen level : 1.1785
Ichimoku cloud top : 1.1810
Ichimoku cloud bottom : 1.1776
Original strategy :
Bought at 1.1790, stopped at 1.1770
Position : - Long at 1.1790
Target : -
Stop : - 1.1770
New strategy :
Sell at 1.1770, Target: 1.1670, Stop: 1.1805
Position : -
Target : -
Stop : -
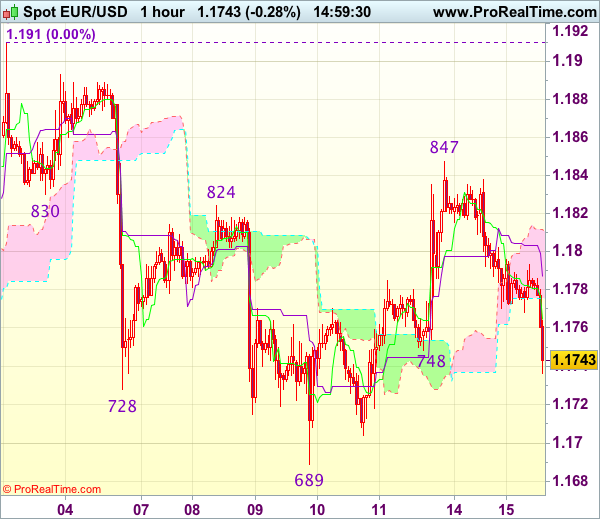
Current selloff dampened our bearishness and suggests the rebound from 1.1689 (last week’s low) has ended at 1.1847, hence consolidation with downside bias is seen for weakness to 1.1700-05, however, break of said support at 1.1689 is needed to retain bearishness and extend recent decline from 1.1910 top to 1.1640-50 (50% Fibonacci retracement of 1.1370-1.1910 and previous support) which is likely to hold from here due to oversold condition.
In view of this, we are looking to sell euro on recovery as 1.1770-80 should limit upside and bring another decline later. Above 1.1800-05 would abort and prolong choppy trading within recent established broad range, risk another rebound to said resistance at 1.1847 first.