Sample Category Title
Australian Economy Will Likely Pick Up Pace In The Near-Term: RBA Minutes
For the 24 hours to 23:00 GMT, the AUD declined 0.66% against the USD and closed at 0.7856.
LME Copper prices declined 0.04% or $2.5/MT to $6351.0/MT. Aluminium prices declined 0.5% or $10.5/MT to $2030.0/MT.
In the Asian session, at GMT0300, the pair is trading at 0.7868, with the AUD trading 0.15% higher against the USD from yesterday’s close, after minutes of the Reserve Bank of Australia’s (RBA) August meeting highlighted an upbeat outlook for the Australian economy.
Minutes indicated that policymakers expressed confidence that Australia’s economic growth is likely to pick up pace in the coming months. However, the central bank reiterated its view that the housing market as well as household debt warrants “careful monitoring” and that any further rise in the local currency could lead to slower growth and subdued inflation.
The pair is expected to find support at 0.7838, and a fall through could take it to the next support level of 0.7808. The pair is expected to find its first resistance at 0.7905, and a rise through could take it to the next resistance level of 0.7942.
The currency pair is trading between its 20 Hr and 50 Hr moving averages.

Euro-Zone’s Industrial Output Fell For The First Time Since February 2017
For the 24 hours to 23:00 GMT, the EUR declined 0.45% against the USD and closed at 1.1778, after the Euro-zone's seasonally adjusted industrial production eased more-than-expected by 0.6% on a monthly basis in June, declining for the first time in four months. Industrial production had recorded a revised rise of 1.2% in the previous month, while markets had anticipated for a fall of 0.5%.
The greenback advanced against its key peers, as geopolitical concerns surrounding the US and North Korea ebbed.
The US Dollar added to gains, after the New York Federal Reserve (Fed) President, William Dudley, stated that he favours another interest rate hike before the year-end if the economy improves in line with expectations.
In the Asian session, at GMT0300, the pair is trading at 1.1783, with the EUR trading a tad higher against the USD from yesterday's close.
The pair is expected to find support at 1.1755, and a fall through could take it to the next support level of 1.1726. The pair is expected to find its first resistance at 1.1825, and a rise through could take it to the next resistance level of 1.1866.
Trading trend in the Euro today is expected to be determined by the release of Germany's flash 2Q GDP data, scheduled in a few hours. Additionally, in the US, retail sales for July, NAHB housing market index for August and business inventories for June, all set to release later in the day, will pique significant amount of investor attention.
The currency pair is showing convergence with its 20 Hr moving average and trading below its 50 Hr moving average.

Pound Trading Marginally Higher, Ahead Of UK’s Inflation Data
For the 24 hours to 23:00 GMT, the GBP declined 0.41% against the USD and closed at 1.2961.
In the Asian session, at GMT0300, the pair is trading at 1.2965, with the GBP trading slightly higher against the USD from yesterday's close.
The pair is expected to find support at 1.2939, and a fall through could take it to the next support level of 1.2912. The pair is expected to find its first resistance at 1.3007, and a rise through could take it to the next resistance level of 1.3048.
Going ahead, market participants will focus on Britain's inflation report for July, slated to release in a few hours.
The currency pair is trading below its 20 Hr and 50 Hr moving averages.

Japanese Industrial Production Revised Higher In June
For the 24 hours to 23:00 GMT, the USD rose 0.34% against the JPY and closed at 109.72.
In the Asian session, at GMT0300, the pair is trading at 110.18, with the USD trading 0.42% higher against the JPY from yesterday’s close.
Earlier in the session, data showed that Japan’s final industrial production climbed 2.2% on a monthly basis in June, higher than a rise of 1.6% indicated in the flash estimate. Industrial production had registered a drop of 3.6% in the prior month.
The pair is expected to find support at 109.60, and a fall through could take it to the next support level of 109.03. The pair is expected to find its first resistance at 110.49, and a rise through could take it to the next resistance level of 110.81.
The currency pair is trading above its 20 Hr and 50 Hr moving averages.

Swiss Franc Extends Its Losses In The Asian Session
For the 24 hours to 23:00 GMT, the USD rose 0.96% against the CHF and closed at 0.9721.
In economic news, Switzerland’s total sight deposits inched up to a level of CHF578.9 billion in the week ended 11 August, from CHF578.6 billion recorded in the previous week.
In the Asian session, at GMT0300, the pair is trading at 0.9734, with the USD trading 0.13% higher against the CHF from yesterday’s close.
The pair is expected to find support at 0.9663, and a fall through could take it to the next support level of 0.9592. The pair is expected to find its first resistance at 0.9771, and a rise through could take it to the next resistance level of 0.9808.
Looking ahead, market participants will focus on Switzerland’s producer and import prices data for July, set to release in a few hours.
The currency pair is trading above its 20 Hr and 50 Hr moving averages.

Loonie Trading A Tad Lower In The Morning Session, Ahead Of Canada’s Existing Home Sales Data
For the 24 hours to 23:00 GMT, the USD rose 0.37% against the CAD and closed at 1.2725.
On the data front, Canada's Teranet/National Bank house price index advanced 2.0% MoM in July. In the prior month, the index had climbed 2.6%.
In the Asian session, at GMT0300, the pair is trading at 1.2728, with the USD trading marginally higher against the CAD from yesterday's close.
The pair is expected to find support at 1.2690, and a fall through could take it to the next support level of 1.2652. The pair is expected to find its first resistance at 1.2749, and a rise through could take it to the next resistance level of 1.2770.
Ahead in the day, investors will closely monitor Canada's existing home sales data for July.
The currency pair is trading above its 20 Hr and 50 Hr moving averages.

Mr Kim Turns Gold And Crude Oil, Off The Boil
A perceived drop in North Korea threats and some weak data from China and Europe was all the excuse that stale crude oil and gold longs needed to head for the exit door.
Crude Oil
Crude oil prices tumbled overnight with both Brent and WTI spot falling some 2.60 % to close at their lows at 50.50 and 47.45 respectively. Numerous factors came together during the New York session to put the knife into oil and then twist it. A decrease in North Korea tension certainly helped along with weaker China and European data. It saw the U.S. dollar strengthen in general across the markets.
The EIA also adjusted its forecasts higher for U.S. shale production, but the cynic in me regards the backward looking Commitment of Traders (COT) report as the primary driver. Although a week out of date it showed that speculative traders (mostly hedge funds) had become firmly bullish on oil again. This fits perfectly with my comments in previous reports that stale speculative long positioning and a reluctance to hold unprofitable positions has been the main force behind the oil rally running out of steam over the last few sessions. Simply put, speculators have been long and wrong at unattractive levels.
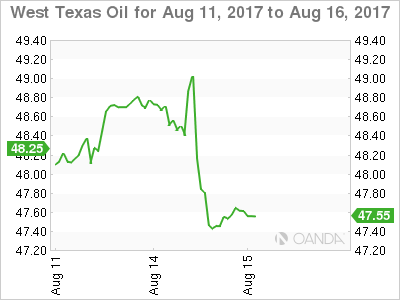
WTI
Of the two contracts, WTI spot is looking the more vulnerable technically as it trades at 47.60 in early Asia. It broke and closed below its 100-day moving average overnight at 47.85, and this forms initial resistance followed by 48.25. A break of initial support at the overnight low of 47.30 sets the scene for a much deeper washout to possibly the 46.00 and 45.00 regions.
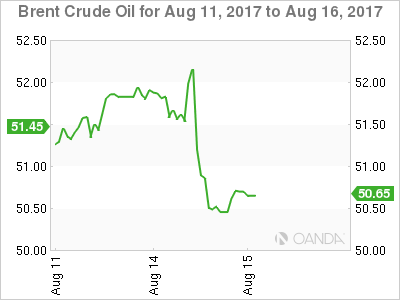
Brent
Brent spot is trading at 50.65 and clinging to its support at the 100-day average just below at 50.50. Resistance rests at 51.00 intraday. A break of 50.50 sets up a possible technical correction to support at 49.70.
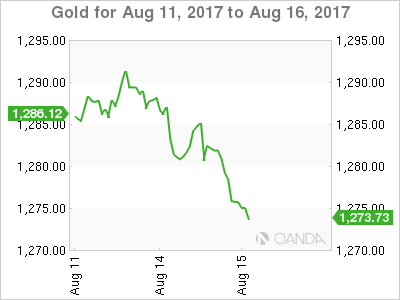
Gold
Gold feel seven dollars to 1275.00 overnight as a resurgent U.S. dollar weighed upon precious metals. Weaker China and European data and a lack of chest thumping from North Korea diminished the safe haven appeal of gold following the weekend. We suspect the lull is only temporary however and gold will continue to be supported on meaningful dips.
This morning gold continues to hover around 1275.50, just above initial support at 1275.00. A daily close below here may imply a deeper correction to 1260.00 is on the cards. However, longer term bulls will only get concerned should the 100-day moving average at 1254.85 break.
Resistance lies at 1282.00 initially ahead of 1292.50 and then the formidable 1296.00 region which must break and consolidate before we can start talking about a structural move onto a 1300 handle.
USD/CAD Daily Outlook
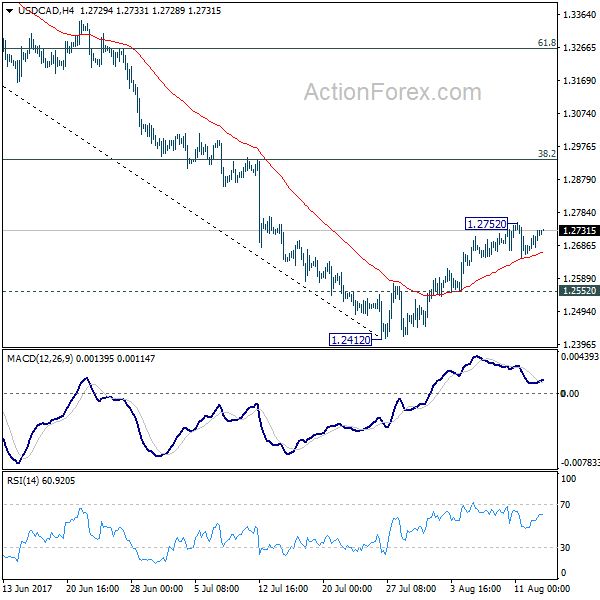
Daily Pivots: (S1) 1.2679; (P) 1.2705; (R1) 1.2748; More....
Intraday bias in USD/CAD remains neutral at this point. The corrective rise from 1.2412 might still extend higher. But based on current momentum, upside should be limited by 38.2% retracement of 1.3793 to 1.2412 at 1.2940 to bring fall resumption. On the downside, below 1.2552 minor support will argue that the recovery is completed and turn bias back to the downside for retesting 1.2412.
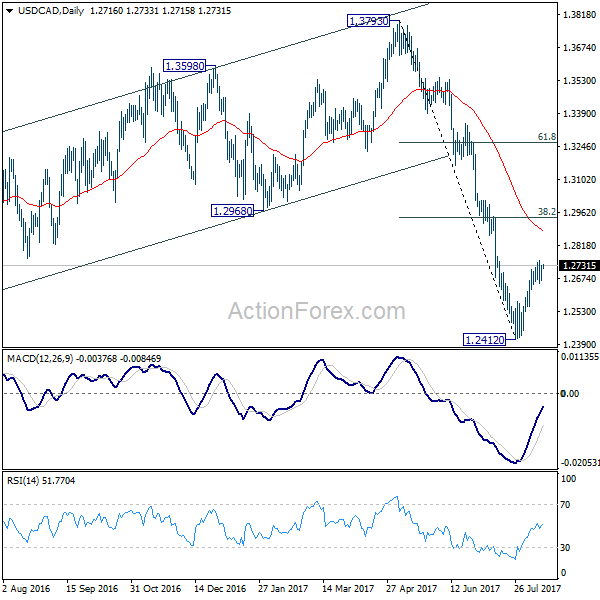
In the bigger picture, price actions from 1.4689 medium term top are seen as a correction pattern. Such corrective fall is still expected to extend to 50% retracement of 0.9406 to 1.4869 at 1.2048. At this point, we'd look for strong support from there to contain downside and bring rebound. Nonetheless, on the upside, sustained break of 1.2968, 38.2% retracement of 1.3793 to 1.2412 at 1.2940 will be the first sign of completion of the correction and will turn focus back to 1.3793 key resistance.
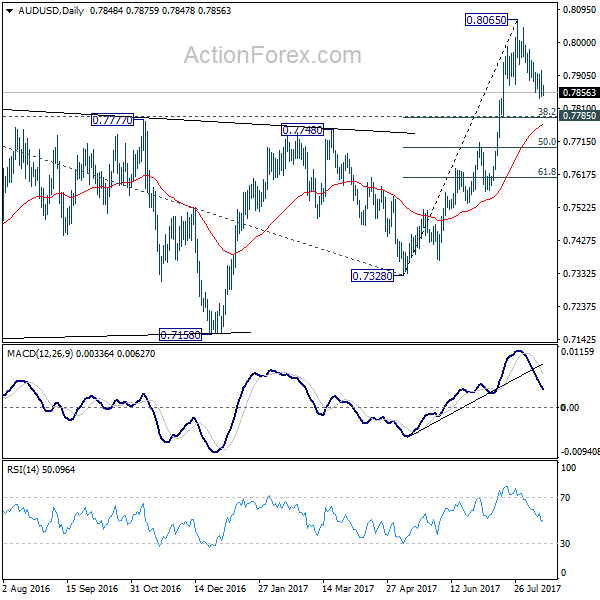
AUD/USD Daily Outlook
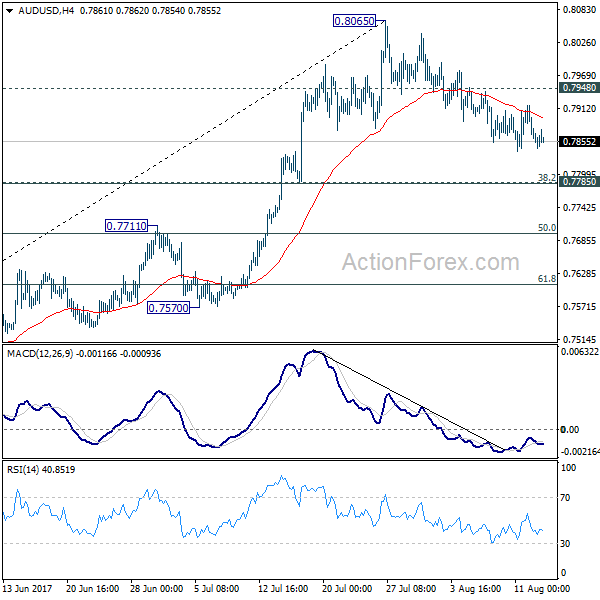
Daily Pivots: (S1) 0.7823; (P) 0.7871; (R1) 0.7897; More...
The correction from 0.8065 is still in progress and with 0.7948 minor resistance intact, deeper decline could be seen in AUD/USD. But we'd expect strong support from 0.7785 cluster support (38.2% retracement of 0.7328 to 0.8065 at 0.7783) to contain downside and bring rebound. On the upside, break of 0.7948 will argue that the pull back is completed. In such case, intraday bias will be turned back to the upside for retesting 0.8065.
In the bigger picture, rise from 0.6826 medium term bottom is still in progress. At this point, there is no confirmation of trend reversal yet and we'll continue to treat such rebound as a corrective pattern. But in any case, break of 55 month EMA (now at 0.8100) will target 38.2% retracement of 1.1079 to 0.6826 at 0.8451. Break of 0.7328 support is needed to confirm completion of the rebound. Otherwise, further rise is now expected.
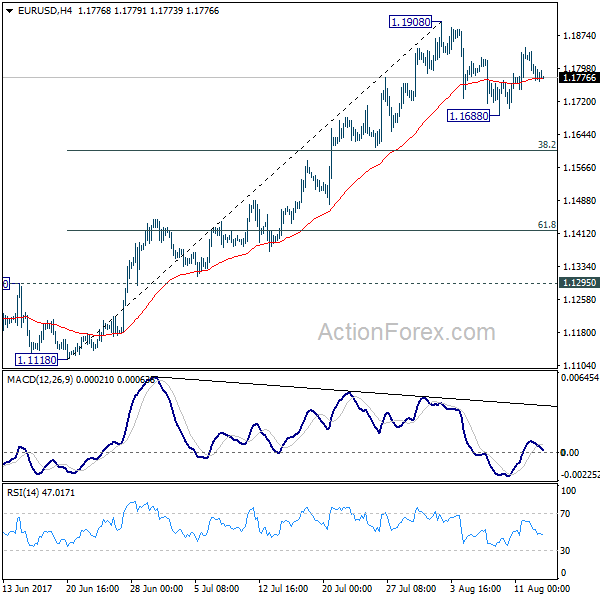
EUR/USD Daily Outlook
Daily Pivots: (S1) 1.1753; (P) 1.1796 (R1) 1.1822; More...
EUR/USD remains bounded in range of 1.1688/1908 and intraday bias stays neutral at this point. The consolidation from 1.1908 might extend and another fall cannot be ruled out. But downside should be contained by 38.2% retracement of 1.1119 to 1.1908 at 1.1606 to bring rebound. On the upside, break of 1.1908 will extend recent up trend to 1.2042 long term support turned resistance next.
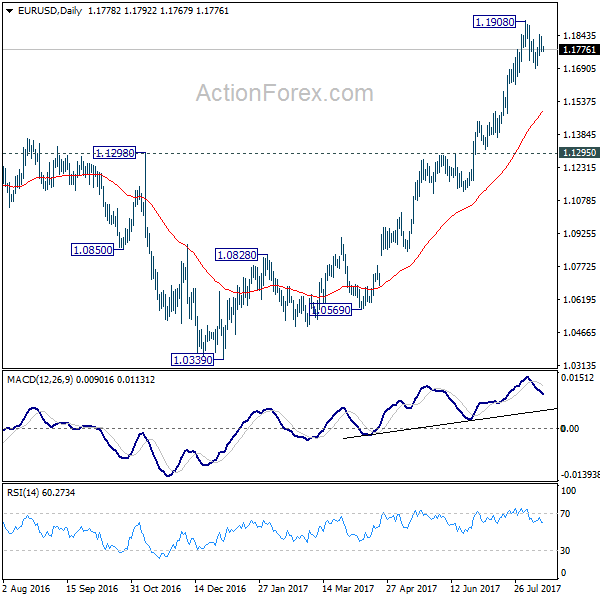
In the bigger picture, an important bottom was formed at 1.0339 on bullish convergence condition in weekly MACD. Sustained trading above 55 month EMA (now at 1.1768) will pave the way to key fibonacci level at 38.2% retracement of 1.6039 (2008 high) to 1.0339 (2017 low) at 1.2516. While rise from 1.0339 is strong, there is no confirmation that it's developing into a long term up trend yet. Hence, we'll be cautious on strong resistance from 1.2516 to limit upside. But for now, medium term outlook will remain bullish as long as 1.1295 support holds, in case of pull back.