Sample Category Title
Yen Lower Despite Strong GDP Report
USD/JPY has edged higher in the Monday session. In North American trade, the pair is trading at 109.83, up 0.33% on the day. The week started on a positive note, as Japan's Preliminary GDP was solid in the second quarter, posting a gain of 1.0%. This easily beat the estimate of 0.6%. On Monday, there are no Japanese or US releases. On Tuesday, the US releases Retail Sales and Core Retail Sales.
The Japanese economy has shown signs of improvement, and this was underscored as Preliminary GDP in Q2. Japan has now posted a sixth consecutive of growth, marking the longest expansion in over a decade. Although exports have declined, domestic demand has rebounded. With a tight labor market and the business sector confident about economic conditions, better times could continue in 2017. The fly in the ointment remains inflation, as BoJ's ultra-easy monetary policy has failed to eliminate the threat of deflation. The BoJ has insisted that it will not tighten policy before inflation climbs closer to the bank's inflation target of 2%, but clearly this goal is unrealistic in the short term, and the BoJ may have to lower its inflation target.
The Japanese yen was one of the winners of last week's crisis over North Korea, as investors shunned the stock markets and sought safe-haven assets such as the yen and gold. USD/JPY dropped 1.3% last week, and the low of 108.74 marked the lowest weekly low since April. Tensions between North Korea and the US remain high, but the prevalent sentiment in the markets is that a diplomatic solution will be found to end the crisis. Still, Donald Trump and Kim Jon-un are unpredictable leaders, and any move by either side could easily ratchet up tensions and unnerve investors. Donald Trump continues to deal with domestic problems as well, and the White House faced stinging criticism from both Republicans and Democrats, as Trump failed to single out white supremacists for the violence in Charlottseville, Virginia, where one person was killed at a demonstration against far-right marchers.
Trade Idea Wrap-up: USD/CHF – Stand aside
USD/CHF - 0.9703
Most recent candlesticks pattern : N/A
Trend : Near term down
Tenkan-Sen level : 0.9676
Kijun-Sen level : 0.9662
Ichimoku cloud top : 0.9629
Ichimoku cloud bottom : 0.9616
Original strategy :
Exit long entered at 0.9610
Position : - Long at 0.9610
Target : -
Stop : -
New strategy :
Stand aside
Position : -
Target : -
Stop : -
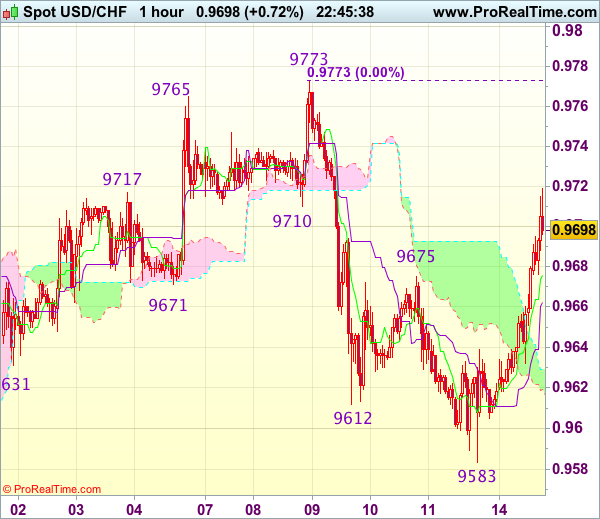
Current anticipated rally above indicated resistance at 0.9675 adds credence to our view that the fall from 0.9773 has formed a low at 0.9583 on Friday and although near term upside bias remains for the rebound from there to extend gain to 0.9720-30, as broad outlook remains consolidative, reckon upside would be limited to 0.9750 and price should falter below said resistance at 0.9773, bring retreat later.
As we have taken profit on our long position entered at 0.9610, would not chase this rise here and would be prudent to stand aside for now. Below the Kijun-Sen (now at 0.9662) would suggest an intra-day top is formed instead, bring weakness to the lower Kumo (now at 0.9616) but break there is needed to signal the rebound from 0.9573 has ended, bring weakness to 0.9600 first.
Trade Idea Wrap-up: GBP/USD – Stand aside
GBP/USD - 1.2985
Most recent candlesticks pattern : N/A
Trend : Near term down
Tenkan-Sen level : 1.2988
Kijun-Sen level : 1.2995
Ichimoku cloud top : 1.2978
Ichimoku cloud bottom : 1.2976
New strategy :
Stand aside
Position : -
Target : -
Stop : -
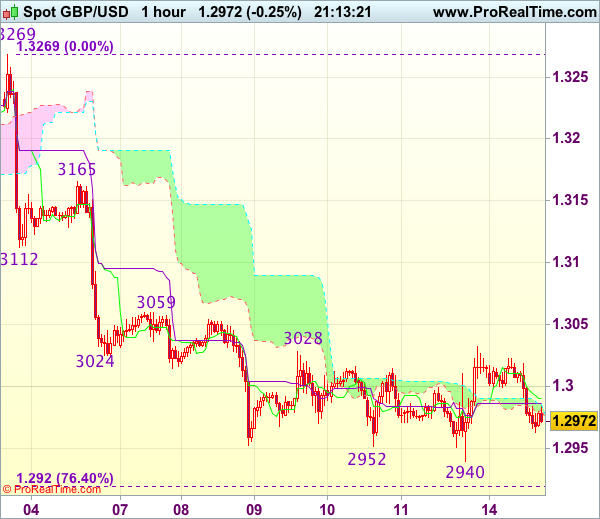
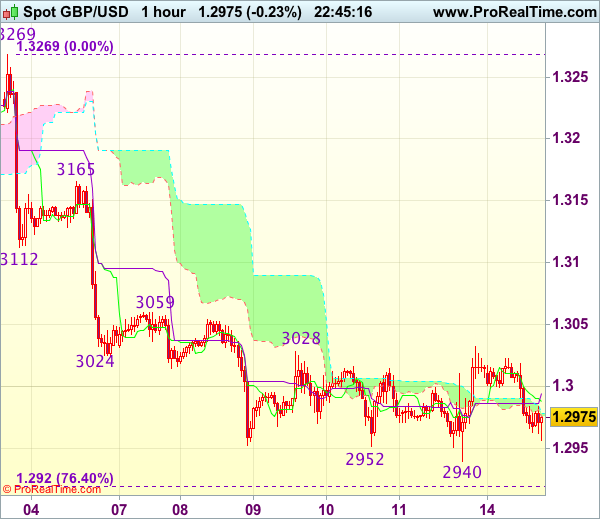
Despite falling marginally to 1.2940 last Friday, lack of follow through selling and the subsequent rebound has retained our view that further consolidation above this level would take place and another bounce to 1.3030-35 cannot be ruled out, however, reckon upside would be limited to resistance at 1.3059 and price should falter below 1.3085-90 and bring another decline later.
On the downside, below said support at 1.2940 is needed to signal recent fall from 1.3269 top has resumed and extend weakness to previous chart support at 1.2933 but reckon 1.2900 would hold from here, risk from there has increased for a rebound to take place later. As near term outlook is still mixed, would be prudent to stand aside for now.
Trade Idea Wrap-up: EUR/USD – Hold long entered at 1.1790
EUR/USD - 1.1782
Most recent candlesticks pattern : N/A
Trend : Near term up
Tenkan-Sen level : 1.1804
Kijun-Sen level : 1.1809
Ichimoku cloud top : 1.1784
Ichimoku cloud bottom : 1.1762
Original strategy :
Bought at 1.1790, Target: 1.1890, Stop: 1.1770
Position : - Long at 1.1790
Target : - 1.1890
Stop : - 1.1770
New strategy :
Hold long entered at 1.1790, Target: 1.1890, Stop: 1.1770
Position : - Long at 1.1790
Target : - 1.1890
Stop : - 1.1770
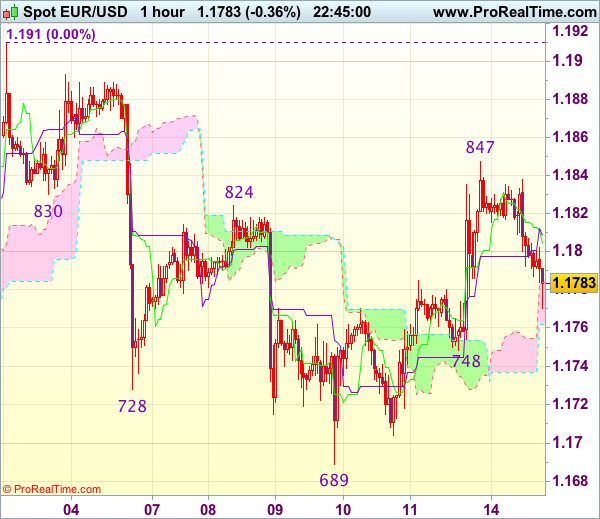
As the single currency has retreated after meeting resistance at 1.1847 on Friday, suggesting consolidation below this level would be seen, however, reckon 1.1770 would limit downside and bring another rebound, above said resistance at 1.1847 would add credence to our view that low has been formed at 1.1689 last week, bring further gain to 1.1880 but a firm break above there is needed to confirm correction from 1.1910 top has ended, bring retest of this level.
In view of this, we are holding on to our long position entered at 1.1790. Only below support at 1.1748 would defer and risk weakness to 1.1720, however, downside should be limited to 1.1700 and support at 1.1689 should remain intact, bring another rally later.
Trade Idea Wrap-up: USD/JPY – Sell at 110.10
USD/JPY - 109.54
Most recent candlesticks pattern : N/A
Trend : Near term down
Tenkan-Sen level : 109.62
Kijun-Sen level : 109.36
Ichimoku cloud top : 109.46
Ichimoku cloud bottom : 109.18
Original strategy :
Sell at 110.10, Target: 109.10, Stop: 110.45
Position : -
Target : -
Stop : -
New strategy :
Sell at 110.10, Target: 109.10, Stop: 110.45
Position : -
Target : -
Stop : -
As the greenback has staged a strong rebound after Friday’s brief fall to 108.73, suggesting a temporary low has been formed there and consolidation with mild upside bias is seen for retracement of recent decline to 109.80, however, reckon upside would be limited to resistance at 110.18 and bring retreat later, below 109.00 would signal the rebound from 108.73 has ended, bring retest of this level, break there would extend recent decline to 108.50 but previous chart support at 108.13 should remain intact.
In view of this, we are inclined to sell dollar on further subsequent rebound as resistance at 110.18 should cap upside. Above previous support at 110.25 would risk a stronger corrective rise to 110.50 but still reckon upside would be limited and resistance at 110.83 should remain intact, bring another selloff.

Trade Idea: EUR/GBP – Stand aside
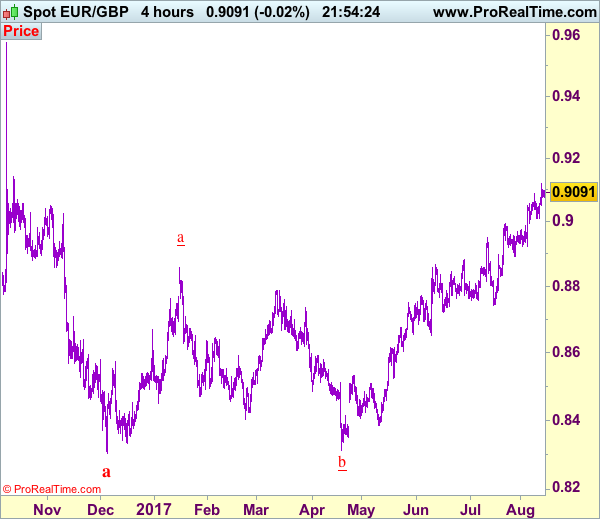
EUR/GBP - 0.9084
Recent wave: Major double three (A)-(B)-(C)-(X)-(A)-(B)-(C) is unfolding and 2nd (A) has possibly ended at 0.6936.
Trend: Near term up
New strategy :
Stand aside
Position : -
Target : -
Stop : -
As the single currency has maintained a firm undertone after surging to 0.9119 on Friday, suggesting near term upside risk remains for recent upmove to extend one more rise and gain to 0.9145-50 cannot be ruled out, however, weakening of near term upward momentum should prevent sharp move beyond 0.9175-80 and price should falter below 0.9100, bring correction later.
In view of this, would not chase this rise here and would be prudent to stand aside for now. Below 0.9050 would bring another test of 0.9008-10 support but break there is needed to suggest a temporary top is possibly formed, bring retracement of recent rise to 0.8965-70 and later towards 0.8922 support which is likely to hold from here.
Our preferred count is that, after forming a major top at 0.9805 (wave V), (A)-(B)-(C) correction is unfolding with (A) leg ended at 0.8400 (A: 0.8637, B: 0.9491 and 5-waver C ended at 0.8400. Wave (B) has ended at 0.9413 and impulsive wave (C) has either ended at 0.8067 or may extend one more fall to 0.8000 before prospect of another rally. Current breach of indicated resistance at 0.9043 confirms our view that the (C) leg has ended and bring stronger rebound towards 0.9150/54, then towards 0.9240/50.
Trade Idea: USD/CAD – Sell at 1.2800
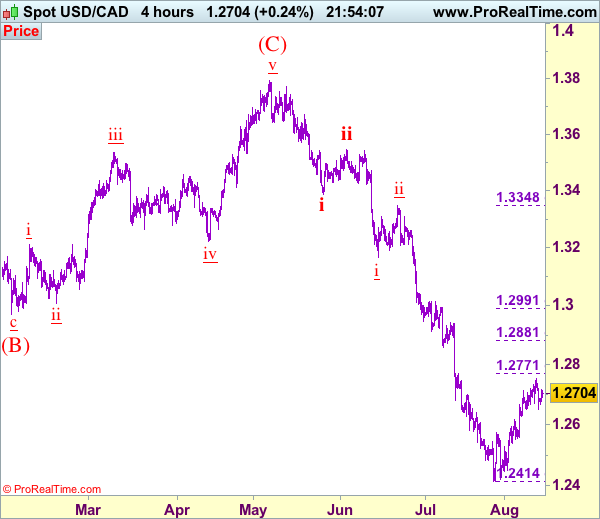
USD/CAD - 1.2703
Recent wave: Only wave v of c has ended at 0.9407 and wave C of major A-B-C correction is underway with wave iii ended at 1.4690, wave v of C may bring one more marginal rise probably in 2018
Trend: Down
Original strategy :
Sell at 1.2800, Target: 1.2600, Stop: 1.2860
Position: -
Target: -
Stop: -
New strategy :
Sell at 1.2800, Target: 1.2600, Stop: 1.2860
Position: -
Target: -
Stop:-
Although the greenback retreated after meeting resistance at 1.2753, reckon downside would be limited to support at 1.2651-52 and near term upside risk remains for the corrective rise from 1.2414 (tentatively wave iv) to extend gain to 1.2771 (previous resistance as well as 38.2% Fibonacci retracement of wave iii), however, reckon upside would be limited and renewed selling interest should emerge around 1.2800, bring retreat later, below said support would bring test of 1.2625-30, break there would suggest top is possibly formed but below 1.2540-50 is needed to add credence to this view and suggest the rebound from 1.2414 has ended instead, bring further fall to 1.2490-00, having said that, reckon support at 1.2451 would hold on first testing. We are keeping our count that wave v as well as wave (C) ended at 1.3794 and impulsive wave (i ii, i ii) is now unfolding with minor wave iii possibly ended at 1.2414, hence wave iv correction is underway.
In view of this, would be prudent to stand aside for now and look to sell on further subsequent rebound as 1.2800-10 should limit upside. Above 1.2800-10 would defer and risk a stronger correction to 1.2850, however, still reckon upside would be limited to 1.2880-85 (50% Fibonacci retracement of wave iii) and bring retreat later next week.
To recap, wave B from 1.3066 is unfolding as an a-b-c and is sub-divided as a: 1.2192, b: 1.2716 and wave c is a 5-waver with i: 1.1983, ii: 1.2506, extended wave iii with minor iii at 1.0206, wave iv ended at 1.0781 and wave v as well as wave iii has ended at 0.9931, hence the subsequent choppy trading is the wave iv which is unfolding as (a)-(b)-(c) with (a) leg of iv ended at 1.0854, followed by (b) leg at 1.0108 and (c) leg as well as the wave iv ended at 1.0674. The wave v is sub-divided by minor wave (i): 0.9980, (ii): 1.0374, (iii): 0.9446, (iv): 0.9913 and (v) as well as v has possibly ended at 0.9407, therefore, consolidation with upside bias is seen for major correction, indicated target at 1.3700 and 1.4000 had been met and further gain to 1.4700 would be seen later.
Trade Idea Update: USD/CHF – Exit long entered at 0.9610
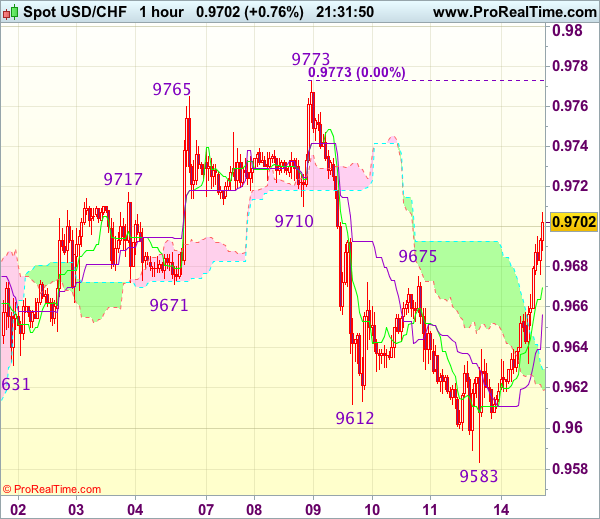
USD/CHF - 0.9705
Original strategy :
Bought at 0.9610, Target: 0.9710, Stop: 0.9600
Position : - Long at 0.9610
Target : - 0.9710
Stop : - 0.9600
New strategy :
Exit long entered at 0.9610 and stand aside
Position : - Long at 0.9610
Target : -
Stop : -
Current anticipated rally above indicated resistance at 0.9675 adds credence to our view that the fall from 0.9773 has formed a low at 0.9583 on Friday and although near term upside bias remains for the rebound from there to extend gain to 0.9720-30, as broad outlook remains consolidative, reckon upside would be limited to 0.9750 and price should falter below said resistance at 0.9773, bring retreat later.
In view of this, would be prudent to exit our long position entered at 0.9610 and stand aside for now. Below the Kijun-Sen (now at 0.9656) would suggest an intra-day top is formed instead, bring weakness to the lower Kumo (now at 0.9619) but break there is needed to signal the rebound from 0.9573 has ended, bring weakness to 0.9600 first.
Canadian Dollar Quiet as Investors Look for Cues
The Canadian dollar has ticked higher in the Monday session. Early in North American trade, USD/CAD is trading at 1.2695, up 0.12% on the day. On the release front, there are no Canadian or US events on the schedule. On Tuesday, the US releases retail sales reports.
Tensions between North Korea and the US remain high, but the prevalent sentiment in the markets is that a diplomatic solution will be found to end the crisis. Still, Donald Trump and Kim Jon-un are unpredictable leaders, and any move by either side could easily ratchet up tensions and unnerve investors. Donald Trump continues to deal with domestic problems as well, and the White House faced stinging criticism from both Republicans and Democrats, as Trump failed to single out white supremacists for the violence in Charlottsville, Virginia, where one person was killed at a demonstration against far-right marchers.
More US inflation numbers, more disappointment for the markets. Consumer Price Index reports in June underscored a soft inflation picture, as both CPI and Core CPI showed negligible gains of 0.1%. This follows a 0.1% decline in the Producer Price Index for June. The persistently soft inflation indicators may hamper plans by the Federal Reserve to raise rates, as some FOMC members continue to advocate against a rate increase until inflation climbs closer to the Fed's inflation target of 2%. However, inflation is not showing any signs of moving higher, which means that a December rate hike remains very much in doubt. Early in the year, a third rate hike seemed a foregone conclusion, but the lack of inflation and the inability of President Trump to push any major legislation through Congress has hindered Fed plans to raise rates. The odds for a December rate have dropped to 36%, according to the CME Group, pointing to wide skepticism about a rate hike before 2018.
Trade Idea Update: GBP/USD – Stand aside
GBP/USD - 1.2975
New strategy :
Stand aside
Position : -
Target : -
Stop : -
Despite falling marginally to 1.2940 last Friday, lack of follow through selling and the subsequent rebound has retained our view that further consolidation above this level would take place and another bounce to 1.3030-35 cannot be ruled out, however, reckon upside would be limited to resistance at 1.3059 and price should falter below 1.3085-90 and bring another decline later.
On the downside, below said support at 1.2940 is needed to signal recent fall from 1.3269 top has resumed and extend weakness to previous chart support at 1.2933 but reckon 1.2900 would hold from here, risk from there has increased for a rebound to take place later. As near term outlook is still mixed, would be prudent to stand aside for now.