Sample Category Title
Trade Idea Update: EUR/USD – Hold long entered at 1.1790
EUR/USD - 1.1793
Original strategy :
Bought at 1.1790, Target: 1.1890, Stop: 1.1770
Position : - Long at 1.1790
Target : - 1.1890
Stop : - 1.1770
New strategy :
Hold long entered at 1.1790, Target: 1.1890, Stop: 1.1770
Position : - Long at 1.1790
Target : - 1.1890
Stop : - 1.1770
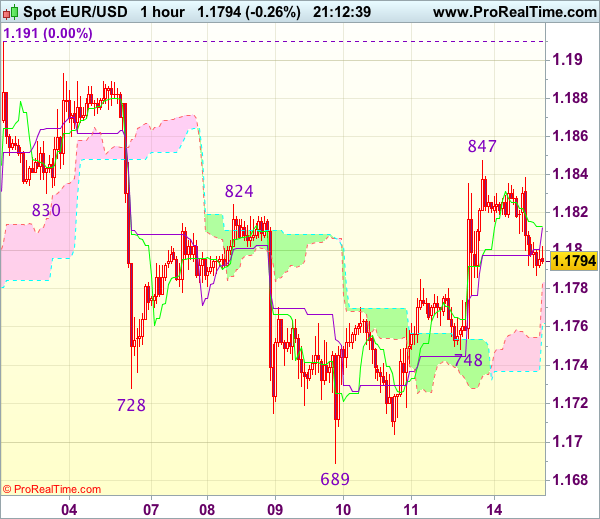
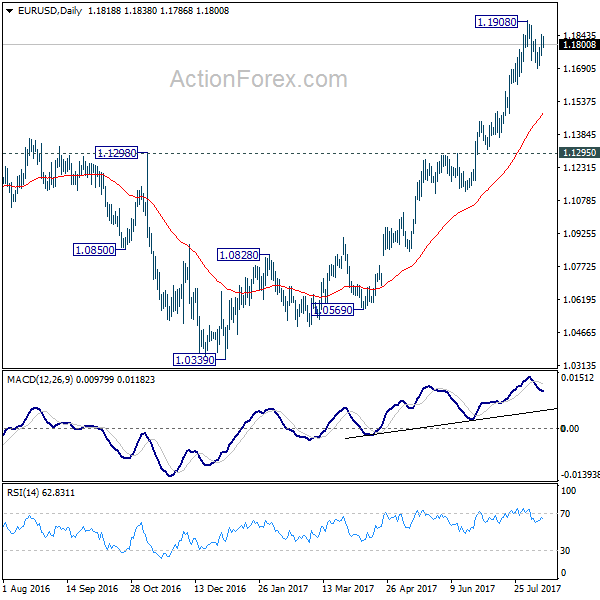
As the single currency found renewed buying interest at 1.1748 on Friday and rallied, adding credence to our view that low has been formed at 1.1689 last week and mild upside bias remains for further gain to 1.1850, then 1.1880, however, a firm break above latter level is needed to confirm correction from 1.1910 top has ended, bring retest of this level, break there would signal early upmove has resumed and extend headway towards 1.1940-50 first.
In view of this, we are holding on to our long position entered at 1.1790. Only below support at 1.1748 would defer and risk weakness to 1.1720, however, downside should be limited to 1.1700 and support at 1.1689 should remain intact, bring another rally later.
Copper Eased from Fresh High at $2.9535
Copper contract for September delivery eased from fresh high at $2.9535 posted last week, after bull-leg from early May's trough at $2.4720, ran out of steam just ticks ahead of strong resistance at $2.9540 (05 May 2015 high). Pullback from 2.9535 peak marks the fourth (corrective wave) of five-wave cycle from $2.5385 (21 June low), which should ideally end at $2.8665 (length of wave 2) according to wave theory, before broader bulls resume. Strong downside rejection on Friday ($2.8705) has generated initial reversal signal, but sustained break above $2.9200 barrier is needed for confirmation. However, risk of deeper pullback remains on the table as daily RSI has just emerged from overbought territory after forming bearish divergence pattern that is seen as negative signal. Extension below Friday's low at $2.8705 and violation of daily higher base at $2.8590 would generate negative signal and risk extension towards rising 20SMA at $2.8487.
Res: 2.9200; 2.9339; 2.9450; 2.9540
Sup: 2.8865; 2.8705; 2.8665; 2.8590
Trade Idea Update: USD/JPY – Sell at 110.10
USD/JPY - 109.59
Original strategy :
Sell at 110.10, Target: 109.10, Stop: 110.45
Position : -
Target : -
Stop : -
New strategy :
Sell at 110.10, Target: 109.10, Stop: 110.45
Position : -
Target : -
Stop : -
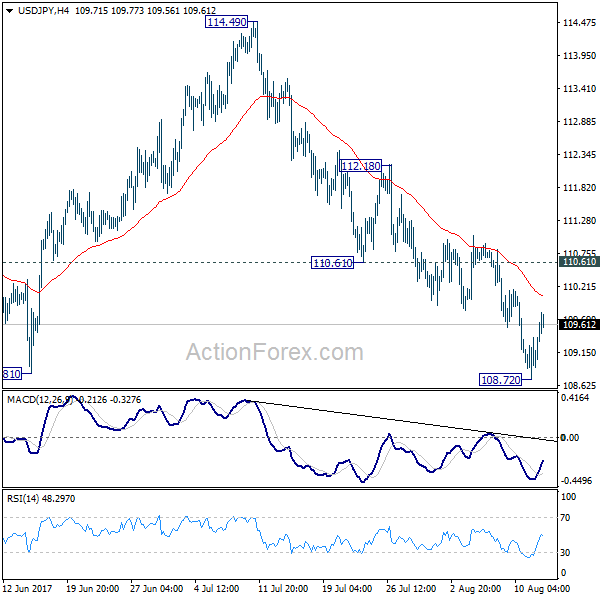
As the greenback has staged a strong rebound after Friday’s brief fall to 108.73, suggesting a temporary low has been formed there and consolidation with mild upside bias is seen for retracement of recent decline to 109.80, however, reckon upside would be limited to resistance at 110.18 and bring retreat later, below 109.00 would signal the rebound from 108.73 has ended, bring retest of this level, break there would extend recent decline to 108.50 but previous chart support at 108.13 should remain intact.
In view of this, we are inclined to sell dollar on further subsequent rebound as resistance at 110.18 should cap upside. Above previous support at 110.25 would risk a stronger corrective rise to 110.50 but still reckon upside would be limited and resistance at 110.83 should remain intact, bring another selloff.

EUR/USD Mid-Day Outlook
Daily Pivots: (S1) 1.1763; (P) 1.1805 (R1) 1.1862; More...
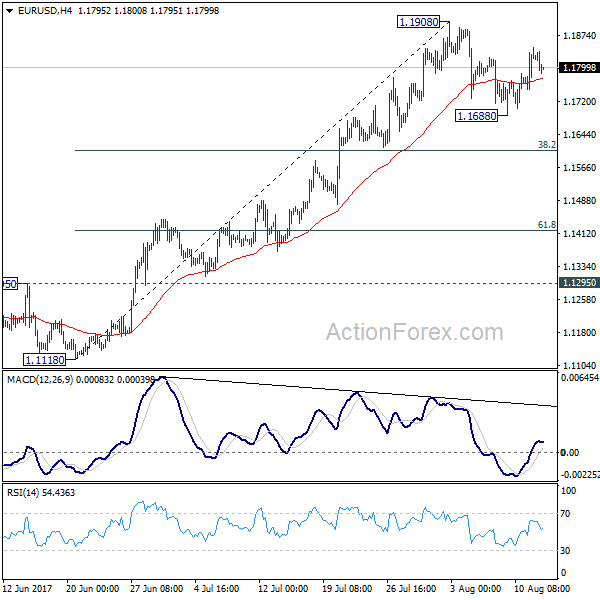
EUR/USD is staying in consolidation below 1.1908 and intraday bias remains neutral first. Another fall cannot be ruled out. But downside should be contained by 38.2% retracement of 1.1119 to 1.1908 at 1.1606 to bring rebound. On the upside, break of 1.1908 will extend recent up trend to 1.2042 long term support turned resistance next.
In the bigger picture, an important bottom was formed at 1.0339 on bullish convergence condition in weekly MACD. Sustained trading above 55 month EMA (now at 1.1768) will pave the way to key fibonacci level at 38.2% retracement of 1.6039 (2008 high) to 1.0339 (2017 low) at 1.2516. While rise from 1.0339 is strong, there is no confirmation that it's developing into a long term up trend yet. Hence, we'll be cautious on strong resistance from 1.2516 to limit upside. But for now, medium term outlook will remain bullish as long as 1.1295 support holds, in case of pull back.
GBP/USD Mid-Day Outlook
Daily Pivots: (S1) 1.2953; (P) 1.2992; (R1) 1.3045; More...
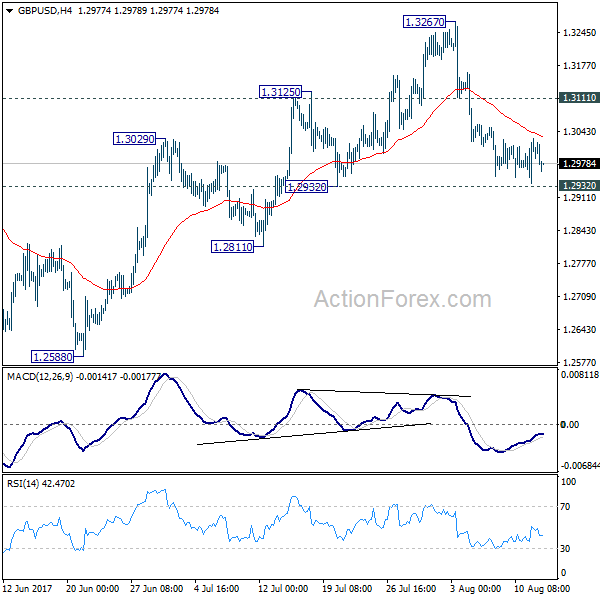
Intraday bias in GBP/USD remains neutral for the moment. Near term outlook Stays bearish with 1.3111 resistance intact and deeper decline is expected. As noted before, price actions from 1.1946 are seen as a corrective pattern and could have completed at 1.3267. Break of 1.2932 will affirm this bearish case and target 1.2588 key near term support for confirmation. However, break of 1.3111 resistance will turn bias back to the upside for retesting 1.3267 high instead.
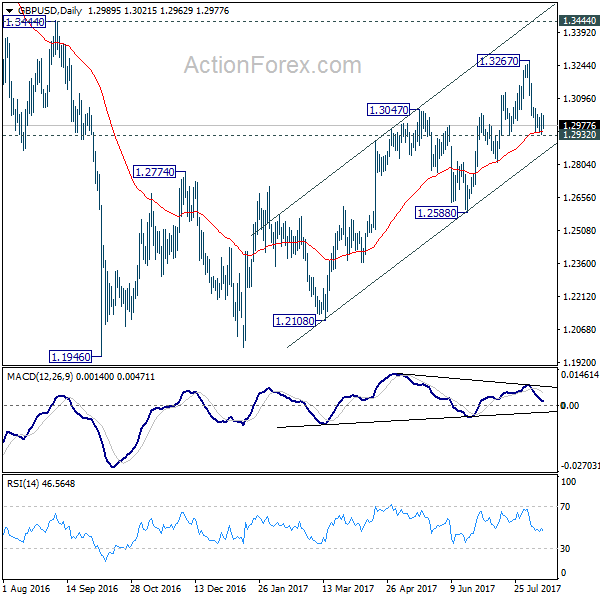
In the bigger picture, overall, price actions from 1.1946 medium term low are seen as a corrective pattern. While further rise cannot be ruled out, larger outlook remains bearish as long as 1.3444 key resistance holds. Down trend from 1.7190 (2014 high) is expected to resume later after the correction completes. And break of 1.2588 will indicate that such down trend is resuming.
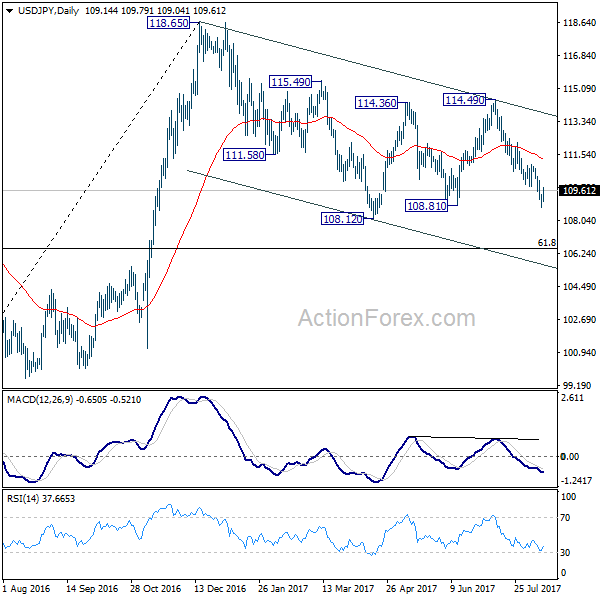
USD/JPY Mid-Day Outlook
Daily Pivots: (S1) 108.78; (P) 109.09; (R1) 109.46; More...
Intraday bias in USD/JPY remains neutral for consolidation above 108.72 temporary low. While further recovery might be seen, near term outlook remains bearish as long as 110.61 support turned resistance holds. And, deeper decline is still expected. Firm break of 108.81 support will resume whole corrective fall from 118.65 and target 61.8% retracement of 98.97 to 118.65 at 106.48.
In the bigger picture, the corrective structure of the fall from 118.65 suggests that rise from 98.97 is not completed yet. Break of 118.65 will target a test on 125.85 high. At this point, it's uncertain whether rise from 98.97 is resuming the long term up trend from 75.56, or it's a leg in the consolidation from 125.85. Hence, we'll be cautious on topping as it approaches 125.85. If fall from 118.65 extends lower, downside should be contained by 61.8% retracement of 98.97 to 118.65 at 106.48 and bring rebound.
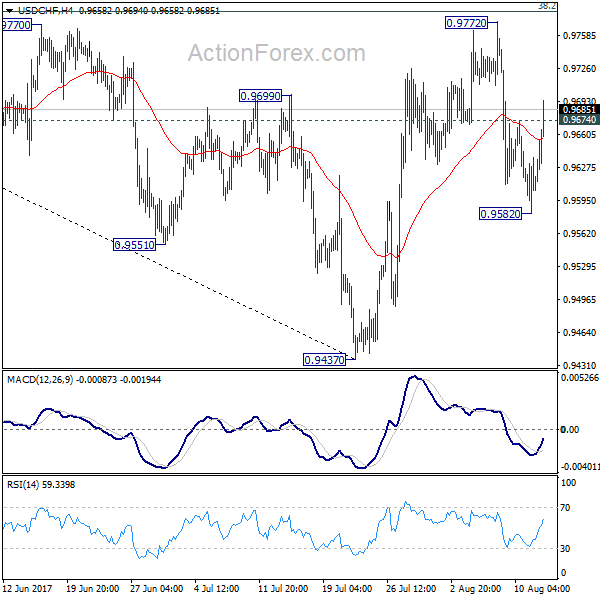
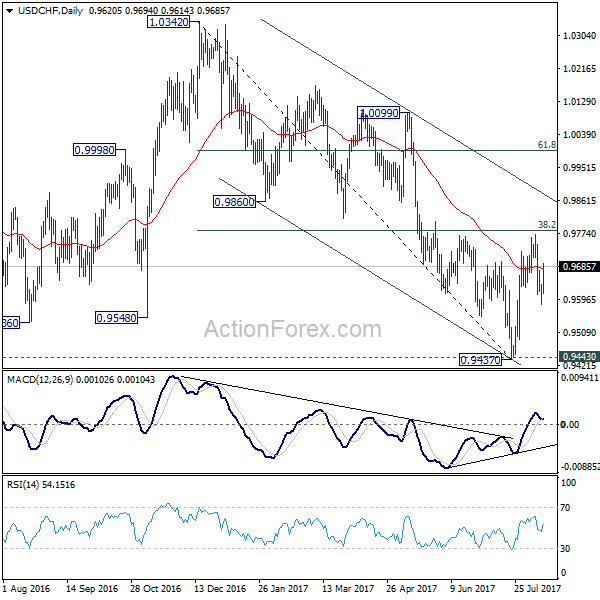
USD/CHF Mid-Day Outlook
Daily Pivots: (S1) 0.9585; (P) 0.9611; (R1) 0.9641; More...
USD/CHF's strong rebound and break of 0.9674 minor resistance argues that pull back from 0.9772 is completed at 0.9582 already. Intraday bias is turned back to the upside for 0.9772 first. Decisive break there will revive the bullish case of reversal. That is, whole decline from 1.0342 has completed at 0.9437 after defending 0.9443 support. However, the pair is bounded inside medium term falling channel and limited below 38.2% retracement of 1.0342 to 0.9437 at 0.9783 for the moment. Break of 0.9582 will dampen our bullish view and turn bias back to the downside for 0.9437. This could also extend the fall from 1.0342 through 0.9437/43 key support level.
In the bigger picture, current development argues that USD/CHF has successfully defended 0.9443 key support level. And long term range trading in 0.9443/1.0342 is extending with another rise. At this point, there is no sign of an up trend yet. Hence, while further rise is expected in USD/CHF, we'll start to be cautious on loss of momentum above 61.8% retracement of 1.0342 to 0.9437 at 0.9996. However, firm break of 0.9443 will carry larger bearish implication and would target next key support at 0.9072.
Global Markets Rebound, Taking Dollar Higher as US Officials Talk Down War Risks
Dollar rebounds broadly today while Yen and Swiss Franc lead the way down as risk aversion seems to have eased. US officials tried to talk down the risk of war with North Korea. European indices are trading generally in positive as FTSE is gaining 0.5% while DAX is is up 1.1%. US futures point to higher open where DOW might have triple digit gain. In other markets, Gold starts to feel heavy ahead of 1300 and dips back below 1290 today. WTI crude oil is struggling in tight range below 49. The US economic calendar is empty today. The immediate focus is that US President Donald Trump would order a broad probe of China's unfair trade practices today including intellectual property thefts.
US officials talk down war risks
U.S. Joint Chiefs of Staff Chairman Joseph Dunford met with South Korean Moon Jae-in for nearly an hour and assured Moon that US will only use military options against North Korea when diplomatic and economic sanctions fail. National Security Adviser H.R. McMaster said that "we're not closer to war than a week ago, but we are closer to war than we were a decade ago". Central Intelligence Agency Director Mike Pompeo said that "I've seen no intelligence that would indicate that we're in that place today" regarding the chance of a nuclear war.
South Korea President Moon: US will respond calmly and responsibly
South Korean President Moon Jae-in emphasized that "there must be no more war on the Korean peninsula". And he urged that "whatever ups and downs we face, the North Korean nuclear situation must be resolved peacefully." He also side "I am certain the United States will respond to the current situation calmly and responsibly in a stance that is equal to ours." South Korean Vice Defence Minister Suh Choo-suk said that "both the United States and South Korea do not believe North Korea has yet completely gained re-entry technology in material engineering terms."
Japan GDP grew fastest in more than two years
Japan GDP grew 1.0% qoq in Q2, much higher than expectation of 0.6% qoq, more than triple of Q1's 0.3% qoq. On annualized balance, GDP grew 4% in the period, much higher than Q1's 1.5% annualized. The quarterly rate was the fastest pace in more than two years. That's also the sixth straight quarter of expansion as recovery gathered steam. Strong domestic demand, which grew 1.3% qoq, is seen as an encouraging sign of the recovery while private consumption also grew 0.9%. That's more than enough to offset the -0.5% qoq fall in exports of goods and services. GDP deflator dropped less than expected by -0.4% yoy.
China data showed deeper slowdown
China retails sales grew 10.4% yoy in July, down from 11% a month ago. The market had anticipated a milder moderation to 10.8%. Industrial production expanded 6.4% yoy in July, decelerating from 7.6% in the prior month. The slowdown is much sharper than consensus. Urban fixed asset investment expanded 8.3% in the first 7 months of the year, slowing from 8.6% in the first half of the year. The market had anticipated a steady growth of 8.6%. The slowdown in economic activities in China has been widely expected as the government pledged to deleverage in at attempted to defend and prevent systematic risks. However the dataflow in July suggests that the slowdown came in deeper than expected.
Hammond and Fox published joint Brexit article
In UK, Chancellor of Exchequer Philip Hammond and International Trade Secretary Liam Fox released a joint article on Brexit over the weekend. They reiterated that UK will definitely leave EU in March 2019. And, they emphasized any trade deal will not be the "back door" to stay in EU. But they emphasized that a "time-limited" transition period would "further our national interest and give business greater certainty". One of the key takeaways from the article is that Hammond and Fox appeared to be trying to settle their differences regarding Brexit. And that raised the prospect of a more united cabinet on the issue.
New Zealand retail sales jumped on sporting events
New Zealand retail sales rose strongly by 2.0% qoq versus expectation of 0.7% qoq. Core retail sales rose 2.1% qoq, above expectation of 0.7% qoq. Sporting events were the main drivers in the strong growth. More than 28000 people attended the World Masters Game back in April. And there were 23000 visitors from UK and Ireland for the Lions rugby series in June. But these event driven figures won't alter RBNZ's neutral stance.
USD/CHF Mid-Day Outlook
Daily Pivots: (S1) 0.9585; (P) 0.9611; (R1) 0.9641; More...
USD/CHF's strong rebound and break of 0.9674 minor resistance argues that pull back from 0.9772 is completed at 0.9582 already. Intraday bias is turned back to the upside for 0.9772 first. Decisive break there will revive the bullish case of reversal. That is, whole decline from 1.0342 has completed at 0.9437 after defending 0.9443 support. However, the pair is bounded inside medium term falling channel and limited below 38.2% retracement of 1.0342 to 0.9437 at 0.9783 for the moment. Break of 0.9582 will dampen our bullish view and turn bias back to the downside for 0.9437. This could also extend the fall from 1.0342 through 0.9437/43 key support level.
In the bigger picture, current development argues that USD/CHF has successfully defended 0.9443 key support level. And long term range trading in 0.9443/1.0342 is extending with another rise. At this point, there is no sign of an up trend yet. Hence, while further rise is expected in USD/CHF, we'll start to be cautious on loss of momentum above 61.8% retracement of 1.0342 to 0.9437 at 0.9996. However, firm break of 0.9443 will carry larger bearish implication and would target next key support at 0.9072.
Economic Indicators Update
| GMT | Ccy | Events | Actual | Forecast | Previous | Revised |
|---|---|---|---|---|---|---|
| 22:45 | NZD | Retail Sales Q/Q Q2 | 2.00% | 0.70% | 1.50% | 1.60% |
| 22:45 | NZD | Core Retail Sales Q/Q Q2 | 2.10% | 0.70% | 1.20% | 1.50% |
| 23:50 | JPY | GDP Q/Q Q2 P | 1.00% | 0.60% | 0.30% | |
| 23:50 | JPY | GDP Deflator Y/Y Q2 P | -0.40% | -0.50% | -0.80% | |
| 2:00 | CNY | Retail Sales Y/Y Jul | 10.40% | 10.80% | 11.00% | |
| 2:00 | CNY | Fixed Assets Ex Rural YTD Y/Y Jul | 8.30% | 8.60% | 8.60% | |
| 2:00 | CNY | Industrial Production Y/Y Jul | 6.40% | 7.10% | 7.60% | |
| 9:00 | EUR | Eurozone Industrial Production M/M Jun | -0.60% | -0.50% | 1.30% | 1.20% |
Market Update – European Session: European Indices Kick Start The Week On Stronger Footing, As Geo-Political Tensions Subside
Notes/Observations
European Indices rise on easing Geo-Political tensions between the US and North Korea
China warns US there is no future in a trade war
Overnight
Asia:
Japan GDP rises at fastest pace in over 2 years with Domestic demand accounting for 1.3 percentage points.
US Trade representatives to investigate whether Chinese trade practices force US firms operating in China to turn over intellectual property
China Industrial production and Retail Sales falls short of expectations, with crackdown on property speculation and rising debt levels started to filter through
PBOC strengthened the yuan to the strongest setting since September 2016.
Europe:
UK Brexit Minister Davis urges talks with the EU to move onto next phase, beyond starter issues. Emphasizes the need to discuss bigger issues around the future of UK-EU partnership.
Eurozone Industrial production falls more than expectations. Only Energy showed a positive reading.
Banca Monte dei Paschi reports over a €3B loss as expected after intervention by the state. Italy now hows over 52% stake.
Americas:
Overnight Fed's Kashkari (Vote) noted the weak CPI readings in the US is another reason to holding off rate hikes.
Economic Calendar
(EU) EURO ZONE JUN INDUSTRIAL PRODUCTION M/M: -0.6% V -0.5%E; Y/Y: 2.6% V 2.8%E
(NL) Netherlands Jun Retail sales y/y: 4.7% v 5.8% prior
(IN) INDIA JULY WHOLESALE PRICES
(WPI) Y/Y: 1.9% V 1.4%E
(CH) SNB Total Sight Deposits for week ending Aug 11th
(CHF): 578.9B v 578.6B prior
(SE) Sweden Jun Household Consumption M/M: 0.0% v 0.3% prior; Y/Y: 2.4% v 2.8% prior
(CZ) Czech Jun Current Account
(CZK): -14.5B v -3.0Be
Fixed Income Issuance:
Non seen
SPEAKERS/FIXED INCOME/FX/COMMODITIES/ERRATUM
Equities
Indices [Stoxx50 1.1% at 3,441, FTSE +0.6% at 7,347, DAX +1.1% at 12,141, CAC-40 +1.0% at 5,110, IBEX-35 +1.2% at 10,409, FTSE MIB +0.9% at 21,556, SMI +1.2% at 8,995, S&P 500 Futures +0.6%]
Market Focal Points/Key Themes: European stocks open slightly higher and gain substantially as the session progressed; easing geopolitical concerns help support risk sentiment; all sectors moving higher, lead by financials; automakers also outperforming; oil price dipped, but didn't drag on energy stocks enough to pull them negative; tomorrow sees several European markets closed due to holiday; upcoming earnings in the US session include Sysco and Canadian Solar.
Equities
Consumer discretionary: Danone BN.FR +1.5% (bid speculation), Berentzen BEZ.DE -12.2% (results)
Materials: Wienerberger WIE.AT +3.2% (analyst action)
Industrials: SMT Scharf S4A.DE +1.9% (results), Hamburger Hafen HHFA.DE +2.7% (earnings), Gesco GSC1.DE +2.8% (earnings)
Financials: Deutsche Pfandbriefbank PBB.DE +4.58% (results), Talanx TLX.DE +1.6% (earnings)
Technology: Rocket Internet RKET.DE +5.8% (buyback)
Telecom: Telit Communications TCM.UK +13.7% (confirms CEO departure)
Healthcare: UDG Healthcare UDG.UK -2.8% (analyst action)
Energy: RWE RWE.DE +1.6% (earnings)
Speakers
(CN) China Foreign Ministry: No future in a China/US trade war
Currencies
The USD gains ground this morning as GBPUSD drops back below 1.30, while the EURUSD approaches the 1.17 handle coming off the 1.1840 high. Continued downside targets 1.1750. Overall Equity strength has helped the USDYEN firmer, rebounding over 100 pips from Friday lows.
Fixed Income
Bund futures trades at 163.96 down 61 ticks, after breaking below key support at the 164.01 level. Downside targets 163.75 followed by 162.56. To the upside the 165.00 to 165.20 remains key resistance.
Gilt futures trades at 127.70 down 17 ticks, steadily flattened over last week. A resumption to the upside could eye 128.25 then 128.75. A move back below 126.51 targets 125.97
Monday's liquidity report showed Friday's use of the marginal lending facility rose to €189M from €116M prior.
Corporate issuance saw $43B last week with talk that this week could see between $30B coming to market, as we enter the back half of earning season.
Looking Ahead
06:00 (PL) Poland Q2 Labour Costs
07:25 (BR) Brazil Weekly Economist Survey
07:30 (TR) Turkey TCMB Survey of Expecations
08:00 (PL) Poland July CPI Core M/M: 0.0%e v 0.0% prior; Y/Y: 0.8%e v 0.8% prior
08:00 (IN) India July CPI Y/Y: 2.0%e v 1.5% prior
08:30 (CA) Canada July Teranet/National Bank HPI M/M: No est v 2.6% prior; Y/Y: No est v 14.2% prior
09:00 (BE) Belgium trade balance
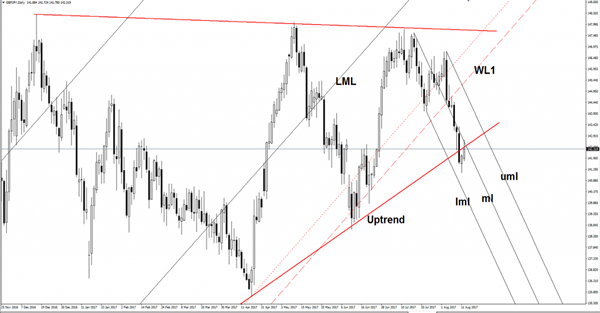
GBP/JPY Selling Opportunity?
Price rebounded and now is retesting the broken red uptrend line, a valid breakdown will validate a further drop. Technically is expected to drop further after the failure to reach the down red sloping line and to stay above the warning line (WL1). A further drop will be confirmed if will decrease again after the minor rebound. Will drop quickly if will stay below the median line (ml) of the minor descending pitchfork.