Sample Category Title
EUR/USD Elliott Wave Analysis
EUR/USD – 1.1795
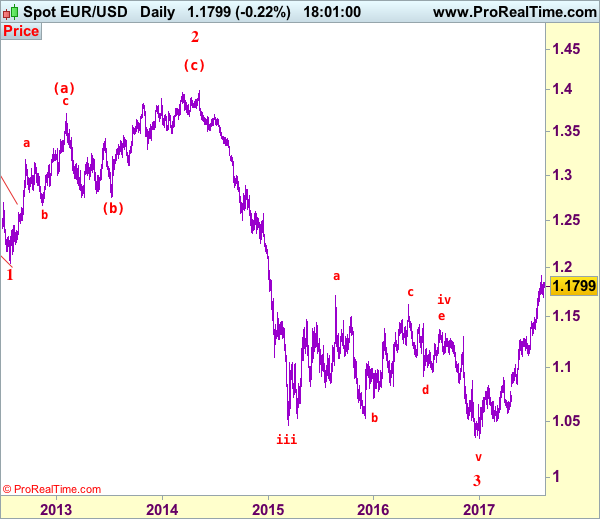
EUR/USD: Wave (c) of 2 ended at 1.3993 and wave 3 of III has commenced for weakness to 1.0411 (1.236 of wave 1), then 1.0000.
The single currency found support at 1.0689 last week and has rebounded, however, break of recent high at 1.1910 is needed to confirm medium term rise from 1.0340 (wave 3 trough) to 1.1950, then 1.2000-10, break there would encourage for further gain in wave 4 to 1.2100 but price should falter well below 1.2220-30, bring retreat later this month.
Our preferred count on the daily chart remains that a wave (II) from 1.2329 ended at 1.5145 with A-leg ended at 1.4720, followed by wave B at 1.2457, the wave C from there was also a 3 legged move and is labeled as (a): 1.3739, (b): 1.2885, the wave iii of the 5-waver (c) from 1.2885 has ended at 1.4339 and wave iv is a triangle ended at 1.3878 and wave v formed a top at 1.5145. The decline from there is a 5-waver (C) with minor wave (i) of I of (C) ended at 1.4218 with wave (ii) ended at 1.4580, wave (iii) ended at 1.3267 and wave (iv) ended at 1.3692 and wave (v) ended at 1.1876, this is also the low of wave I of (C) and wave II ended at 1.4940, hence wave III is now in progress with a diagonal wave 1 ended at 1.2042, the breach of previous support at 1.1876 (wave I trough) adds credence to our view that the wave 2 has ended at 1.3993, wave 3 has commenced for further weakness to 1.0411, then towards 1.0000.
On the downside, if said resistance at 1.1910 remains intact, risk of another corrective fall remains, below said support at 1.0689 would bring weakness to 1.1650, then towards support at 1.1613, however, reckon downside would be limited to previous resistance at 1.1583 and price should stay well above support at 1.1479, bring another upmove later.
Recommendation: Buy at 1.1600 for 1.1800 with stop below 1.1500
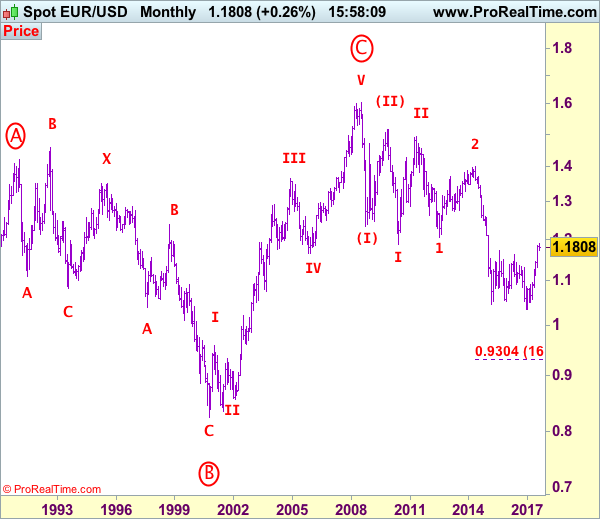
Euro's long-term uptrend started from 0.8228 (26 Oct 2000) with an impulsive structure. The rise from 0.8228 to 0.9593 (5 Jan 2001) is labeled as wave I, the retreat to 0.8352 (6 Jul 2001) is wave II and the rally to 1.3670 (31 Dec 2004) is wave III. Wave IV from there ended at 1.1640 (15 Nov 2005), the subsequent upmove to 1.6040 (July 15, 2008) is treated as wave V, the major selloff from the record high of 1.6040 to 1.2329 (October 27, 2008) signals a reversal has taken place with (I) leg ended at 1.2329 and once (II) ended at 1.5145, wave (III) itself is an extended move with I: 1.1876 and complex wave II ended at 1.4902, wave III has commenced with wave 1 and 2 ended at 1.2042 and 1.3993 respectively, wave 3 of III is now unfolding for weakness towards parity.
USD/JPY Elliott Wave Analysis
USD/JPY - 109.69
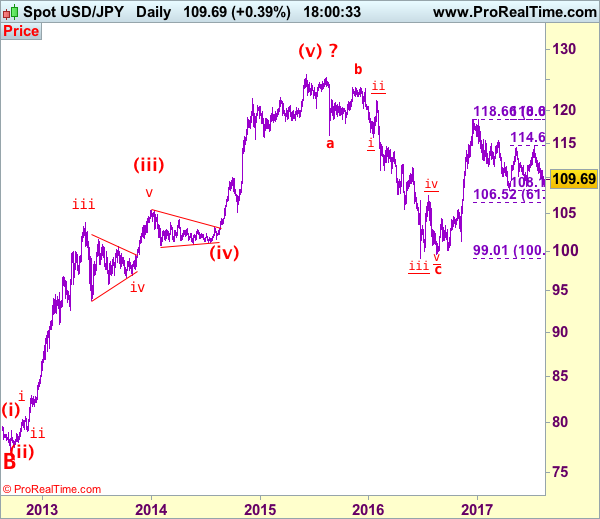
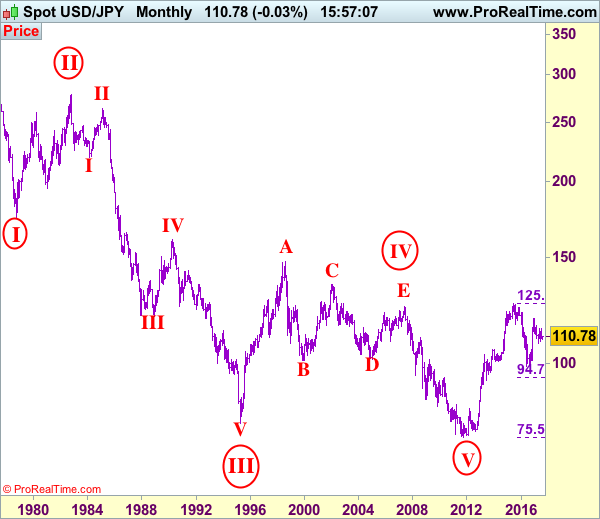
USD/JPY – Wave V of larger degree circle V has possibly ended at 75.31 and major correction has commenced and already met indicated target at 125.00.
Although the greenback broke briefly below indicated previous support at 18.82, lack of follow through selling and current rebound suggest minor consolidation would be seen and corrective bounce to 110.15-20 and then 110.55-60 is likely, however, reckon resistance at 111.05 would limit upside and bring another decline, below last week’s low at 108.73 would extend recent decline from 114.50 to previous chart support at 108.13. Looking ahead, only a break below this 2017 low at 108.13 would confirm early fall from 118.66 top has resumed and extend decline to 107.50, then 107.00 but reckon 106.50-55 (61.8% Fibonacci retracement of 99.01-118.66) would hold from here.
Our preferred count is that, triangle wave IV (with circle) ended at 101.45 and the circle wave V brought dollar down to the record low of 75.31 in 2011 and the subsequent rebound signal major correction has commenced with A leg ended at 84.19, followed by wave B at 77.14 and impulsive wave C is now unfolding (indicated upside target at 125.00 had been met) for gain towards 127.00 level. In the event dollar drops below support at 99.01, this would confirm medium term decline from 125.86 top (2015 high) has resumed for subsequent weakness to 98.00 and possibly 97.00.
Under this count, this wave C is unfolding as impulsive waves with (1) (2), 1 2 ended at 80.67, 79.07, 82.84 and 81.69 respectively, hence the extended wave 3 has ended at 103.74 and wave 4 correction of recent upmove should bring weakness to 92.57, then towards 90.88 but psychological support at 90.00 should limit downside and bring another rally later in wave 5, indicated target at 125.00 had been met and gain to 127.00 cannot be ruled out but reckon price would falter below 130.00.
On the upside, whilst initial recovery to 110.20-30 cannot be ruled out, reckon upside would be limited to resistance at 111.05 and bring another decline. Only a daily close above resistance at 112.20 would defer and signal the first leg of decline from 114.50 has ended instead, bring a strong rebound to 112.85-90 but resistance at 113.58 should cap upside, bring another selloff later.
Recommendation: Sell again at 111.00 for 109.00 with stop above 112.00.
On the monthly chart, we have changed our preferred count that an impulsive wave is unfolding with major wave III with circle ended at 79.75, then followed by wave IV with circle and is labeled as a triangle with A: 147.64 (11 August, 1998), B: 101.25, C: 135.20, D: 101.67 and E leg ended at 124.14 to end the wave IV with circle. Hence, wave V with circle commenced from there and hit a record low of 75.31, however, the subsequent strong rebound signals this circle wave V has possibly ended there, hence gain to (indicated upside target at 122.00 and 125.00 had been met), the retreat from 125.86 suggests wave A of major correction has ended there and wave B correction back to 99.00, then 95.00 would be seen, however, reckon downside would be limited to 90.00, bring another rebound in wave C next year.
AUD/USD Growing Selling Pressures
AUD/USD's short-term technical structure is bearish. Hourly support can be found at 0.7786 (18/07/2017 low) has been broken. Hourly resistance is given at 0.8066 (27/07/2017 high) . Expected to show continued decline.
In the long-term, we are waiting for further signs that the current downtrend is ending. Key supports stand at 0.6009 (31/10/2008 low) . A break of the key resistance at 0.8295 (15/01/2015 high) is needed to invalidate our long-term bearish view.
USD/CAD Short-Term Bullish Momentum Continues
USD/CAD's short-term bullish momentum continues. The road is wide open for further increase. Hourly support is given at a distance at 1.2414 (27/07/2017 low). Expected to show continued increase.
In the longer term, the pair has broken longterm support that can be found at 1.2461 (16/03/2015 low) before bouncing back. Strong resistance is given at 1.4690 (22/01/2016 high). The pair should head further lower.
USD/CHF Edging Higher
USD/CHF is pushing higher. Resistance is given at at 0.9771 (15/06/2017 high). Hourly support lies at at 0.9584 (08/11/2017 low). Expected to to show further downside pressures towards 0.9500.
In the long-term, the pair is still trading in range since 2011 despite some turmoil when the SNB unpegged the CHF. Key support can be found 0.8986 (30/01/2015 low). The technical structure favours nonetheless a long term bullish bias since the unpeg in January 2015.
USD/JPY Bouncing After Breaking 108.83
USD/JPY has bounced back after the pair broke support at 108.83 (17/04/2017 low). The pair is still located within downtrend channel. Expected to show further downside pressures.
We favor a long-term bearish bias. Support is now given at 96.57 (10/08/2013 low). A gradual rise towards the major resistance at 135.15 (01/02/2002 high) seems absolutely unlikely. Expected to decline further support at 93.79 (13/06/2013 low).
GBP/USD Pausing Above Support At 1.2933
GBP/USD is now trading sideways. Hourly resistance is given at 1.3267 (03/08/2017 high). Hourly support is given at 1.2933 (20/07/2017 low). Expected to show further monitoring of support at 1.2933.
The long-term technical pattern is even more negative since the Brexit vote has paved the way for further decline. Long-term support given at 1.0520 (01/03/85) represents a decent target. Long-term resistance is given at 1.5018 (24/06/2015) and would indicate a long-term reversal in the negative trend. Yet, it is very unlikely at the moment.
EUR/USD Renewed Upside Pressures
EUR/USD bullish pressures are still on despite ongoing consolidation. Hourly resistance is given at 1.1910 (02/08/2017 high). Hourly support can be found at 1.1689 (09/08/2017 high). Stronger support lies at 1.1613 (26/07/2017 low). Expected to show continued bullish pressures.
In the longer term, the momentum is now turning largely positive. We favour a continued bullish bias. Key resistance holding at 1.1871 (24/08/2015 high) has been broken while strong support lies at 1.0341 (03/01/2017 low).
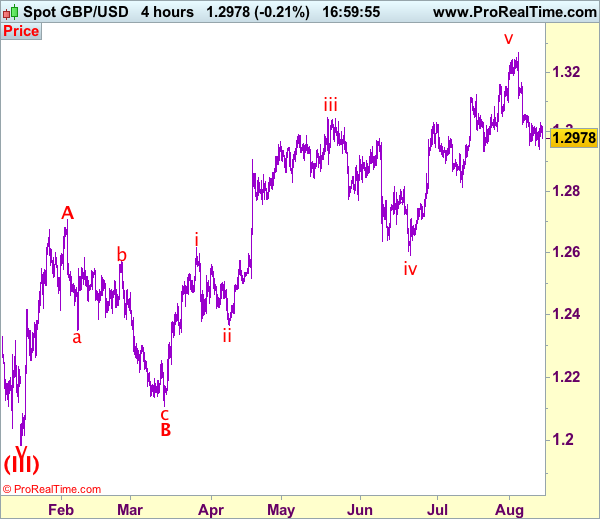
Trade Idea: GBP/USD – Sell at 1.3055
GBP/USD – 1.2973
Recent wave: Wave V of larger degree wave (III) has ended at 1.1986 and major correction has commenced from there for gain to 1.3000 and 1.3140-50
Trend: Near term up
Original strategy :
Sell at 1.3055, Target: 1.2860, Stop: 1.3115
Position: -
Target: -
Stop: -
New strategy :
Sell at 1.3055, Target: 1.2860, Stop: 1.3115
Position: -
Target: -
Stop:-
As cable rebounded after marginal fall to 1.2940 on Friday, suggesting minor consolidation above this level would be seen and another corrective bounce to 1.3030-35 is likely, however, reckon resistance at 1.3059 would limit upside and bring another decline later, below said support at 1.2933-40 would extend recent decline from 1.3269 top for retracement of early upmove, hence further weakness to 1.2890-00 and possibly towards 1.2850-60 but previous support at 1.2812 would hold from here, bring another rebound later.
In view of this, would not chase this fall here and would be prudent to sell cable on subsequent recovery as resistance at 1.3059 should limit upside and bring another decline. Only above previous support at 1.3112 (now resistance) would abort and signal the fall from 1.3269 has ended instead, bring a stronger rebound to indicated resistance at 1.3165 first.
Our preferred count on the daily chart is that cable's rebound from 1.3500 (wave (A) trough) is unfolding as a wave (B) with A ended at 1.7043, followed by triangle wave B and wave C as well as wave (B) has ended at 1.7192, the subsequent selloff is the larger degree wave (C) which is still unfolding with minor wave (III) of larger degree wave 3 ended at 1.1986, hence wave (IV) correction is in progress which could either be a triangle wave (IV) of a complex formation but upside should be limited to 1.3500 and price should falter well below 1.4000, bring another decline in wave (V) of 3 for weakness to 1.1500, then 1.1200.
Trade Idea: GBP/JPY – Hold short entered at 142.50
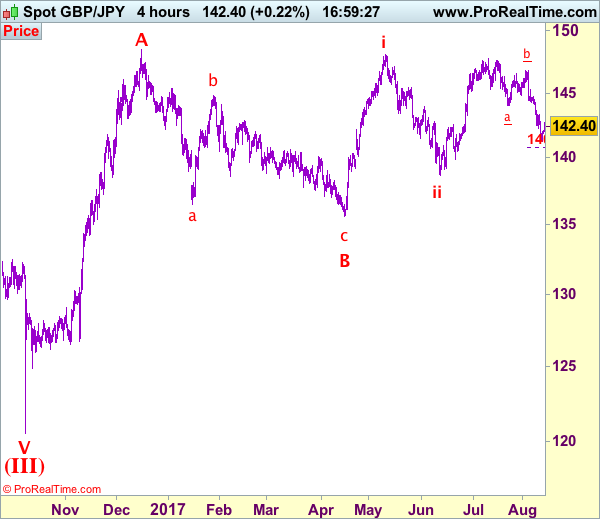
GBP/JPY - 142.33
Recent wave: Medium term low formed at 120.50 and (A)-(B)-(C) major correction has commenced with (A) leg ended at 148.45, hence wave (B) is unfolding for retreat to 131.00-10.
Trend: Near term down
Original strategy:
Sold at 142.50, Target: 140.50, Stop: 143.10
Position: - Short at 142.50
Target: - 140.50
Stop: - 143.10
New strategy :
Hold short entered at 142.50, Target: 140.50, Stop: 142.80
Position: - Short at 142.50
Target: - 140.50
Stop:- 142.80
Although sterling found support at 141.25 on Friday and staged a rebound, reckon upside would be limited to 142.75-80 and bring another decline, below 141.80-85 would bring retest of said support at 141.25 but break there is needed to confirm recent decline has resumed and extend recent decline from 147.75 top for retracement of early upmove to 140.80-85 (1.618 times projection of 147.75-144.05 measuring from 146.80), however, oversold condition should prevent sharp fall below 140.50 and reckon psychological support at 140.00 would hold from here.
In view of this, we are holding on to our short position entered at 142.50. Above 142.80 would defer and risk a stronger rebound to indicated resistance at 143.30, however, a sustained breach above this level is needed to signal a temporary low is formed, bring further subsequent gain towards 143.90-00.
Our preferred count is that larger degree wave V with circle is unfolding from 251.12 with wave (I) 219.34, (II): 241.38 and wave (III) is subdivided into 1: 192.60, 2: 215.89 (23 Jul 2008) and wave 3 ended at 118.87 earlier in 2009. The correction from there to 162.60 is wave 4 which itself is a double three and is labeled as first a-b-c ended at 151.53, followed by wave x at 139.03, 2nd a ended at 162.60, 2nd b at 146.75 and 2nd c leg of wave 4 ended at 163.00. Therefore, the decline from 163.00 to 116.85 is now treated as wave 5 which also marked the end of larger degree wave (III), hence wave (IV) major correction has commenced for retracement of the wave (III) from 241.38 and upside target at 183.95-00 (50% Fibonacci retracement of the wave (II) from 241.38) had been met, a drop below 160.00 would suggest wave (IV) has ended at 195.85, bring decline in wave (V) for initial weakness to 130 (already met) and 120.