
Sample Category Title
Forex Markets’ Reaction Muted On Economic Data, Dollar On Rise
Forex markets have had a muted reaction to the released economic data during the Asian session. The yen weakened against the greenback despite an upbeat string of figures out of Japan and still ongoing tensions between the US and North Korea. The aussie softened only modestly against its US counterpart even though Chinese data were disappointing.
Japan's economy annually grew 4% in the second quarter, preliminary data released today showed. This is the fastest pace of expansion since the first quarter of 2015 and it was much better than the expected rate of 2.5% and a pick up from the upwardly revised figure for the quarter to March-end of 1.5%. The economy expanded 1%, q/q as private consumption picked up. This was also better than the expected 0.5% and above the upwardly revised figure for the prior quarter of 0.4%. Despite such an upbeat set of data out of Japan, the yen weakened against the dollar for the pair to last trade at 109.56.
Yen's appeal as a safe haven asset in times of uncertainty such as the tensions between the US and North Korea pushed the currency up against the dollar during last week. As there are no signs of the tensions going away any time soon, yen's weakness seems muted to these events. In addition, the greenback recovered during today's session after it tumbled to 108.72 yen hit on Friday, its lowest since April 19, due to the disappointing inflation figures.
The aussie, which is considered a good proxy for the outlook on China's economy, pulled back after the latest industrial production figures out of China today, though only modestly. At 6.4% annual expansion, the production tempered in July, coming in below the 7.2% expected level and 7.6% recorded in the prior month. Retail sales in China in July also rose less than expected. Aussie/dollar fell to 0.7885 ahead of the European session, though the pair held above Friday's low of 0.7839, which was its lowest since July 18.
The euro gained against the dollar to trade at $1.1834 ahead of European trading. Other than industrial production figures for the eurozone for July, no other significant economic data is expected today. Sterling also gained against the dollar with pound/dollar last trading at 1.3016.
Gold weakened during the Asian session, erasing Friday's gains. The precious metal was trading at $1,268.60 an ounce ahead of the European session.
Oil prices fell linked to cooling refining activity in China and concerns that US shale output is on the rise. WTI was last trading at $48.68 a barrel while Brent was at $51.90.
EUR/USD Candlesticks and Ichimoku Analysis
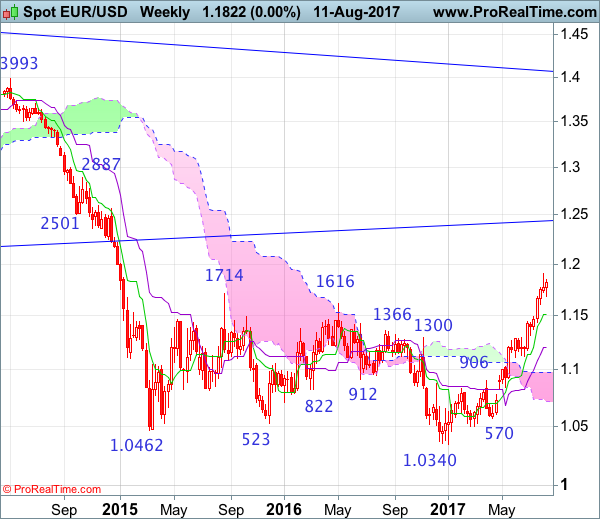
Weekly
• Last Candlesticks pattern: Shooting star
• Time of formation: 31 Jul 2017
• Trend bias: Near term up
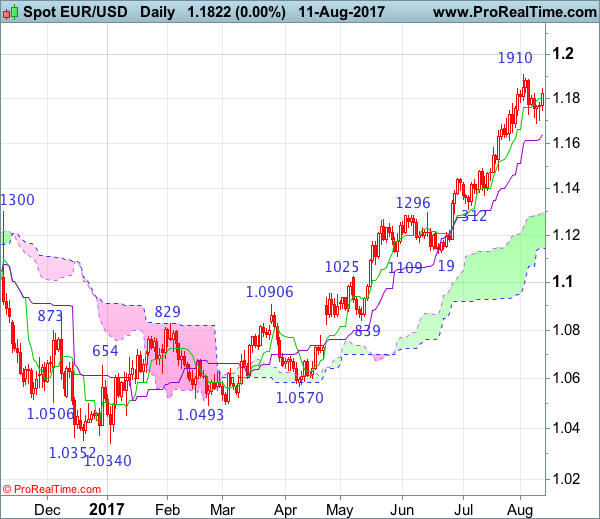
Daily
• Last Candlesticks pattern: Shooting star
• Time of formation: 2 Aug 2017
• Trend bias: Up
EUR/USD – 1.1800
Although the single currency found support at 1.1689 last week and has rebounded, as long as recent high at 1.1910 holds, further consolidation would take place and near term downside risk remains for another corrective fall, below said support at 1.1689 would bring retracement of recent rise to the Kijun-Sen (now at 1.1640), then towards 1.1590-00, however, reckon 1.1540-45 would contain correction and bring another rise later. Above said resistance at 1.1910 would signal recent upmove from 1.0340 low has resumed and extend headway to 1.1950, then psychological level at 1.2000, having said that, loss of upward momentum should prevent sharp move beyond 1.2165 and price should falter below 1.2220-30, bring retreat later.
On the downside, expect pullback to be limited to 1.1590-00 and bring another rise. Below 1.1540-45 would defer and risk test of 1.1490 (previous resistance turned support), a daily close below there would signal a temporary top is formed instead, bring retracement of recent rally to 1.1435, then 1.1390-00, however, still reckon downside would be limited to 1.1350 and price should stay above support at 1.1312.
Recommendation: Buy at 1.1590 for 1.1790 with stop below 1.1490.
On the weekly chart, although the single currency formed a shooting star on the weekly chart after retreating from recent high of 1.1910, as a black candlestick did not materialize last week, suggesting minor consolidation would be seen, however, as long as said resistance holds, prospect of another corrective fall remains, below 1.1689 support would bring minor correction to 1.1613 support but break there is needed to suggest a temporary top is formed, bring retracement of recent upmove to the Tenkan-Sen (now at 1.1515) and later towards 1.1435, having said that ,downside should be limited to 1.1370 and support at 1.1312 should remain intact, bring rebound later.
On the upside, expect recovery to be limited to said resistance at 1.1910 and bring another retreat later. A break above said recent high at 1.1910 would signal the major rise from 1.0340 low is still in progress and may extend gain to 1.1950, then 1.1200, however, weakening of near term upward momentum would prevent sharp move beyond 1.2160-70 and reckon 1.2220-30 would hold, price should falter below 1.2300-10, bring another retreat later.
‘
China’s July Activities Disappoint, Further Slowdown Expected As Monetary Policy Gets Tighter
Chinese macroeconomic activities showed sharper than expected slowdown in July. Retails sales grew +10.4% y/y in July, down from +11% a month ago. The market had anticipated a milder moderation to +10.8%. Industrial production expanded +6.4% y/y in July, decelerating from +7.6% in the prior month. This came in weaker than consensus of +7.1%. Urban fixed asset investment expanded +8.3% in the first 7 months of the year, slowing from +8.6% in the first half of the year. The market had anticipated a steady growth of +8.6%. The slowdown in economic activities in China has been widely expected as the government pledged to deleverage in at attempted to defend and prevent systematic risks. However the abovementioned three major indicators came in even weaker than expectations. We expect Chinese economic growth to moderate in the second half of the year. Yet, the strength in the first half (GDP growth: +6.9%) signals that the government's full year target of 'around +6.5%' should be able to achieved.
In the second quarter monetary policy report published last Friday, PBOC reiterated its stance to maintain a 'prudent and neutral' monetary policy. At the twice a decade National Financial Work Conference held last month, the post-meeting statement omitted the word of 'neutral'. This triggered speculations that China's monetary policy would be skewed more to the tightening side in the coming years. Indeed, PBOC drained a net RMB 30B from the market via the reverse repo agreements, following a net drain of RMB 40B in the prior week. Reuters' data showed that the volume-weighted average rate of the benchmark 7-day repo settled at 2.8373% last Friday, up +5 bps from the close in the prior week.
In his first appearance in the Work Conference, President Xi Jinping announced the establishment of a Financial Stability and Development Committee, an office stemming from PBOC with the objective of overseeing stability and the developments of the financial market. The power of the Committee is above the three existing regulators, namely the China Insurance Regulatory Commission (CIRC), the China Securities Regulatory Commission (CSRC), and the The China Banking Regulatory Commission (CBRC). Establishment of the new Commission also reflects the lack of execution capability of these three traditional agencies.
Reiterating President Xi's comments, PBOC at the monetary policy report noted that the monetary policy would focus on 'deleveraging' and to reform the financial sector to serve the real economy while guarding against systemic risks. The central bank suggested that the move might result in a lower growth in the M2 money supply.
Leveraging to Deleveraging
Over the past years, financial institutions, including banks, in China have developed a variety of highly-leveraged products (interbank deposits, off-balance sheet finance, etc.). It was estimated that China's total debt soared to almost 300% of GDP, while total corporate debt increased to about 170% of GDP, last year. More importantly, over half of the corporate debt came from state-owned enterprises (SOEs) which contributed only 22% of GDP. The lack of contribution to the real economy, accompanied by huge debts, is the key reason for Xi's command to deleverage to SOEs. Another area of focus in China's deleveraging activities is on 'vampire companies' which are subsidized by local governments and certain banks, despite their lack of productivity. The debt problems in local governments have become so serious that the central authority proposed a lifetime accountability system for local government debts.
Renminbi
PBOC pledged to maintain a stable and two-way movement in its currency. The central bank affirmed that the 'counter-cyclical factor' introduced in May would help reduce the renminbi's volatility. Yet, we believe the lack of transparency of the components in the factor is a detriment to the internationalization of renminbi. The recent rally of renminbi against the US dollar is more due to weakness in the latter, though.
USD/JPY Candlesticks and Ichimoku Analysis
Weekly
• Last Candlesticks pattern: Dark cloud cover
• Time of formation: 10 Jul 2017
• Trend bias: Down
Daily
• Last Candlesticks pattern: Evening doji
• Time of formation: 7 Aug 2017
• Trend bias: Down
USD/JPY – 110.65
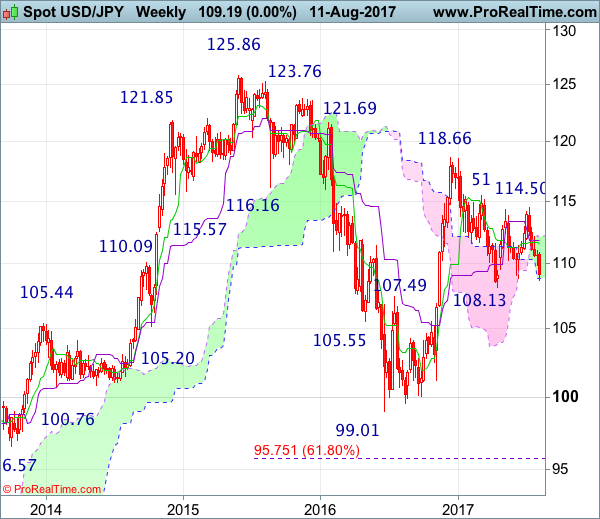
Although several hammer bullish reversal patterns were formed on the daily chart along recent selloff from 114.50 (some even followed by a long white candlestick), the greenback managed to ignore all these signs and continued heading south, suggesting bearishness remains for a test of previous support at 108.13 (this year’s low), however, break there is needed to retain bearishness and signal early decline from 118.66 top has indeed resumed and extend weakness to 107.50, then towards 106.50-55 (61.8% Fibonacci retracement of 99.01-118.66), having said that, near term oversold condition should prevent sharp fall below there and reckon previous resistance at 105.53 would hold from here.
On the upside, whilst initial recovery to the Tenkan-Sen (now at 109.90), then 110.70 is likely, reckon upside would be limited to resistance at 111.05 and bring another decline later. A daily close above the Kijun-Sen (now at 111.62) would defer and suggest a temporary low is formed instead, risk a stronger rebound to resistance at 112.20 but reckon upside would be limited to 112.40-45 and price should falter well below 113.00, bring another selloff later this month.
Recommendation : Sell again at 111.00 for 109.00 with stop above 112.00.

On the weekly chart, despite forming a doji star the week before, dollar failed to form a white candlestick last week and has dropped another (ended with another black candlestick), suggesting the selloff from 114.50 is still in progress, hence bearishness remains for another test of previous chart support at 108.13 (2017 low), however, the pair needs to penetrate this level to confirm early fall from 118.66 top has resumed and extend weakness to 117.40-50, then 117.00 but downside should be limited to 106.50-55 (61.8% Fibonacci retracement of 99.01-118.66) and previous resistance at 105.53 would turn into support, price should stay above 105.00, bring rebound later.
On the upside, although initial recovery to 110.00, then 110.50-60 cannot be ruled out, reckon resistance at 111.05 would limit upside and bring another decline later. Above the Tenkan-Sen (now at 111.62) would risk test of the Kijun-Sen (now at 111.82) but still reckon resistance at 112.20 would limit upside and bring another decline. A weekly close above resistance at 112.20 would suggest first leg of decline from 114.50 has ended instead, risk a stronger rebound to 112.90-00 but still reckon upside would be limited to 113.55-60 and price should falter well below resistance at 114.50, bring another decline later.
USDJPY Intraday Analysis
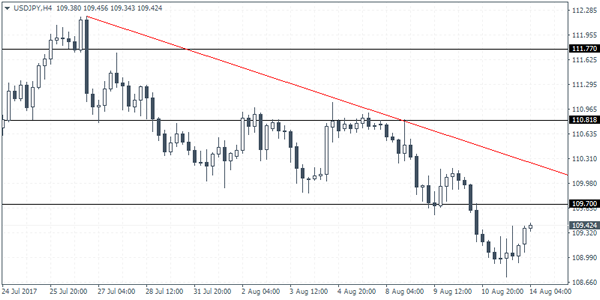
USDJPY (109.42): The USDJPY closed on Friday with a near doji candlestick pattern after breaking down below 109.58. Any retracements will come only on a strong rebound back above the 109.58 levels. On the 4-hour chart, the near-term resistance level is seen at 109.70. Therefore, any meaningful retracement can be expected only on a breakout above this level. For the moment, any downside is likely to be limited to the current level which was previously tested in early June this year.
GBPUSD Intraday Analysis
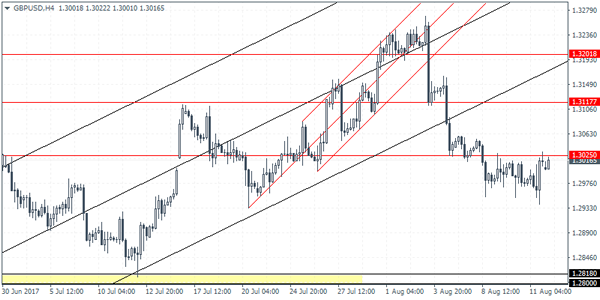
GBPUSD (1.3016): The British pound will be heading into a busy week. As expected price action rallied back to retest the resistance level at 1.3025. This near term pullback will suggest that price action could be looking to post a reversal. Friday's gains saw GBPUSD close with an outside bar. However, on the 4-hour chart, the reversal is currently taking shape. This would suggest a near-term decline. Support at 1.2818 remains in focus for the cable. Alternately, a breakout above 1.3025 will send the currency pair back to retest the next upper resistance level at 1.3117.
EURUSD Intraday Analysis
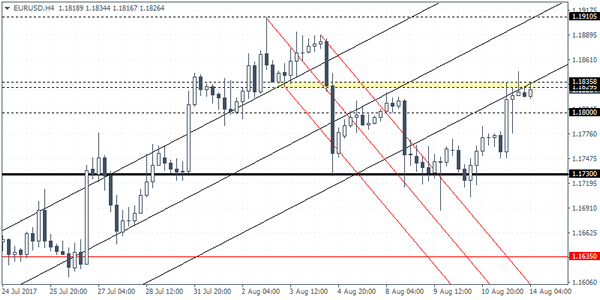
EURUSD (1.1826): The euro posted strong gains on Friday after briefly trading flat the previous two days. The currency pair managed to rally back above the 1.1800 level and thus broke above this short-term support/resistance level. The rally towards 1.1835 and the prompt pullback on the day suggests that we could see some near-term consolidation. Support is seen at 1.1730 which is likely to be the range that the EURUSD could move into. Unless the FOMC meeting minutes this week turn out to be strongly hawkish, no major new gains are expected in the EURUSD. Watch for a break out above 1.1835, in which case, we can expect further gains towards 1.1900, while to the downside a break down below 1.1730 would suggest a decline to 1.1635.
Weaker CPI Keeps The US Dollar Subdued
The US inflation data for July was disappointing as data showed that consumer prices rose 0.1% on the month. This was below the forecasts of a 0.2% increase. However, on a year over year basis, consumer prices were seen rising 1.7% in July. This is slightly higher than June's 1.6%.
In the backdrop, the US - North Korea narrative continues to be the main theme. Investors continued to scale back their risky bets, as a result sending the safe haven currencies and assets higher. However, the markets were seen opening on an optimistic note earlier today.
Earlier in the day, Japan's GDP data showed a 1.0% increase in economic activity on a quarterly basis. This was stronger than the forecasts of a 0.6% increase that was penciled in by economists. On a year over year basis, Japan’s GDP has advanced 4.0%, beating estimates of a 2.5% increase and accelerated from the 1.5% increase registered during the first quarter.
Looking ahead, the economic calendar is light today with only the Eurozone industrial production numbers coming up. Forecasts point to a 0.4% decline.
Daily Technical Analysis: EUR/USD Decision Zone At 1.19: ABC Zigzag Or Uptrend
Currency pair EUR/USD
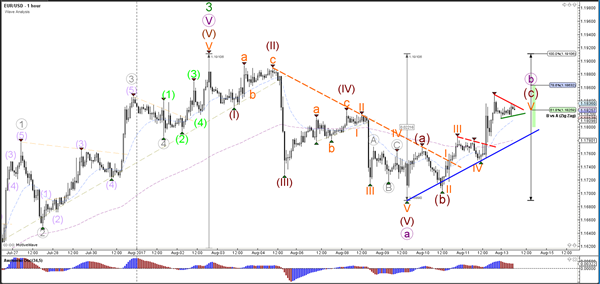
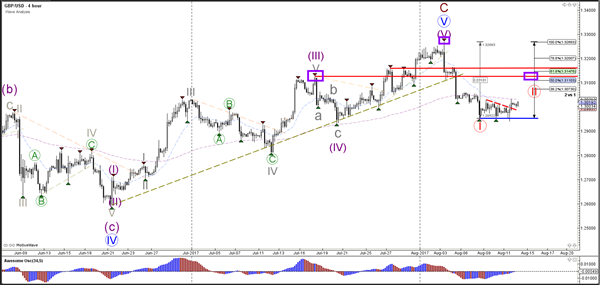
The EUR/USD divergence between the tops (purple line) could create a larger bearish retracement via an ABC correction (purple). A break of the top and 100% Fibonacci level of wave B vs A at 1.1910 could indicate an uptrend continuation.
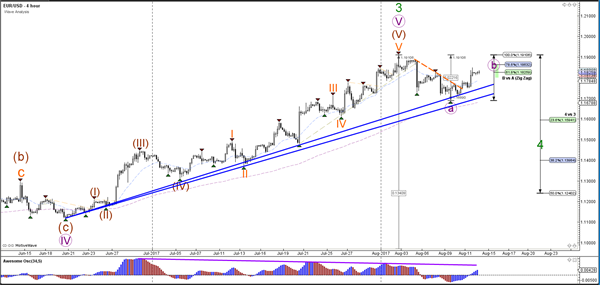
The EUR/USD potential break above the resistance (red) of the triangle chart pattern could see price move towards the next 78.6% Fibonacci level of wave B vs A whereas a break below support (green/blue) could see price complete wave B (purple) and start wave C.
Currency pair USD/JPY
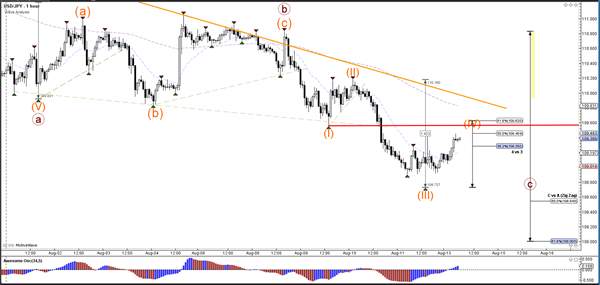
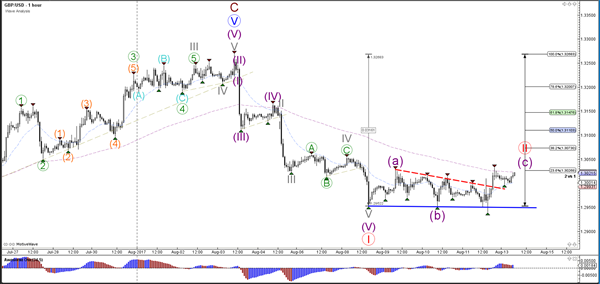
The USD/JPY broke below the support trend line (blue) and could be building a downtrend continuation within wave C (brown).
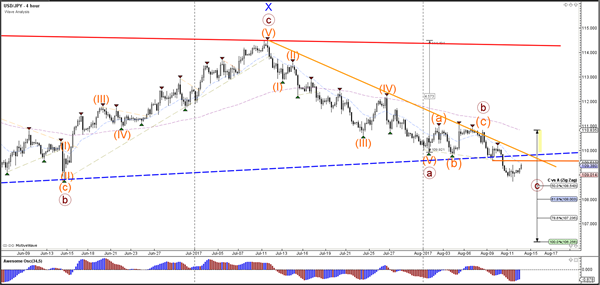
The USD/JPY could be building a wave 4 (orange) pullback if price manages to stay below the bottom of wave 1 (orange) which is indicated by the resistance trend line (red).
Currency pair GBP/USD
The GBP/USD broke above the resistance trend line (dotted red) and could be building a potential bullish retracement as part of a wave 2 (red). The red trend lines and Fibonacci levels could act as a resistance zone. The purple boxes are indicating a potential head and shoulders reversal chart pattern.
The GBP/USD bullish breakout has probably started wave C (purple) of wave 2 (red).
Weekly Technical Outlook And Review: EUR/USD, GBP/USD, AUD/USD, USD/JPY, USD/CAD, USD/CHF, DOW 30, GOLD
A note on lower timeframe confirming price action...
Waiting for lower timeframe confirmation is our main tool to confirm strength within higher timeframe zones, and has really been the key to our trading success. It takes a little time to understand the subtle nuances, however, as each trade is never the same, but once you master the rhythm so to speak, you will be saved from countless unnecessary losing trades. The following is a list of what we look for:
- A break/retest of supply or demand dependent on which way you're trading.
- A trendline break/retest.
- Buying/selling tails ... essentially we look for a cluster of very obvious spikes off of lower timeframe support and resistance levels within the higher timeframe zone.
- Candlestick patterns. We tend to only stick with pin bars and engulfing bars as these have proven to be the most effective.
We typically search for lower-timeframe confirmation between the M15 and H1 timeframes, since most of our higher-timeframe areas begin with the H4. Stops are usually placed 1-3 pips beyond confirming structures.
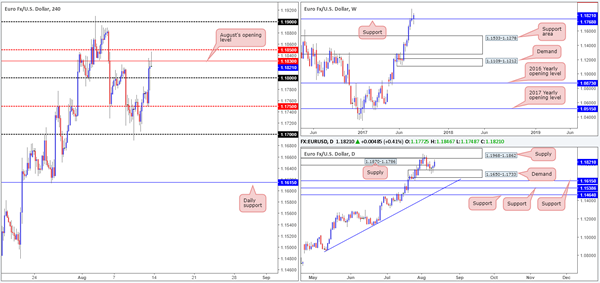
EUR/USD
Weekly gain/loss: + 48 pips
Weekly closing price: 1.1821
Despite the weekly timeframe stamping in a strong-looking selling wick, price failed to generate anything noteworthy to the downside last week. Instead, what we saw was the pair decisively print a close above weekly resistance at 1.1768, which has directly exposed a weekly resistance level coming in at 1.2044 (not seen on the screen).
The daily timeframe initially highlighted both the demand at 1.1650-1.1733 and supply drawn from 1.1870-1.1786. The supply suffered multiple breaks to the upside the week prior, giving the impression that the bulls were heading higher. However, what we failed to see last week was the supply (formed by an overlapping tail/wick that broke the 7/6/2010 low at 1.1876) lurking just above this area at 1.1968-1.1862.
A brief look at recent dealings on the H4 timeframe saw the EUR/USD swallow the 1.18 handle after US inflation data came in slightly lower than expected. Price found refuge around the 1.1830 mark (August’s opening level), and ended the day chalking up a selling wick.
Suggestions: Selling conditions remain somewhat uninviting at the moment. This is due to the 1.18 handle – coupled with the EUR being entrenched within a strong uptrend at the moment and weekly price currently trading above resistance.
On the flip side, we do have the daily supply mentioned above at 1.1968-1.1862 in view, which has already managed to cap upside two weeks back. Still, the move from this area was, as you can see, quickly stopped by the daily demand at 1.1650-1.1733, which we’re sure you’ll agree, is not the most attractive in terms of its shape and momentum, thus further supporting a weaker sell side in this market.
Overall, our team remains biased to the upside, but at the same time still slightly weary of the daily supply at 1.1968-1.1862! To that end, we would like to see the bulls charge into this zone this week and make their presence felt, before we consider buying this market. A decisive H4 close above the 1.19 mark would be ideal here.
Data points to consider: No high-impacting events scheduled on the docket today.
Levels to watch/live orders:
- Buys: Watching for a decisive close above 1.19 before we consider buying.
- Sells: Flat (stop loss: N/A).
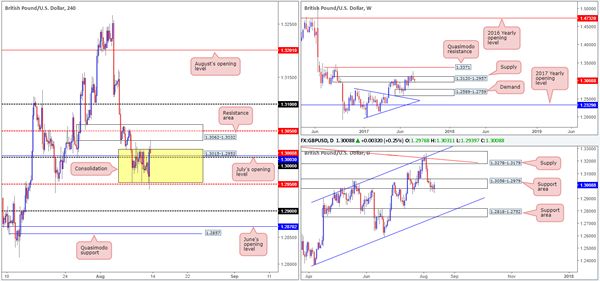
GBP/USD:
Weekly gain/loss: – 25 pips
Weekly closing price: 1.3008
Following a dominant weekly selling wick that closed back within the walls of a weekly supply at 1.3120-1.2957, weekly sellers struggled to register anything noteworthy to the downside last week. In the event that the bears do regain consciousness here, nevertheless, this would likely place weekly demand at 1.2589-1.2759 back in view.
Down on the daily timeframe, the support area at 1.3058-1.2979 has, although it looked incredibly vulnerable all week, managed to bolster price going into the week’s end. A move below this zone would likely expose another support area located at 1.2818-1.2752, which happens to fuse with a channel support etched from the low 1.2365 and is also seen glued to the top edge of the said weekly demand.
Looking across to the H4 timeframe, we can see that the pair spent the majority of the week consolidating between 1.3015-1.2953 (yellow zone). As you can probably see, within the top edge of this range we have the large psychological number 1.30 as well as July’s opening level at 1.3003.
Despite price trading above the 1.30 line, a buy in this market is still challenging. Not only because of where weekly price is currently positioned, but also because of the nearby H4 resistance area seen at 1.3062-1.3032 that houses the mid-level resistance line at 1.3050. A sell on the other hand, would not be of interest to our team until a H4 close is seen below the current H4 range.
Suggestions: A close below the 1.2950 neighborhood, together with a successful retest would, in our humble view, be enough evidence to suggest a move down to the 1.29 handle, followed closely by June’s opening line at 1.2870/H4 Quasimodo support at 1.2857.
Data points to consider: No high-impacting events scheduled on the docket today.
Levels to watch/live orders:
- Buys: Flat (stop loss: N/A).
- Sells: Watch for H4 price to close below the 1.2950 region and then look to trade any retest seen thereafter ([waiting for a reasonably sized bearish candle to form following the retest – in the shape of either a full, or near-full-bodied candle – is advised] stop loss: ideally beyond the candle’s wick).
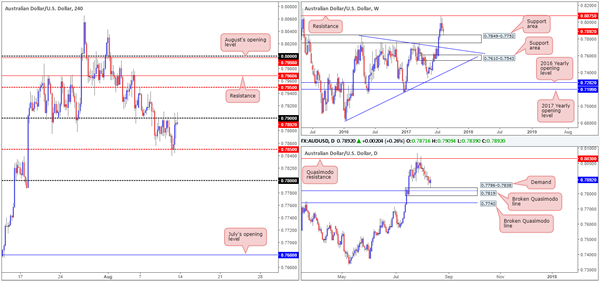
AUD/USD:
Weekly gain/loss: – 37 pips
Weekly closing price: 0.7835
After the near-touch of a weekly resistance seen at 0.8075 two weeks back, the unit continued to slide lower last week and challenged the top edge of a weekly support area chiseled in at 0.7849-0.7752. The response seen from this area, coupled with daily price bouncing from just ahead of a demand base at 0.7786-0.7838 (encases a daily broken Quasimodo level at 0.7819), is likely going to be of interest to a lot of buyers this week!
Punching the buy button at current price, however, may not be the best path to take The 0.79 handle seen drawn on the H4 timeframe has been on the defensive since Wednesday, which was also a recognized support from the 20th July right through to the 8th August. A close above 0.79 would, in our humble view, accomplish two things. Firstly, it would likely confirm higher prices up to at least the mid-level resistance at 0.7950, followed closely by resistance at 0.7968. Secondly, it will help further validate the strength behind the higher-timeframe supports mentioned above.
Suggestions: Essentially, a H4 close above 0.79 is required before our team can take any action. Following this, we will need to see a retest that (preferably) is accompanied by a lower-timeframe buy signal. For entries using lower-timeframe structure we primarily have three setups we look for, which are all detailed at the top of this report.
Data points to consider: RBA assist Gov. Kent speaks at 12.35am. Chinese industrial production at 3am GMT+1
Levels to watch/live orders:
- Buys: Watch for H4 price to close above 0.79 and then look to trade any retest seen thereafter ([waiting for a lower-timeframe signal to form following the retest is advised] stop loss: dependent on where one confirms this level).
- Sells: Flat (stop loss: N/A).
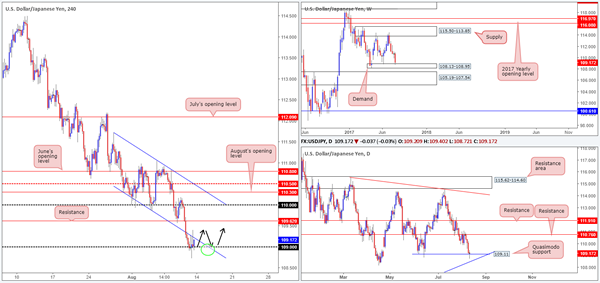
USD/JPY:
Weekly gain/loss: – 151 pips
Weekly closing price: 109.17
The safe-haven Japanese yen remained well-bid last week as tensions between the US and North Korea escalated, consequently bringing weekly action into contact with demand based at 108.13-108.95. This area did a superb job in holding the market higher back in June, so we may see history repeat itself here this week. Should the zone suffer a break, nonetheless, there’s a large support area waiting just below at 105.19-107.54.
In addition to the weekly demand in play right now, we also can see that the daily Quasimodo support at 109.11 remained intact, despite a rather aggressive whipsaw to a low of 108.72. Assuming that this level continues to hold ground, we do not see much in the way of resistance on this scale until the 110.76 neighborhood.
Friday was a quiet day in the market, with H4 price seen clinging to the 109 handle. Collectively, as we mentioned in Friday’s report, all three timeframes show structure suggesting a buy in this market. The question still remains however, how does one go about finding an entry? Simply clicking the buy button, in our opinion, just won’t do given the strength of the approach seen into the above said supports.
Suggestions: Personally, for us to commit to a long from 109, we would want to see H4 price break back into the nearby channel edge taken from the low 110.30, and then retest 109 again as support (as per the black arrows). Ultimately, we’d be looking to target 109.62 initially, followed by the 110 handle which converges with a H4 channel resistance taken from the high 111.71.
Data points to consider: Japanese prelim GDP q/q figures at 12.50am GMT+1.
Levels to watch/live orders:
- Buys: 109 region ([watch for H4 price break back into the nearby H4 channel edge taken from the low 110.30 and then retest 109 again as support] waiting for a H4 bullish candle, preferably a full, or near-full-bodied candle, to form following the retest is advised] stop loss: ideally beyond the candle’s tail).
- Sells: Flat (stop loss: N/A).
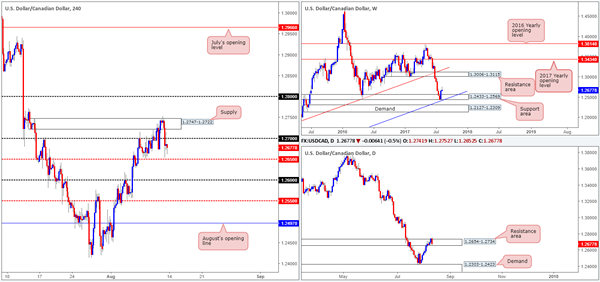
USD/CAD:
Weekly gain/loss: + 28 pips
Weekly closing price: 1.2677
Despite the stronger-than-expected rebound seen from the weekly support area given at 1.2433-1.2569 two weeks ago, weekly sellers came into the fray last week and formed a rather attractive selling wick, also known as a bearish pin bar. Unfortunately, as far as we can see, the candle lacks resistance on this scale.
The daily timeframe on the other hand, printed a bearish engulfing formation around a resistance area fixed at 1.2654-1.2734. This area – coupled with the bearish candle signal, could see the bears reassert their dominance this week. Should this come into view, the next area on the hit list is the demand penciled in at 1.2303-1.2423.
A quick recap of Friday’s segment on the H4 chart shows the supply coming in at 1.2747-1.2722 suffered a minor breach to the upside in early trading. After a small, yet clearly powerful, bearish selling wick took shape, the unit declined in value. The move was further intensified after US inflation numbers failed to meet market expectations, forcing price to break below/ retest the 1.27 hurdle during the later hours of the US session.
For those looking to sell the daily bearish engulfing formation, alongside the weekly bearish pin bar, we would strongly recommend waiting for H4 price to take out the nearby H4 mid-level support etched at 1.2650 beforehand.
Suggestions: A H4 close below 1.2650, followed up with a retest and a reasonably sized H4 bearish candle, preferably in the shape of a full, or near-full-bodied candle, would make for a decent sell. The initial target base would have to be the 1.26 handle. Given how close this number is located, we would not be looking to take profits here, and instead reduce risk to breakeven in the hope that weekly and daily sellers force the market back down into the walls of the weekly support area at 1.2433-1.2569, thus providing us with a healthier risk/reward ratio.
Data points to consider: No high-impacting events scheduled on the docket today.
Levels to watch/live orders:
- Buys: Flat (stop loss: N/A).
- Sells: Watch for H4 price to close below 1.2650 and then look to trade any retest seen thereafter ([waiting for a reasonably sized bearish candle to form following the retest – in the shape of either a full, or near-full-bodied candle – is advised] stop loss: ideally beyond the candle’s wick).
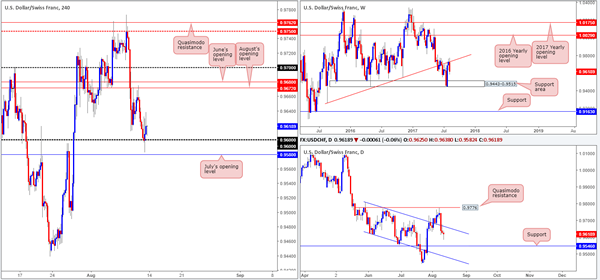
USD/CHF:
Weekly gain/loss: – 109 pips
Weekly closing price: 0.9618
The weekly trendline resistance extended from the low 0.9257 was brought into view over the past few weeks. At the outset, little bearish recognition was seen from this line. That was, of course, until last week where we saw the market selloff heavily from here! The move engulfed the prior week’s candle and has, in our opinion, firmly placed the weekly support area at 0.9443-0.9515 back on the hit list.
In line with weekly flow, the daily candles (after coming within touching distance of a Quasimodo resistance level at 0.9776) dove lower and re-entered the descending channel formation drawn from high to low 0.9808/0.9622. The next support on the hit list from here can be seen at 0.9546 – positioned 31 pips above the top edge of the aforesaid weekly support area.
Over on the H4 timeframe, however, the 0.96 handle remained intact despite an earnest attempt to push lower on the back of lower-than-expected US inflation figures. 0.96 – coupled with July’s opening level at 0.9580 is likely to throw a spanner in the works for anyone looking to sell on the basis of last week’s momentum from the weekly trendline resistance. Usually, in cases such as this we would simply wait for these levels to be consumed and then look to trade the retest. However, given the distance between 0.9580 and 0.9546 (the daily support) is only 34 pips, you’re unfortunately left with little room to maneuver for a short.
Suggestions: On account of the above notes, remaining flat until more conducive price action presents itself is the route we’ve chosen to take.
Data points to consider: No high-impacting events scheduled on the docket today.
Levels to watch/live orders:
- Buys: Flat (stop loss: N/A).
- Sells: Flat (stop loss: N/A).
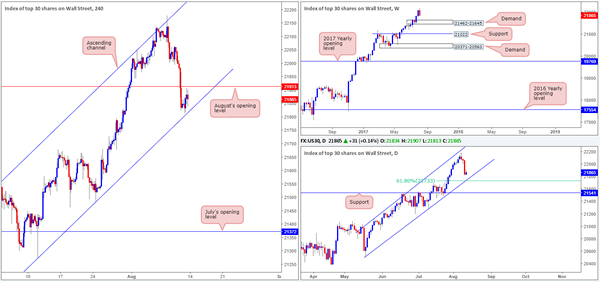
DOW 30:
Weekly gain/loss: – 206 points
Weekly closing price: 21865
US equities declined in value last week, consequently breaking a two-week bullish phase. The move, influenced by escalating tensions between the US and North Korea, wiped out the majority of the prior week’s losses and very nearly formed a weekly bearish engulfing candle! Providing that the bears remain dominant this week, we could see the index revisit weekly demand pegged at 21462-21645.
Looking down to the daily candles, we can see that price is now trading within a stone’s throw away from a channel support line etched from the low 20494 (which fuses with a 61.8% Fib support at 21733 taken from the low 21462) . If you overlap both the weekly and daily charts, you’ll notice that the channel support is in fact located a tad above the demand seen noted on the weekly timeframe. Therefore, a fakeout through the channel support line to the top edge of the weekly zone could be something to keep an eyeball on this week!
A closer look at price action on the H4 timeframe shows the unit closed the week just ahead of a channel support line extended from the low 21273. The trouble here is both the H4 and daily channel supports are positioned relatively close together. Also of particular interest on the H4 scale is August’s opening line coming in at 21913, which is currently lurking above current price.
Our suggestions: In view of the technical landscape at the moment, we initially believed that the H4 channel support will likely suffer a minor fakeout, as traders may press for the daily channel support and its converging 61.8% Fib support for long opportunities. However, seeing as how close the weekly demand is located below the daily channel support, we may be in for an even deeper fakeout than originally anticipated!
When anticipating a fakeout, we tend to always attempt to trade the extreme! And in this case we believe the extreme to be the top edge of the weekly demand at 21645. This may seem a long way off at 220 points from current price, but if the trade comes to fruition and does indeed prove to be a fakeout, the payout could be huge! As for stops and take-profit levels, this will be decided if and when price approaches our buy level. This is where patience comes into play, traders!
Data points to consider: No high-impacting events scheduled on the docket today.
Levels to watch/live orders:
- Buys: 21645 region (stops and take profits to be decided if/when price descends to this number.
- Sells: Flat (stop loss: N/A).
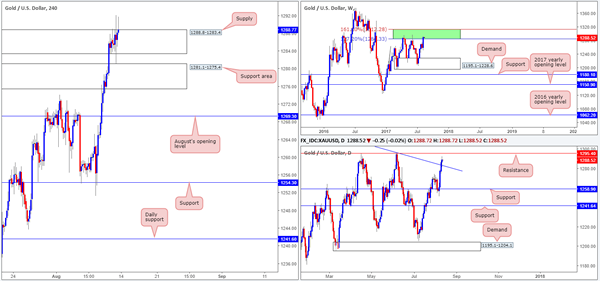
GOLD:
Weekly gain/loss: + $30.3
Weekly closing price: 1288.7
As tensions between North Korea and the US intensified, demand for the safe-haven metal forced price action north last week and recently drove into the jaws of an interesting resistance area seen on the weekly chart. A green zone comprised of two weekly Fibonacci extensions 161.8/127.2% at 1312.2/1284.3 taken from the low 1188.1. Weekly price has, as you can see, responded each time this area has been challenged, therefore there’s a chance that we may see history repeat itself here.
The story on the daily timeframe reveals that price recently crossed above a trendline resistance extended from the high 1337.3. There is resistance seen directly overhead at 1295.4, but apart from the two occasions on 17/04/2017 and 06/06/2017, there’s little history registered with this number! For that reason, we may see price break above this line and head to the resistance carved from 1308.4, which boasts very attractive history dating back to early 2011.
Analyzing Friday’s sessions on the H4 timeframe, supply at 1288.8-1283.4 remained intact despite two aggressive whipsaws through the top edge of the zone. A close above this area would, in our view, confirm a test of the daily resistance level mentioned above at 1295.4.
Our suggestions: Based on the above notes, our desk will not be looking for (long-term) shorts until the daily resistance line plotted at 1308.4 is in play. This is due to the history surrounding this number and its position within the current weekly resistance area (allowing us to place stops tightly above this zone).
Levels to watch/live orders:
- Buys: Flat (stop loss: N/A).
- Sells: 1308.4 region. This is, given the location of this daily resistance on the weekly timeframe, a fantastic level to be looking for shorts if the number comes into view.