Sample Category Title
USDJPY Analysis: Realises Upside Potential
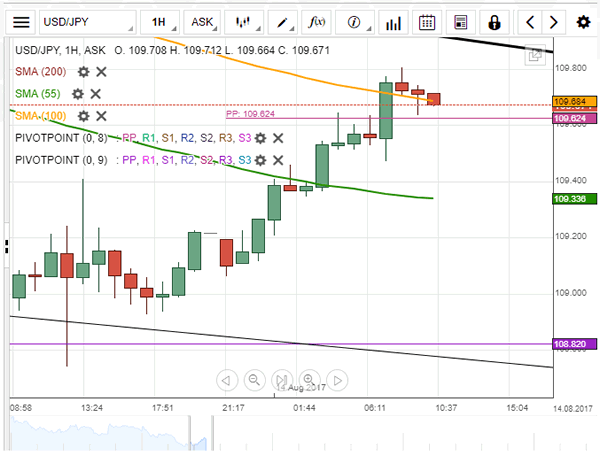
The US Dollar was relatively flat against the Yen on Friday, thus remaining in the 109.00/20 area for the whole session. The given lack of momentum changed this morning when the rate managed to reach the weekly PP at 109.62.
The steepness of the downtrend has shifted north, as apparent from the rate's inability to reach the lower channel boundary. Thus, the formation of a junior channel down was confirmed.
Taking into account bullish technical indicators, the upside limit for this session may be set at the upper boundary of either the senior or junior channel circa 109.80 and 110.20, respectively. The latter is also supported by the 200-hour SMA.
GBP/USD Analysis: Recovers From Three-Week Low
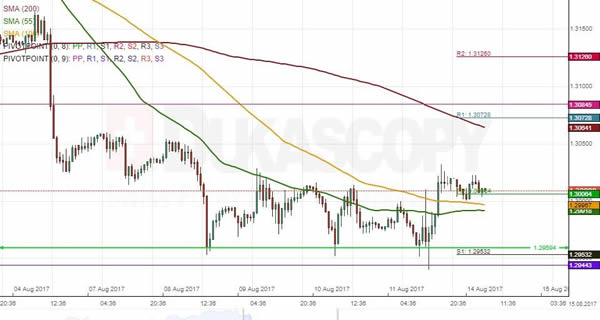
GBP/USD halted at the 1.2960 mark on Friday, thus forming a triple bottom. The rate consequently went through the 55– and 100-hour SMAs, the latter of which has since provided strong support near the 1.30 mark.
The Pound is trading sideways this morning, fluctuating around the newlyestablished weekly PP at 1.3001.
It is likely that a support cluster formed by the aforementioned SMAs provides a strong barrier. By and large, no significant leaps either direction are expected today, resulting in a rather flat movement. The Pound, however, may still edge higher against the Greenback and approach the 1.3040 area.
EUR/USD Analysis: Patterns Get Adjusted
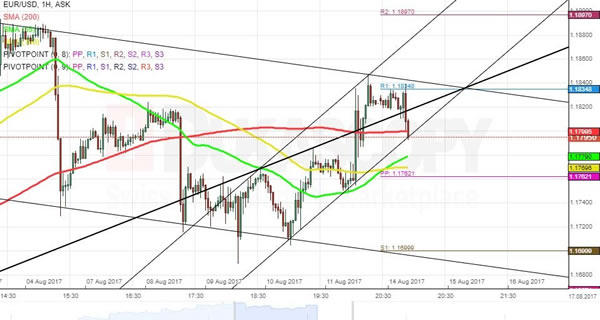
The recent surge of the Euro against the US Dollar to the 1.1850 mark has forces a review of the situation of the pair. Both, short term and medium term patterns were adjusted.
After the adjustment the medium term descending channel pattern is with a lesser incline than previously thought. Meanwhile, the junior patter seems to be still holding. However, in the near future it will become obsolete.
All in all, the forecast of a decline of the pair remains in force. Although, in the next 24 hours the currency pair will face the support of the 55 and 100–hour SMAs together with the weekly PP in a range from 1.1780 to 1.1760
Technical Outlook: Spot Gold Pulls Back As Safe Haven Demand Eases
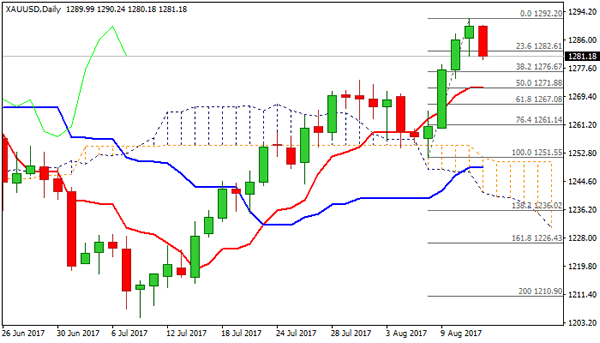
Spot Gold moved lower on Monday after last week’s strong rally peaked at $1291. Profit-taking on increased safe-haven demand rally and overbought daily studies triggered pullback.
Gold price eased to $1280 so far, after failing to regain $1292 peak in early trading on Monday and eye a cluster of supports below.
Initial support lies at $1276 (hourly cloud base / Fibo 38.2% of $1251/$1292 upleg), followed by previous high of 01 Aug at $1274 and 50% retracement / daily Tenkan-sen / 10SMA at $1271.
Overall bullish structure sees $1271 support as ideal reversal point before fresh attempts higher for final attempt towards key barrier at $1296 (06 June peak).
However, deeper correction cannot be ruled out as strong pressure on dollar on geopolitical tensions is easing and indicators that reversed from overbought territory on daily chart show a plenty of room at the downside.
Next pivotal supports at $1267 (Fibo 61.8%) and $1263 (rising 20SMA) could come in focus on violation of $1271 support.
Res: 1287, 1289, 1292, 1296
Sup: 1280, 1276, 1274, 1271
CRUDE OIL Wide-Open For Further Weakness
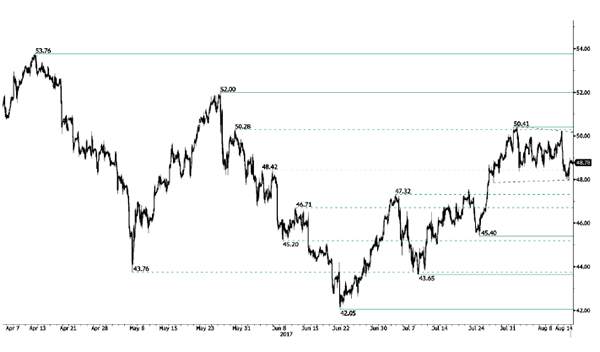
Crude oil is trading lower. Hourly support is given at a distance at 45.40 (24/07/2017 low). Strong resistance can be found at 50.41 (31/07/2017). Expected to show short-term weakness.
In the long-term, crude oil has recovered after its sharp decline last year. However, we consider that further weakness are very likely. Strong support lies at 35.24 (05/04/2016) while resistance can now be found at 55.24 (03/01/2017 high).
SILVER Bullish Pressures Are On
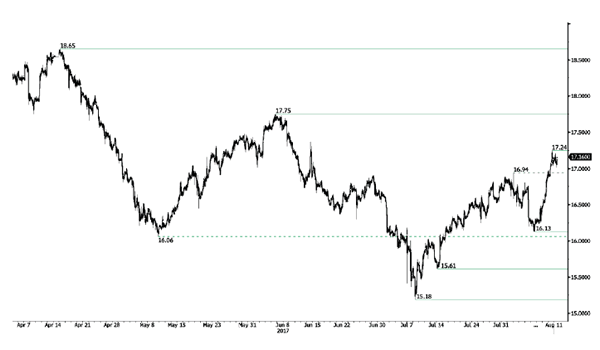
Silver's bullish pressures are on. Hourly resistance lies at 17.24 (10/08/2017 high) while support can be found at 16.13 (07/08/2017 high). Expected to show continued current bullish momentum.
In the long-term, the death cross indicates that further downsides are very likely. Resistance is located at 25.11 (28/08/2013 high). Strong support can be found at 11.75 (20/04/2009).
GOLD Bearish Consolidation
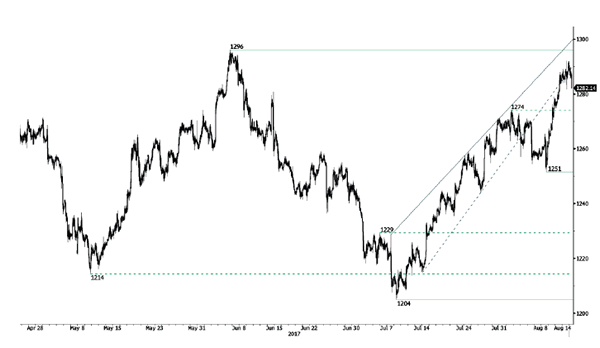
Gold is consolidating lower. Hourly support is given at 1251 (08/08/2017 low). Stronger support lies at 1204 (10/07/2017 high). The commodity is heading towards resistance given at 1296 (06/06/2017 high). Expected to show renewed buying pressures.
In the long-term, the technical structure suggests that there is a growing upside momentum. A break of 1392 (17/03/2014) is necessary ton confirm it, A major support can be found at 1045 (05/02/2010 low)
BITCOIN New All-Time High!!
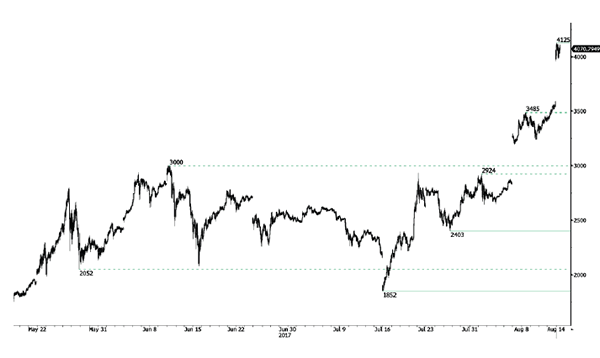
Bitcoin keeps on surging. The digital currency has set a new all-time high at 4125 (14/08/2017 high) and hourly support lies very far at 2403 (26/07/2017 low). The road is wide open for another bullish move.
In the long-term, the digital currency has had an exponential growth. There are decent likelihood that the asset will consolidate above $1500. Long-term support is given at $1464 (04/05/2017 low).
EUR/CHF Bouncing Higher
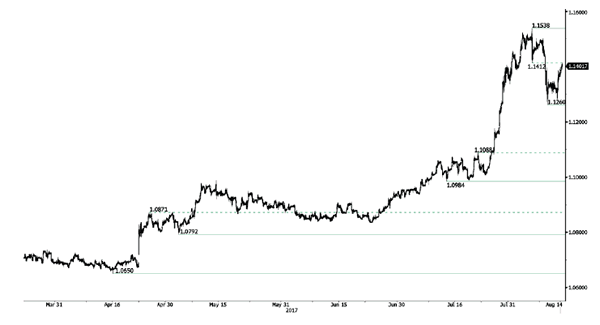
EUR/CHF's short-term buying pressures are back on. Hourly support is now located at 1.1260 (04/08/2017 low). Expected to show continued increase.
In the longer term, the technical structure has reversed. Strong resistance at 1.1200 (04/02/2015 high) has been broken. Yet,the ECB's QE programme is likely to cause persistent selling pressures on the euro, which should weigh on EUR/CHF. Supports can be found at 1.0184 (28/01/2015 low) and 1.0082 (27/01/2015 low).
EUR/GBP Consolidating Below 0.9100
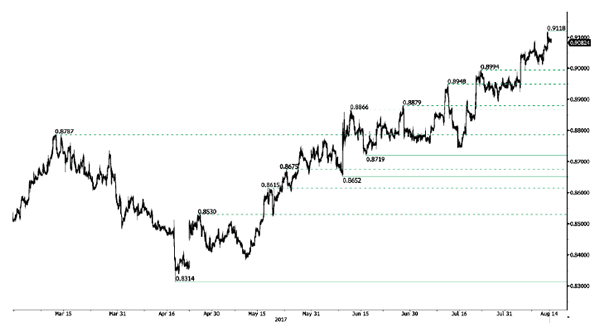
EUR/GBP is trading around its highest levels of the year despite ongoing consolidation. Hourly resistance lies at 0.9087 (08/08/2017 high). Hourly support is given at a distance at 0.8742 (16/06/2017 low). Downside risks are nonetheless important.
In the long-term, the pair has largely recovered from recent lows in 2015. The technical structure suggests a growing upside momentum. The pair is trading above from its 200 DMA. Strong resistance can be found at 0.9500 psychological level.