
Sample Category Title
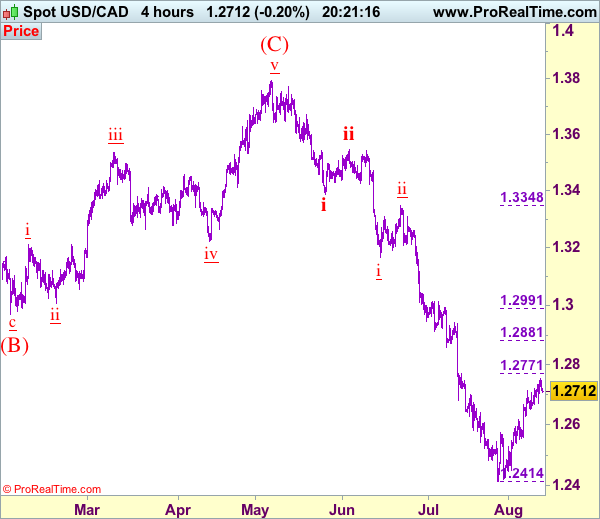
Trade Idea: USD/CAD – Sell at 1.2800
USD/CAD - 1.2710
Recent wave: Only wave v of c has ended at 0.9407 and wave C of major A-B-C correction is underway with wave iii ended at 1.4690, wave v of C may bring one more marginal rise probably in 2018
Trend: Down
Original strategy :
Sell at 1.2770, Target: 1.2570, Stop: 1.2830
Position: -
Target: -
Stop: -
New strategy :
Sell at 1.2800, Target: 1.2600, Stop: 1.2860
Position: -
Target: -
Stop:-
Dollar’s intra-day initial rise to 1.2753 suggests near term upside risk remains for the corrective rise from 1.2414 (tentatively wave iv) to extend gain to 1.2771 (previous resistance as well as 38.2% Fibonacci retracement of wave iii), however, reckon upside would be limited and renewed selling interest should emerge around 1.2800, bring retreat later, below 1.2670-75 would bring test of 1.2625-30, break there would suggest top is possibly formed but below 1.2540-50 is needed to add credence to this view and suggest the rebound from 1.2414 has ended instead, bring further fall to 1.2490-00, having said that, reckon support at 1.2451 would hold on first testing. We are keeping our count that wave v as well as wave (C) ended at 1.3794 and impulsive wave (i ii, i ii) is now unfolding with minor wave iii possibly ended at 1.2414, hence wave iv correction is underway.
In view of this, would be prudent to stand aside for now and look to sell on further subsequent rebound as 1.2800-10 should limit upside. Above 1.2800-10 would defer and risk a stronger correction to 1.2850, however, still reckon upside would be limited to 1.2880-85 (50% Fibonacci retracement of wave iii) and bring retreat later next week.
To recap, wave B from 1.3066 is unfolding as an a-b-c and is sub-divided as a: 1.2192, b: 1.2716 and wave c is a 5-waver with i: 1.1983, ii: 1.2506, extended wave iii with minor iii at 1.0206, wave iv ended at 1.0781 and wave v as well as wave iii has ended at 0.9931, hence the subsequent choppy trading is the wave iv which is unfolding as (a)-(b)-(c) with (a) leg of iv ended at 1.0854, followed by (b) leg at 1.0108 and (c) leg as well as the wave iv ended at 1.0674. The wave v is sub-divided by minor wave (i): 0.9980, (ii): 1.0374, (iii): 0.9446, (iv): 0.9913 and (v) as well as v has possibly ended at 0.9407, therefore, consolidation with upside bias is seen for major correction, indicated target at 1.3700 and 1.4000 had been met and further gain to 1.4700 would be seen later.
EUR/JPY Bears In Control
Price extends the bearish momentum, a retest of the 38.2% retracement level and the median line (ml) of the minor descending pitchfork will validate a further drop in the upcoming period. The next downside target will be at the lower median line (lml) of the minor descending pitchfork. We have a major support at the 126.05 level as well.
GBP/USD Consolidating But Pay Attention To POC Zone
The GBP/USD is consolidating within the rectangle pattern. The consolidation is due to the US CPI data at 12:30 GMT. Traders need to pay attention to 1.2992 the X-cross of a trend line and D H3 camarilla pivot. Move above the trend line could possible spike the GBP/USD to POC zone 1.3040-60 (D H5, Rectangle top, ATR projection high, 50.0 fib, Order block) where we might see fresh sellers. The price should reject towards 1.2992 and 1.2940. Only below 1.2940 we should see the continuation towards D H5/ATR low 1.2910.
- W L3 - Weekly Camarilla Pivot (Weekly Interim Support)
- W H3 - Weekly Camarilla Pivot (Weekly Interim Resistance)
- W H4 - Weekly Camarilla Pivot (Strong Weekly Resistance)
- M H4 - Monthly Camarilla Pivot (Very Strong Monthly Resistance)
- M L3 - Monthly Camarilla Pivot (Monthly Support)
- M L4 - Monthly H4 Camarilla (Very Strong Monthly Support)
- POC - Point Of Confluence (The zone where we expect price to react aka entry zone)
Don’t Get Carried Away by North Korean Market Volatility
Key points
- A military confrontation between US and North Korea is a lowprobability but high-impact event for markets.
- Current risk aversion is likely to be temporary although it will be bumpy and headline-driven.
- If there is a military confrontation, we would expect an acceleration of this week's price action.
- Our quantitative business cycle model signals that the US is gaining speed.
- A pick-up in US growth suggests that US yields and equities should head higher when North Korean tensions fade.
A low-probability but high-impact event for markets
This week, tensions have escalated between North Korea and the US. The recent chain of events started after the United Nations Security Council last weekend hit Pyongyang with new sanctions as punishment for North Korea's aggressive missile testing programme. This triggered aggressive comments from North Korea followed up by a statement by US President Donald Trump on Tuesday, in which he said that the country's threat would be 'met with fire and fury like the world has never seen'. The North Korean regime responded by threatening to attack the US's Pacific territory of Guam by launching four intermediaterange missiles which would land about 20 miles offshore and could be launched as soon as next week. On Thursday, President Trump said that his statement on Tuesday 'maybe wasn't tough enough'.
The driver behind the escalation is North Korea advancing fast in developing an Intercontinental Ballistic Missile (ICBM) that could reach the US with a nuclear warhead. North Korea conducted its first ICBM test on 4 July and followed up with a second ICBM test on 28 July which led to the recent UN sanctions. How close North Korea is to posing a nuclear threat to the US mainland is difficult to say, but the Pentagon's Defence Intelligence Agency announced on Tuesday that they believe North Korea will be able to field a reliable, nuclear-capable ICBM as early as next year. North Korean tensions have gradually risen since Kim Jong Un came to power in 2011 and the current situation is probably the most tense it has been for many years. (See Chart 1). Still, the most likely scenario is that the current escalation of events does not lead to a military confrontation as both parties will have too much to lose from such an outcome. However, it is also difficult to foresee a sudden improvement in US-North Korean relations and recent events may increase long-term frictions in US-China relations.
Markets have reacted as expected this week with yields of US and German government bonds declining, equities selling off and safe-haven currencies like the Swiss Franc (CHF) and the Japanese yen (JPY) strengthening. Although Japan is close to the epicentre of the crisis, the JPY typically strengthens during North Korean tensions as Japan is a creditor nation and local investors typically 'bring money home' when they face a crisis. Despite a slight pick-up in market volatility, risk premiums are very low across asset classes. For example, VIX volatility and Europe
Military confrontation between the US and North Korea is a low-probability but highimpact event for markets. That naturally makes it difficult for markets to price it. In recent years, geopolitical tensions have had a brief, albeit sharp, impact on markets as central banks have come to the rescue. In our base case, in which the North Korean situation does not escalate into a military confrontation, we would expect the current risk aversion to be temporary although it is likely to be bumpy and very much headlinedriven. In the risk scenario, where the current tensions escalate sharply, we would expect an acceleration of this week's price action, i.e. a sharp rise in risk premiums across asset classes, substantial falls in US and German government bonds yields, significant JPY and CHF strength and a massive sell-off in equities, particularly in Europe which is more linked into the global cycle. (See Table 1).
Looking beyond North Korea and assuming that the situation does not escalate, the world economy is looking strong. Our quantitative business cycle model, MacroScope, signals that the global recovery will remain intact in H2 and that the US economy is gaining speed (see Chart 3). This is positive for equities, especially for the US. The positive cyclical outlook for the US also supports our view that US yields will head higher in coming months. In terms of EUR/USD, we expect the recent sharp move higher to fade heading into the Jackson Hole conference 24-26 August and the ECB meeting on 7 September. We believe the ECB president Mario Draghi will be cautious in not sounding too confident given the recent sharp rise in the effective EUR which has risen to its highest level since Q4-2014. We forecast EUR/USD at 1.17 in 1M and 3M before the next leg higher towards 1.22 in 12M.
Global market views
Equities
Our short-term trading opportunity stance (0-1 month): Buy on dips
Our strategy stance (3-6M): Neutral on equities vs cash
We keep our short-term buy-on dips stance, as we think the fundamental factors (the global cycle and earnings) are stills strong. So far, history shows that geopolitical shocks are not able to offset the equity markets as long as the cycle is strong. On a longer-term basis, we remain neutral on equities, as we have been since April this year.
Bond market
German/Scandi yields - set to stay in recent range for now, higher o n 12M horizon
Inflation to stay subdued despite decent growth. Stronger euro keeps euro inflatio n outlook down. ECB to normalise gradually only, due to lack of wage pressure and stronger euro.
If the situation in North Korea escalates further it can add renewed downward pressure on global yields.
EU curve - 2Y10Y set to steepen when long yields rise again
The ECB keeps a tight leash on the short end of the curve. With 10Y yields stable, the curve should change little on a 3-6M horizon. Risk is skewed towards a steeper curve earlier than we forecast.
US-euro spread set to widen marginally
The Fed's QT programme (balance sheet reduction) is to happen at a very gradual pace and impact on the Treasury market should be benign. Yet market pricing for Fed hikes is very dovish and yields should edge higher on 12M horizon.
Peripheral spreads - tightening but still so me facto rs to watch
Economic recovery, ECB stimuli, better fundamentals, particularly in Portugal and Spain and an improved political picture are expected to lead to further tightening despite the recent strong moves. Italy is the big risk factor.
FX
EUR/USD - up momentum wearing off but set fo r 1.20 and beyond in 2018
EUR/USD has turned for good as ECB has reluctantly allowed 'reverse gravity' to kick in but upward momentum set to wear off near term. EUR/USD at 1.22 in 12M.
EUR/GBP - downside risks po stpo ned as BOE stays put
Relative growth and monetary policy support a higher EUR/GBP near-term. Cross above 0.90 in 3M before a downward move further out on Brexit clarification, valuation.
USD/JPY - gradually higher longer term A BoJ set to sidelined in central-bank exit talk should cap
JPY upside for an extended perio d. Fed and ECB eagerness to tighten is set to support EUR/JPY and USD/JPY near term.
EUR/SEK - range-bound near term, then gradually lower
Gradually lower medium-term on fundamentals and valuation longer term but near-term SEK potential limited by the Riksbank.
EUR/NOK - range-bound near term, then gradually lower Headwinds near term due to low oil prices but longer term
NOK should rebound on valuation, growth and real-rate differentials normalising.
Commodities
Oil price - range-bound, do wnside risk
Rebound recently on better China data and robust global growth. Still range bound and now in middle of range.
Metal prices - range-bound, do wnside risk
Underlying support from consolidation in mining industry, better China data lately. China to slow again after National Congress adding downside risks in the medium term.
Go ld price - range-bound
Tug of war between geopolitical uncertainty and stronger USD.
Agriculturals - stabilisation
Dry weather created supply concerns but prices have come down again lately.
USDJPY – Weakens Further On Bear Pressure
USDJPY - With the pair selling off further on Thursday, further bearishness is likely. On the downside, support comes in at the 109.00 level where a break if seen will aim at the 108.50 level. A cut through here will turn focus to the 108.00 level and possibly lower towards the 107.50 level. Its daily RSI is bearish and pointing lower suggesting more weakness. On the upside, resistance resides at the 109.50 level. Further out, we envisage a possible move towards the 110.00 level. Further out, resistance resides at the 110.50 level with a turn above here aiming at the 111.00 level. On the whole, USDJPY looks to weaken further on bear pressure.
Euro Yawns As German CPI Matches Estimate
EUR/USD continues to show little movement, as the pair has inched lower in Friday trade. Currently, the pair is trading at 1.1750, down 0.19% on the day. On the release front, German Final CPI improved to 0.4%, matching the forecast. German Final WPI was unable to keep pace, posting a decline of 0.1%, well below the forecast of 0.3%. In the US, the focus is on inflation numbers, with the release of CPI and Core CPI. Both key indicators are expected to post a small gain of 0.2%. We’ll also hear from two FMOC members, Dallas Fed President Robert Kaplan and Minneapolis Fed President Neel Kashkari.
Global markets remain jittery over rising tensions between North Korea and the US. With the war of words escalating between the two countries, global markets are down, as investors have dumped shares in favor of safe-haven assets, such as the Japanese yen and gold. North Korea has vowed to retaliate over new sanctions imposed by Washington and has threatened to attack Guam, which is a major US military base. President Trump and North Korean President Kim Jong-un are on a possible collision course, which has caused alarm in South Korea and Japan, strong allies of the US. The present situation is being compared to the Cuban Missile crisis, and although the likelihood of actual hostilities breaking out remains small, the crisis has reached levels where the markets cannot ignore it.
The ECB hasn’t said much about its asset purchases program (QE) in recent months, but that could change soon. In July, the bank said it would hold discussions on the scheme in “the autumn”, and analysts are split as to whether that means September or October. Either way, this means that the markets expect to hear shortly from the ECB that it will begin winding down its aggressive QE policy, given the stronger economic conditions in the euro zone. The bloc’s economy is forecast to expand a healthy 2.0% this year, and the eurozone outperformed both the US and the UK in the first half of 2017. The sore point remains inflation, which is stuck at low levels, despite the ECB’s ultra-accommodative monetary policy. Another factor which policymakers must deal with is the ECB’s bloated balance sheet, which stands at more than EUR 2 trillion. With the Federal Reserve expected to begin trimming its balance sheet as early as September, investors will be keeping a close eye on the ECB and the Fed once the summer is over.
The markets are looking for some clarity from the Federal Reserve, which is showing signs of backtracking on another rate hike in 2017. Earlier this year, the Fed strongly hinted that it planned to raise rates three times in this year, but so far has only pressed the rate trigger twice, in March and June. After the June hike, Fed Chair Janet Yellen shrugged off concerns over low inflation, saying that it was due to “transient” factors. However, inflation has not improved and the Fed has changed its tune. Last week, St. Louis Federal Reserve President James Bullard said he opposed further Fed hikes, warning that another hike would actually delay inflation from hitting the Fed’s target of 2%. The Fed appears uncertain about when to raise rates, and predictably, this hesitancy is making investors skeptical that the Fed will act. There is little chance that the Fed will make any moves at the September and November meetings, and the odds of a rate hike in December are currently at 42%. Analysts are hoping for some insight into the Fed’s thinking when the Fed Reserve Dallas President Robert Kaplan and Minneapolis President Neel Kashkari deliver speeches on Friday.
Dollar Index Comes Off 15-Month Lows, Bearish Bias Still In Place
The dollar index has continued extending its downtrend that started on January 4. After it touched a 15-month low on August 2, it bounced up moderately, but both the short-term and the medium-term outlook remain bearish.
According to the technical indicators, the index is bearish in the short-term. The RSI has been fluctuating below the neutral zone of 50 since May 11, while it managed to break above the oversold area (July 20) on August 4. The MACD has been trending in negative territory since March 22. Another bearish evidence arises from the index itself, as it is currently deviating below the 50-day and the 200-day exponential moving averages (EMA) and the Ichimoku cloud.
Should the price head up, an immediate resistance would be found around the Kijun-sen point of 94.22 which was also tested in August 2016. Then, another resistance would be met at the 95-psychological level before it targets the 96 key-mark as its next barrier. However, if the price hits above the 50-day EMA, the bias is likely to turn from bearish to neutral.
Alternatively, a move to the downside would meet the 15-month low of 92.36 (August 2) as a support, while if this level fails to hold, the 91.87 low reached in May 2016 could provide an additional support. Any decline from this point would shift focus to the 91-psychological mark.
Regarding the medium-term outlook, it is bearish as the index has been making lower highs and lower lows in the last three months. Moreover, the bearish cross between the 50-day and the 200-day EMA on May 24 is still in effect with both EMA currently negatively sloping.
GBPJPY Bearish, Technicals Point To Further Downside
GBPJPY shifted out of its neutral phase and turned bearish on the 4-hour chart after a break below the key 144.00 level on August 8. Momentum indicators are bearish although the slopes of both RSI and MACD suggest a weaker downside momentum.
The market is currently in the lower 141.00 handle. A breakdown at this point would bring into focus the next major low at 139.84 and then the June 12 low at 139.10.
Major resistance lies at 142.50. Prices would need to bounce back above 144.00 to weaken the risk of further declines and bring back a neutral bias. Rising above the cloud and into the 145.00 handle would open the way for a re-test of the 146.80 high. Clearing the July 11 high of 147.77 would see a resumption in the June to July uptrend.
The falling Tenkan-sen and Kijun-sen lines are supportive of the bearish bias. Further downside is expected since the market is below the Ichimoku cloud.
Investors Closely Watch Friday’s U.S. CPI Data
U.S. Dollar Sank On PPI Data. The dollar weakened after U.S. producer prices unexpectedly fell in July, recording their biggest drop in nearly a year and pointing to a further moderation in inflation that could delay a Federal Reserve interest rate increase. Investor focus now turns to Friday's U.S. consumer price index data.
The Yen Rallied Broadly Against Most Major Currencies. Stocks around the world fell sharply on Thursday, as the escalating tensions between the United States and North Korea drove investors to move into yen, gold and other safe-haven assets. U.S. dollar hit an eight-week low against the Japanese yen. The yen is often sought in times of geopolitical tension, partly because Japan has a big current account surplus.
RBA Keeps Rates At Record Lows. The Reserve Bank of Australia (RBA) has left interest rates at an all-time low 1.50 percent after last easing in August 2016 as it balances tepid inflation with skyrocketing household debt. The household debt-to-income ratio is at a record high 190 percent and rising faster than incomes.
Sterling Is At Three-Week Low. Mixed bag of output and trade data didn't have much impact on investors' downbeat view of an economy struggling to meet Bank of England targets. British pound touched a three-week low against the dollar.
NZD Consolidates After The Sell-Off. The kiwi was 0.79 percent lower against the greenback after New Zealand's central bank said it was slightly more uncomfortable with the high level of the local dollar than it had been in May. If the US dollar rises on tighter Fed policy, then NZD/USD could fall as far as 0.69 by year end.
Global Stocks Punished By Geopolitics, US Inflation In Focus
An air of caution is lingering across the financial markets during early trading on Friday, as investors closely monitor the escalating tensions surrounding the United States and North Korea. The war of words between the two nations is putting investors on high alert and more comments from President Trump overnight, has resulted in additional risk-off being seen in the markets.
Money is jumping into safe-havens like Gold and the Japanese Yen, while the Korean Won has fallen to its lowest level in a month- after extending its losses to around 2% for the week. After a very quiet start to the week due to the summer season, the second half has been dominated by geopolitics - with the mounting tensions between the United States and North Korea denting risk sentiment, ultimately punishing global stocks.
Asian equity markets tumbled lower on Friday amid the risk aversion, and European stocks are likely to extend losses as uncertainty accelerates the traders' flight to safety. Wall Street closed sharply lower on Thursday, after US President Donald Trump reiterated his warnings to North Korea. Stocks may remain pressured this afternoon, as market players remain hesitant to carry riskier assets ahead of the US inflation data, scheduled for later today.
Yen supported by risk aversion
The Japanese Yen has sharply appreciated against its major trading partners, following the escalation in geopolitical tensions between the United States and North Korea. Money has poured into the Yen as investors search for safe-haven assets following the “fire and fury” comments from US President Donald Trump, earlier in the week.
The Japanese Yen is regularly seen as a trader's best friend in times of uncertainty, and what we are noticing is a continuation of the same trend.
The Yen gained further ground against the US Dollar during trading on Friday, with the USDJPY dipping below 109.00 for the first time since mid-June.
If geopolitical risk and uncertainty continues to strengthen the Yen, USDJPY bears are likely to have found enough inspiration to conquer the stubborn 109.00 support level. From a technical standpoint, the USDJPY is heavily bearish on the daily charts, as there have been consistently lower lows and lower highs. A breakdown and daily close below 109.00, may even encourage an eventual depreciation towards 107.50
Commodity Spotlight – Gold
Market jitters from the escalating geopolitical tensions between the US and North Korea have brought Gold back into fashion this week, with the yellow metal hitting a fresh two-month high above $1288, during early hours on Friday. In times of uncertainty, investors continue to be attracted to Gold and further upside is likely, if US/North Korean anxiety supports the flight to safety.
Although the metal is currently following a positive trajectory on the daily charts, market players might decide to remain on the sidelines ahead of the US inflation report, released later today. It should be kept in mind that the inflation figures have the ability to impact the prospects of higher US interest rates, and this will possibly have a direct correlation to the value of Gold.
From a technical standpoint, Gold bulls are back in town and the breakout above $1280 increases the potential of a further appreciation towards $1300.
US inflation report in focus
The Dollar weakened against a basket of major currencies on Thursday, after U.S producer prices declined the most in 11 months - falling 0.1% in July, while unemployment claims rose last week.
Today's main focus and event risk for the U.S Dollar, will be the pending inflation report from the United States Federal Reserve, which should offer fresh clues on the pace of monetary tightening. Although the Greenback has maintained its post NFP gains this week, the overall price action suggests that market players are still hesitant to purchase the currency. Investors need more convincing over the possibility of higher US interest rates this year and this should come in the form of rising inflation. With concerns over stubbornly low inflation weighing heavily on the prospect of another US interest rate increase, the pending US CPI data will be in sharp focus. A soft inflation figure below market consensus, is likely to quell expectations of higher US interest rates, ultimately pressuring the Dollar.