
Sample Category Title
Trade Idea Wrap-up: GBP/USD – Stand aside
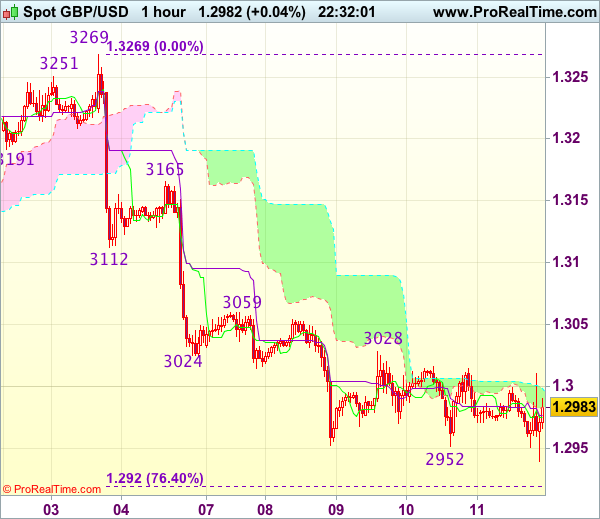
GBP/USD - 1.2981
Most recent candlesticks pattern : N/A
Trend : Near term down
Tenkan-Sen level : 1.2986
Kijun-Sen level : 1.2983
Ichimoku cloud top : 1.3003
Ichimoku cloud bottom : 1.2996
New strategy :
Stand aside
Position : -
Target : -
Stop : -
Despite falling marginally to 1.2940 in NY morning, lack of follow through selling and the subsequent rebound suggest further consolidation would take place and another bounce to 1.3025-30 cannot be ruled out, however, reckon upside would be limited to resistance at 1.3059 and price should falter below 1.3085-90 and bring another decline later.
On the downside, below said support at 1.2940 would signal recent fall from 1.3269 top has resumed and extend weakness to previous chart support at 1.2933 but reckon 1.2900 would hold from here, risk from there has increased for a rebound to take place later. As near term outlook is still mixed, would be prudent to stand aside for now.
Trade Idea Wrap-up: EUR/USD – Hold long entered at 1.1790
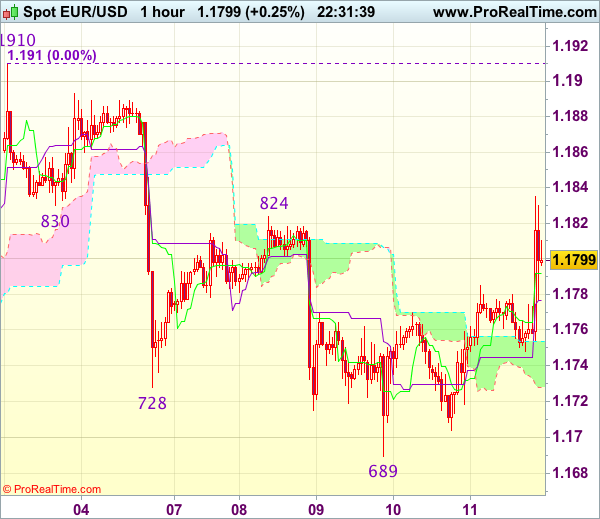
EUR/USD - 1.1795
Most recent candlesticks pattern : N/A
Trend : Near term up
Tenkan-Sen level : 1.1792
Kijun-Sen level : 1.1777
Ichimoku cloud top : 1.1754
Ichimoku cloud bottom : 1.1728
Original strategy :
Bought at 1.1790, Target: 1.1890, Stop: 1.1755
Position : - Long at 1.1790
Target : - 1.1890
Stop : - 1.1755
New strategy :
Hold long entered at 1.1790, Target: 1.1890, Stop: 1.1755
Position : - Long at 1.1790
Target : - 1.1890
Stop : - 1.1755
Current rally in NY morning adds credence to our view that low has been formed at 1.1689 earlier this week and further gain to 1.1850, then 1.1880 would be seen, however, a firm break above latter level is needed to confirm correction from 1.1910 top has ended, bring retest of this level, break there would signal early upmove has resumed and extend headway towards 1.1940-50 first.
In view of this, we are holding on to our long position entered at 1.1790. Only below support at 1.1748 would defer and risk weakness to 1.1720, however, downside should be limited to 1.1700 and support at 1.1689 should remain intact, bring another rally next week.
Trade Idea Wrap-up: USD/JPY – Sell at 109.70
USD/JPY - 109.13
Most recent candlesticks pattern : N/A
Trend : Near term down
Tenkan-Sen level : 109.07
Kijun-Sen level : 109.22
Ichimoku cloud top : 110.20
Ichimoku cloud bottom : 109.85
Original strategy :
Sell at 109.50, Target: 108.50, Stop: 109.85
Position : -
Target : -
Stop : -
New strategy :
Sell at 109.70, Target: 108.70, Stop: 110.05
Position : -
Target : -
Stop : -
As the greenback has fallen again after brief recovery and fell to a fresh 4-month low in NY morning, adding credence to our view that recent decline is still in progress and bearishness remains for weakness to 108.50, then towards previous chart support at 108.13, however, loss of near term downward momentum should prevent sharp fall below there and reckon 108.00 would hold on first testing.
In view of this, would not chase this fall here and would be prudent to sell dollar on recovery as previous support at 109.54 should turn into resistance and limit dollar’s upside. Above the lower Kumo (now at 109.85) would risk test of indicated resistance at 110.18 but break there is needed to abort and signal recent decline has ended and risk a stronger rebound to 110.50 but price should falter below another previous resistance at 110.83.

GBP/USD Mid-Day Outlook
Daily Pivots: (S1) 1.2946; (P) 1.2980; (R1) 1.3011; More...
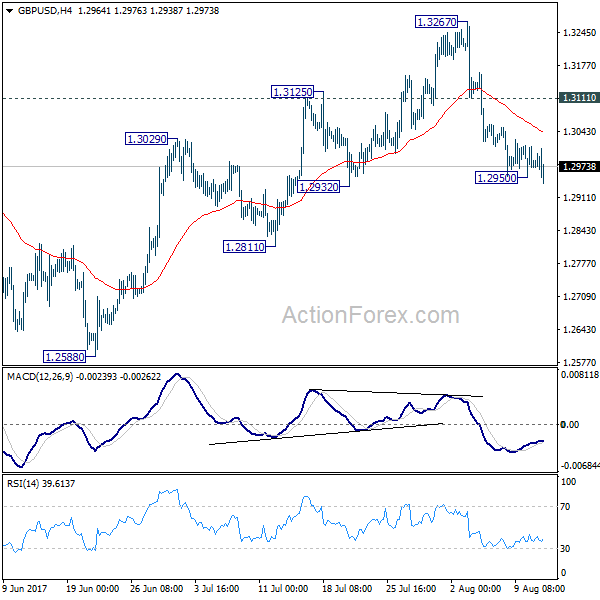
Breach of 1.2950 suggests that GBP/USD's fall from 1.3267 is resuming. Intraday bias is back on the downside. . As noted before, price actions from 1.1946 are seen as a corrective pattern and could have completed at 1.3267. Break of 1.2932 will affirm this bearish case and target 1.2588 key near term support for confirmation. However, break of 1.3111 resistance will turn bias back to the upside for retesting 1.3267 high.
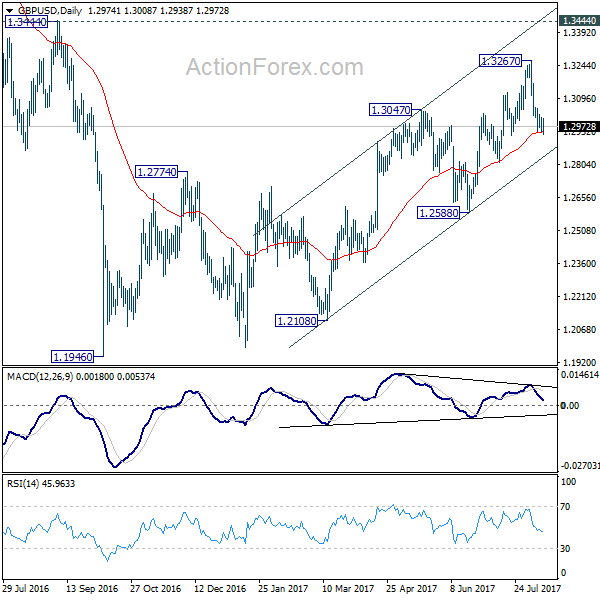
In the bigger picture, overall, price actions from 1.1946 medium term low are seen as a corrective pattern that is still in progress. While further upside is expected, larger outlook remains bearish as long as 1.3444 key resistance holds. Down trend from 1.7190 (2014 high) is expected to resume later after the correction completes. And break of 1.2588 will indicate that such down trend is resuming.
USD/CHF Mid-Day Outlook
Daily Pivots: (S1) 0.9603; (P) 0.9639; (R1) 0.9660; More...
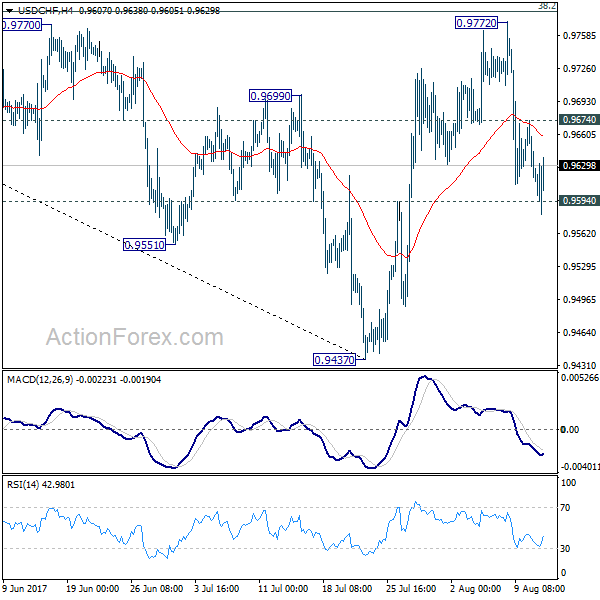
USD/CHF breached 0.9594 support but quickly recovered. Intraday bias stays neutral first. Outlook is a bit mixed as the pair is bounded inside medium term falling channel. The pair was also limited below 38.2% retracement of 1.0342 to 0.9437 at 0.9783. Firm break of 0.9594 will dampen our bullish view and turn bias back to the downside for 0.9437. This could also extend the fall through 1.0342 through 0.9437/43 key support level. On the upside, above 0.9772 will revive the bullish case of reversal and turn bias back to the upside.
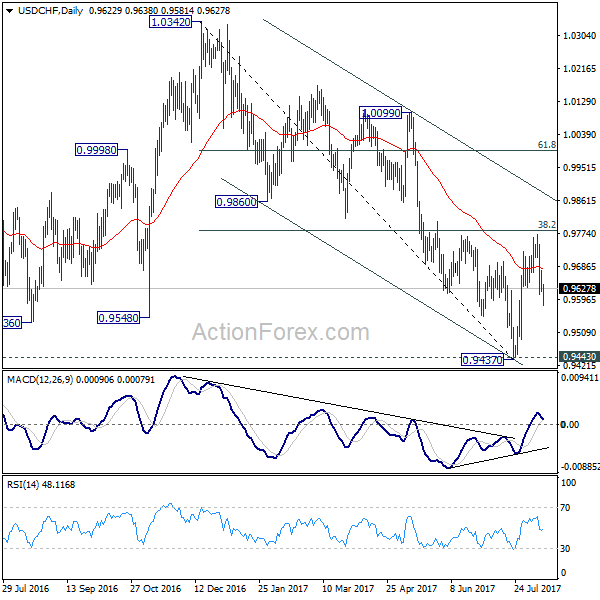
In the bigger picture, current development argues that USD/CHF has successfully defended 0.9443 key support level. And long term range trading in 0.9443/1.0342 is extending with another rise. At this point, there is no sign of an up trend yet. Hence, while further rise is expected in USD/CHF, we'll start to be cautious on loss of momentum above 61.8% retracement of 1.0342 to 0.9437 at 0.9996.
USD/JPY Mid-Day Outlook
Daily Pivots: (S1) 108.84; (P) 109.51; (R1) 109.87; More...
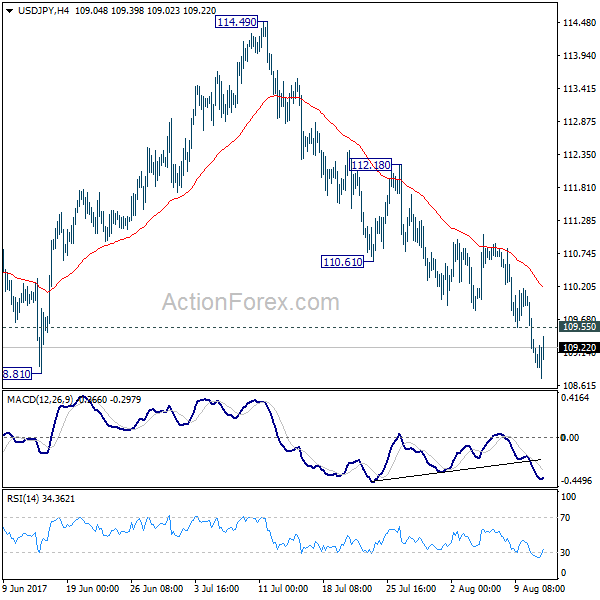
Intraday bias in USD/JPY remains on the downside for the moment. Firm break of 108.81 support will resume whole correction from 118.65 and target 61.8% retracement of 98.97 to 118.65 at 106.48. On the upside, above 109.55 minor resistance will turn intraday bias neutral first. But near term outlook will remain bearish as long as 110.61 support turned resistance holds.
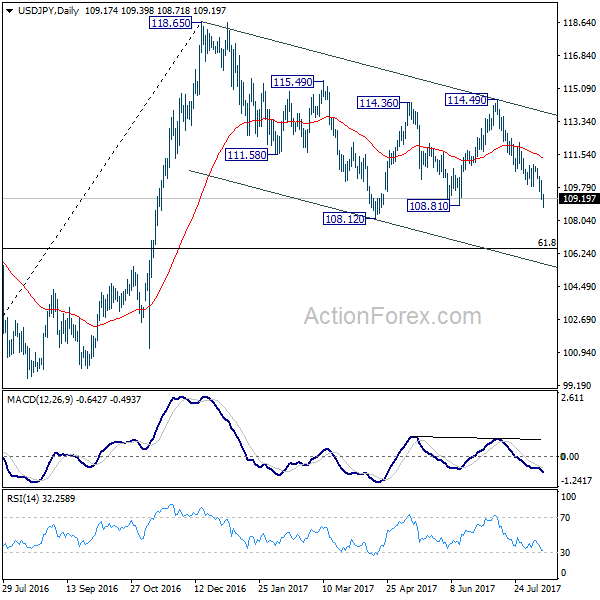
In the bigger picture, the corrective structure of the fall from 118.65 suggests that rise from 98.97 is not completed yet. Break of 118.65 will target a test on 125.85 high. At this point, it's uncertain whether rise from 98.97 is resuming the long term up trend from 75.56, or it's a leg in the consolidation from 125.85. Hence, we'll be cautious on topping as it approaches 125.85. If fall from 118.65 extends lower, down side should be contained by 61.8% retracement of 98.97 to 118.65 at 106.48 and bring rebound.
EUR/GBP Mid-Day Outlook
Daily Pivots: (S1) 0.9027; (P) 0.9051; (R1) 0.9095; More
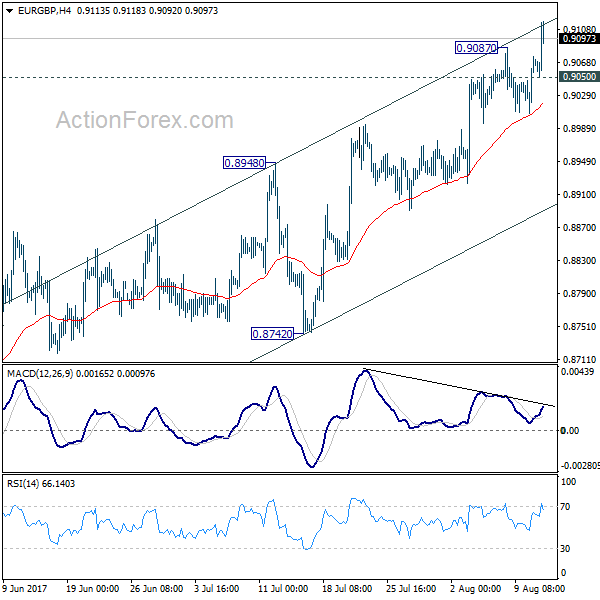
EUR/GBP's rally resumed by breaking 0.9087 and intraday bias is turned back to the upside. Current rise from 0.8312 should be targeting 0.9304 key resistance. At this point, there is no clear sign of up trend resumption yet. Hence, we'll be cautious on strong resistance from 0.9304 to limit upside and bring another fall. On the downside, below 0.9050 minor support will turn intraday bias neutral first. But further rise will remain in favor as long as 0.8948 resistance turned support holds.
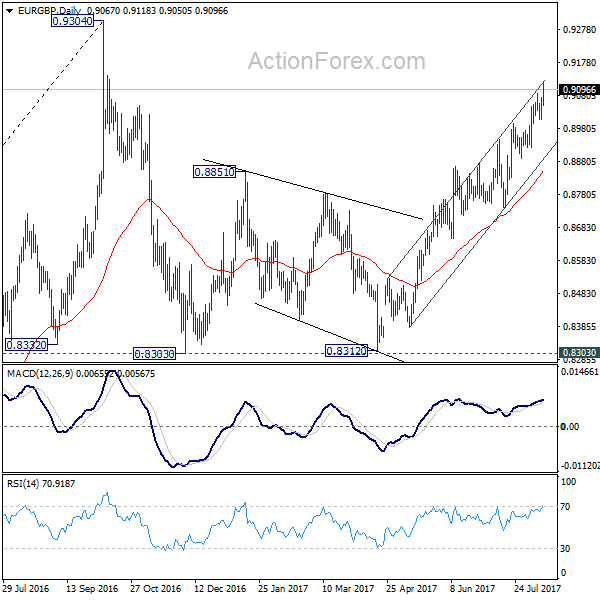
In the bigger picture, price actions from 0.9304 are viewed as a medium term corrective pattern. It's uncertain whether it is finished yet. But in case of another fall, we'd expect strong support from 0.8116 cluster support (50% retracement of 0.6935 to 0.9304 at 0.8120) to contain downside and bring rebound. Whole up trend from 0.6935 is expected to resume after consolidation from 0.9304 completes.
Canadian Dollar Improves as U.S. CPI Reports Miss Estimates
The Canadian dollar has posted considerable gains in Friday's North American session. Currently, USD/CAD is trading at 1.2679, down 0.50% on the day. On the release front, US CPI and Core CPI posted weak gains of 0.1%, shy of their estimates of 0.2%. There are no Canadian events on the schedule. Later in the day, we'll hear from two FMOC members, Dallas Fed President Robert Kaplan and Minneapolis Fed President Neel Kashkari.
More US inflation numbers, more disappointment for the markets. Consumer Price Index reports in June underscored a soft inflation picture, as both CPI and Core CPI showed negligible gains of 0.1%. This follows a 0.1% decline in the Producer Price Index for June. The persistently soft inflation indicators may hamper plans by the Federal Reserve to raise rates, as some FOMC members continue to advocate against a rate increase until inflation climbs closer to the Fed's inflation target of 2%. However, inflation is not showing any signs of moving higher, which means that a December rate hike remains very much in doubt.
Global markets remain jittery over rising tensions between North Korea and the US. With the war of words escalating between the two countries, global markets are down, as investors have dumped shares in favor of safe-haven assets, such as the Japanese yen and gold. North Korea has vowed to retaliate over new sanctions imposed by Washington and has threatened to attack Guam, which is a major US military base. President Trump and North Korean President Kim Jong-un are on a possible collision course, which has caused alarm in South Korea and Japan, strong allies of the US. The present situation is being compared to the Cuban Missile crisis, and although the likelihood of actual hostilities breaking out remains small, the crisis has reached levels where the markets cannot ignore it.
In contrast to the uncertainty over the Fed's monetary plans, the Bank of Canada is leaning towards further tightening, possibly before the end of 2017. The bank raised interest rates in July and the odds of a rate increase in October are at 78 percent. In May, annualized GDP was up 4.6%, and the labor market continues to produce jobs. The increase in oil prices has revived the economy has also pushed the Canadian dollar higher. At the same time, similar to the situation in the US, inflation remains subdued, despite a stronger economy and an improving labor market. The lack of inflation could cause the Federal Reserve to abandon plans for another rate hike this year, and this could also lead to the BoC deciding to delay a rate hike until inflation moves higher.
US Inflation Showed More Tentative Signs of Stabilization in July
Highlights:
- The all items index inched up 0.1% in July with the year-over-year rate also ticking up to 1.7% from 1.6% in June.
- Consumer prices excluding food and energy rose 0.1% for a fourth straight month. The year-over-year rate of core inflation was unchanged for a third straight month at 1.7%.
- Wireless phone services prices were down 13% year-over-year, marking the fifth straight month of double digit declines. The drop adds up to a ~0.2 percentage point drag on headline inflation.
Our Take:
The headline year-over-year rate ticked up to 1.7% after declining for four straight months to 1.6% in June. Excluding food and energy products, the year-over-year rate held steady at 1.7% for a third straight month. The concern around inflation year-to-date has, arguably, been more the deceleration in core price growth than the rate itself which is still just modestly below the Federal Reserve's 2% inflation objective. In that respect, stabilization in recent months should provide further reassurance to the Fed that underlying price growth is not entering a fundamentally slowing trend. Indeed, as the Fed has noted, the core rate would be higher if not for a number of transitory factors, including a sharp decline in telecommunications prices last March that will continue to bias the year-over-year growth rate lower until it falls out of the annual calculation next year in March 2018.
On the other hand, there is also little sign that upward inflation pressures are building. That is allowing the Fed to remain very cautious in withdrawing monetary policy stimulus despite an economy that looks strong enough to withstand further rate hikes. We look for the Fed to announce plans to begin shrinking their balance sheet in September, holding off on a rate hike at that time to gauge the market impact of tapering. That brief pause should give policymakers some time reassess the trend in inflation ahead of what we expect will be another rate increase in December.
Dollar Soldoff after Weak CPI Readings, Trump Tweets Military Solutions Locked and Loaded
Dollar suffers selloff against most major currencies except Sterling after slightly weaker than expected CPI data. But it's Euro that really shines in early US session, extending recent rally against Sterling and is trying to rebound against Yen and Swiss Franc. That could be technical driven as both EUR/JPY and EUR/CHF are close to near term fibonacci support. Still, for the week as a whole, Yen and Swiss Franc are still trading as the strongest currencies. Commodity currencies and Sterling will likely end as the weakest on risk aversion.
Trump Tweets: Military solutions are now fully in place, locked and loaded
US-North Korea tension remain the main focus of the markets and traders are getting more cautious ahead of the weekend. US President Donald Trump continues his verbal combat and tweets today that "military solutions are now fully in place, locked and loaded, should North Korea act unwisely. Hopefully Kim Jong Un will find another path!" Trump warned yesterday that "they should be very nervous, because things will happen to them like they never thought possible, OK?"
China issues formal statement: Hopes that all relevant parties will be cautious on their words and actions
On the other hand, China Foreign Ministry spokesman Geng Shuang said in a formal statement. "The current situation on the Korean Peninsula is complicated and sensitive." And "China hopes that all relevant parties will be cautious on their words and actions, and do things that help to alleviate tensions and enhance mutual trust, rather than walk on the old pathway of taking turns in shows of strength, and upgrading the tensions."
RBA Lowe: Next move will be up rather than down
RBA Governor Philip Lowe told the parliament today that the next move in interest rate will be "up rather than down", but that is "quite some time away". He referred to market pricing that "implies greater probability of a rate rise than a rate reduction". Also, another implication is that "the next move in interest rates is a long way out". Lowe said they're "both reasonable assumptions". Meanwhile, he also pointed to the high exchange rate as having negative impact on the outlook. He noted that "further appreciation, all else constant, would cause a slower pick-up in inflation and slower progress in reducing unemployment."
US CPI disappointing
US headline CPI rose merely 0.1% mom in July, below expectation of 0.2% mom. On annual basis, headline CPI climbed to 1.7% yoy, up from 1.6% yoy but missed expectation of 1.8% yoy. Core CPI rose 0.1% mom, below expectation of 0.2%. On annual basis, core CPI was unchanged at 1.7% yoy, in line with consensus.
Released earlier today, German CPI was finalized at 0.4% mom, 1.7% yoy in July. New Zealand business NZ manufacturing index dropped to 55.4 in July.
EUR/JPY Mid-Day Outlook
Daily Pivots: (S1) 128.01; (P) 128.78; (R1) 129.33; More...
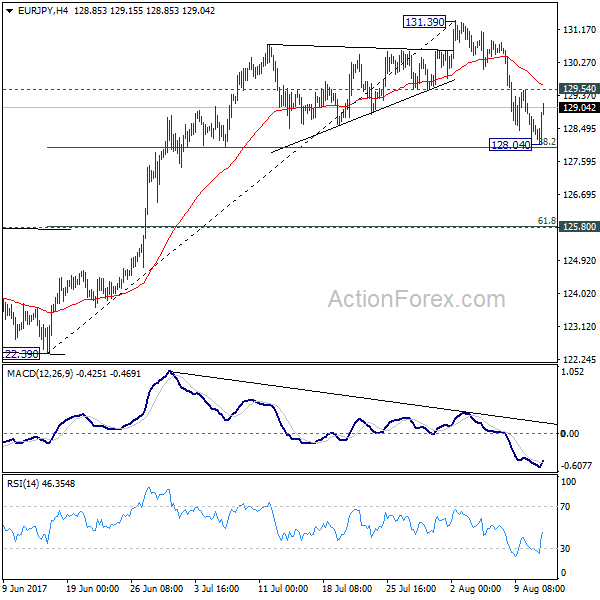
EUR/JPY formed a temporary low at 128.04 and recovered. The cross is drawing support from 38.2% retracement of 122.39 to 131.39 at 127.95 as we expected. Intraday bias is turned neutral first. On the upside, break of 129.54 minor resistance will argue that pull back from 131.39 is completed. In such case, intraday bias will be turned back to the upside for retesting 131.39. However, sustained break of 127.95 will bring deeper decline to 125.80 cluster support (61.8% retracement at 125.82) before completing the correction.
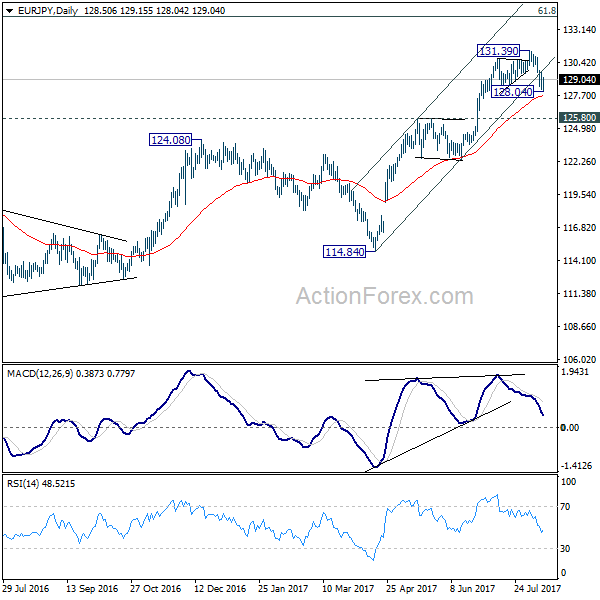
In the bigger picture, the down trend from 149.76 (2014 high) is completed at 109.03 (2016 low). Current rally from 109.03 should be at the same degree as the fall from 149.76 to 109.03. Further rise is expected to 61.8% retracement of 149.76 to 109.03 at 134.20. Sustained break there will pave the way to key long term resistance zone at 141.04/149.76. Medium term outlook will remain bullish as long as 124.08 resistance turned support holds.
Economic Indicators Update
| GMT | Ccy | Events | Actual | Forecast | Previous | Revised |
|---|---|---|---|---|---|---|
| 22:30 | NZD | Business NZ Manufacturing Index Jul | 55.4 | 56.2 | 56 | |
| 06:00 | EUR | German CPI M/M Jul F | 0.40% | 0.40% | 0.40% | |
| 06:00 | EUR | German CPI Y/Y Jul F | 1.70% | 1.70% | 1.70% | |
| 12:30 | USD | CPI M/M Jul | 0.10% | 0.20% | 0.00% | |
| 12:30 | USD | CPI Y/Y Jul | 1.70% | 1.80% | 1.60% | |
| 12:30 | USD | CPI Core M/M Jul | 0.10% | 0.20% | 0.10% | |
| 12:30 | USD | CPI Core Y/Y Jul | 1.70% | 1.70% | 1.70% |