Sample Category Title
Global Selloff on US-North Korea Tensions, Markets Starting to Price in Fed Cut
Risk aversion dominated the markets last week as tension between US and North Korea suddenly intensified on verbal exchanges of the leaders. DOW initial made new record high at 22179.11 but ended the week down -234.49 pts or -1.06% at 21858.32. S&P 500 closed down -35.51 pts or -1.43% at 2441.32. European indices were harder hit with DAX closed down -283.66 pts or -2.31%. FTSE closed down -201.75 pts or -2.69%. Japan was on holiday on Friday but Hong Kong HSI closed the week down -2.46%. US yields was further hit by tame CPI and PPI data with 10 year yield closed at 2.189, taking out 2.225 near term support decisively. In the currency markets, Yen and Swiss Franc ended as the strongest ones on risk aversion. Commodity currencies ended as the weakest ones, followed by Sterling. Gold surged on risk aversion and Dollar weakness and closed up 2.4% at 1295. WTI crude oil traded like a passerby and struggled to regain 50 on another attempt.
Fed fund futures pricing in 4.1% of September cut
A key takeaway from last week's development is the drastic change in Fed interest rate expectations. Risk aversion and tame inflation readers are factors contributing to the change. Also, markets keeps wondering when US President Donald Trump is going to put his focus back on the economy. Fed fund futures priced in 0% chance of a rate hike in September, that's expected. But the surprise is that they're now pricing in 4.1% chance of a rate cut in September, something that we haven't seen for some time. Meanwhile, the odds for December hike dropped to 35.9% only, comparing to 46% a week ago.
10 year yield heading back to 2.103/30 support zone
The change in market expectations is also clearly reflected in weakness in yield and Dollar. 10 year yield (TNX) dropped through 2.225 key near term support last week should be heading back to 2.103 cluster support level (38.2% retracement of 1.336 to 2.621 at 2.130. The mild downside acceleration now makes 2.103/30 quite vulnerable. We could see TNX drop further to 50% retracement at 1.9785 before completing the correction from 2.621.
Dollar index risk breaking 91.91/3 key support
Dollar's recovery was limited well below 94.28 resistance and weakened again. More decline would be seen in near term with focus back on 91.91/3 cluster support (38.2% retracement of 72.69 to 103.82 at 91.93). At this point, we'd expect strong support from there to contain downside and bring rebound. But a firm break will extend the whole correction from 103.82 to 50% retracement at 88.25 and below.
Still early to call reversal in DOW
Risk sentiment will be the main theme in the markets this week and that will be the main factor to determine which currencies will perform best. 22179.11 is clearly a short term top in DOW. Friday's mild recovery only indicates stabilization, not bottoming. Deeper fall is expected in near term. But still, it's too early to call for a trend reversal yet. Focus will be on 55 day EMA (now at 21535.63) and 38.2% retracement of 20379.55 to 22179.11 at 21491.67. The up trend is still intact as long as this levels hold and another record high is in favor. However, firm break there will indicate that fall from 22179.11 is developing into a medium term correction for support zone at 20379.55/21169.11.
DAX likely in medium term correction
On the other hand, DAX is now more likely in a medium term correction already. That, is a medium term top is formed at 12951.54 on bearish divergence condition in daily MACD. And, this is supported by the break of channel support. Near term outlook will remain bearish as long as 12336.00 resistance holds. Break of 11941.57 support should confirm this bearish view and bring DAX lower to 38.2% retracement of 8699.29 to 12951.54 at 11327.18 before finding a bottom.
FTSE headling back to 7096 key support
FTSE's sharp fall last week and breach of 7302.71 key near term support suggests that the correction from 7598.99 medium term top is resuming. Further decline would now be seen back to 7096.83 support first. Decisive break there will confirm that fall from 7598.99 is a medium term decline and will drag it to 38.2% retracement of 5499.50 to 7598.99 at 6796.98 next.
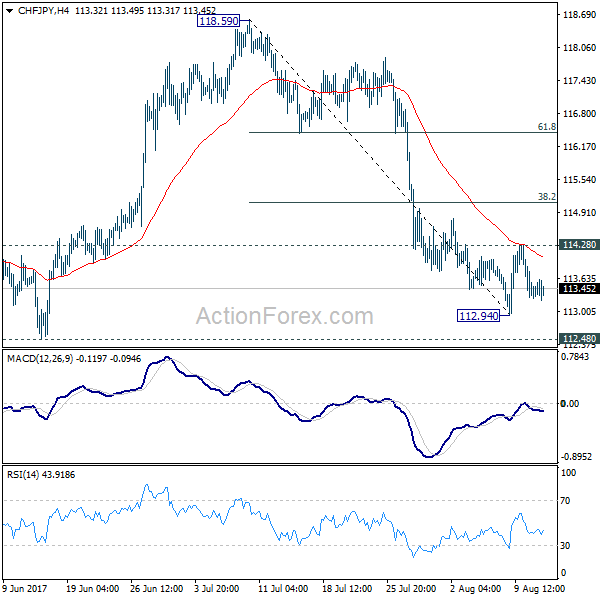
Rebound in CHF/JPY disapppointing
Based on the above analysis, risk aversion will likely continue in near term. Yen and Swiss Franc would be the ones that benefit most. We've pointed out the possibility of near term reversal in CHF/JPY during the week but the rebound from 112.94 was quite disappointing. The cross was rejected from 4 hour 55 EMA and weakened again. Initial bias will now stays neutral this week first. But considering that CHF/JPY is close to key support level at 112.48, with diminishing downside momentum, we'd still expect bottoming zone. Break of 114.28 resistance will affirm the case of reversal and target 38.2% retracement of 118.59 to 112.94 at 115.09.
Trading strategy: Close GBP/USD short, sell NZD/JPY on recovery
Regarding trading strategy, we sold GBP/USD at 1.3030 at open last week. The idea against Sterling was not too bad but Dollar clearly didn't have the momentum to sustain it's rebound. As Dollar index is now expected to resume it's recent decline, we will just close the position at market open this week first. Hopefully, we'd still be able to pocket a little bit of profit.
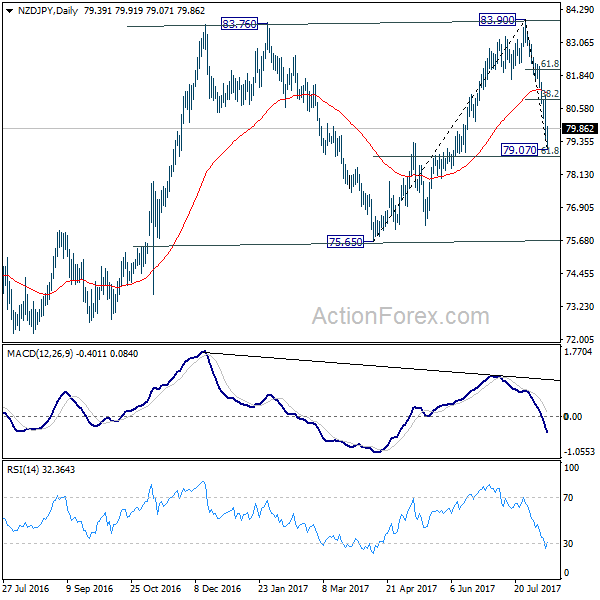
Instead, we'll look into selling NZD/JPY this week. Kiwi suffered some selloff last week as RBNZ heightened warning of the exchange rate. And as noted above, we're expecting further Yen strength in near term. There is much room for the decline from 83.90 to extend back to 75.65 support. Nonetheless, since NZD/JPY should have past its immediate selling climax after hitting 79.07, we'll try to sell it on recovery 80.85. 80.85 is slightly below 38.2% retracement of 83.90 to 79.07 at 80.91. Stop will be placed at 82.10, slightly above 61.8% retracement at 82.05. 75.65 will be the target.
EUR/USD Weekly Outlook
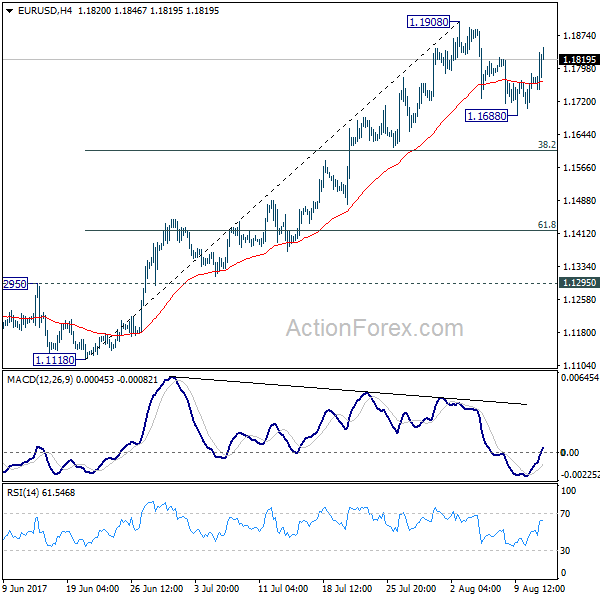
EUR/USD's pull back from 1.1908 extended to 1.1688 last week but recovered since then. With 1.1908 resistance intact, initial bias remains neutral this week for some more consolidations first. In case of another fall, downside should be contained by 38.2% retracement of 1.1119 to 1.1908 at 1.1606 to bring rebound. On the upside, break of 1.1908 will extend recent up trend to 1.2042 long term support turned resistance next.
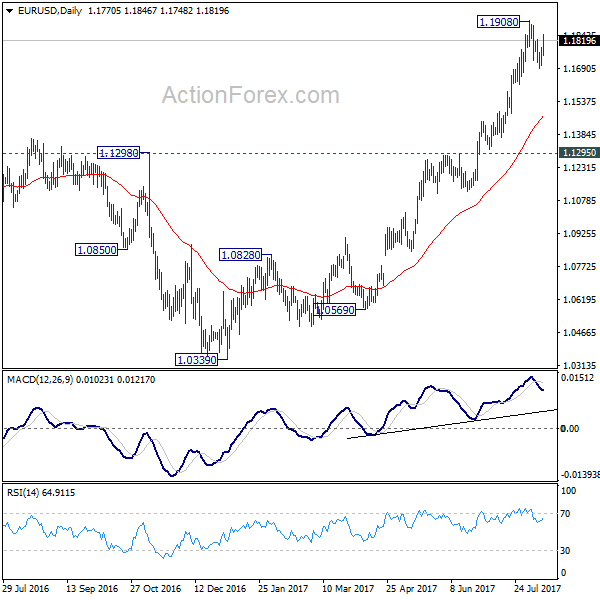
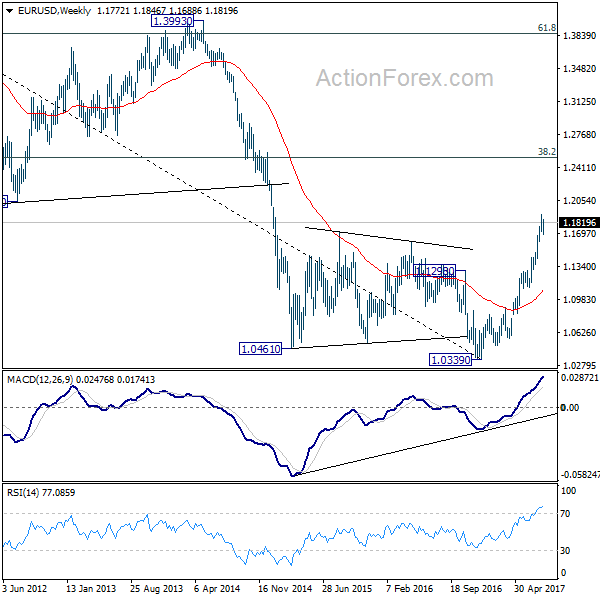
In the bigger picture, an important bottom was formed at 1.0339 on bullish convergence condition in weekly MACD. Sustained trading above 55 month EMA (now at 1.1768) will pave the way to key fibonacci level at 38.2% retracement of 1.6039 (2008 high) to 1.0339 (2017 low) at 1.2516. While rise from 1.0339 is strong, there is no confirmation that it's developing into a long term up trend yet. Hence, we'll be cautious on strong resistance from 1.2516 to limit upside. But for now, medium term outlook will remain bullish as long as 1.1295 support holds, in case of pull back.
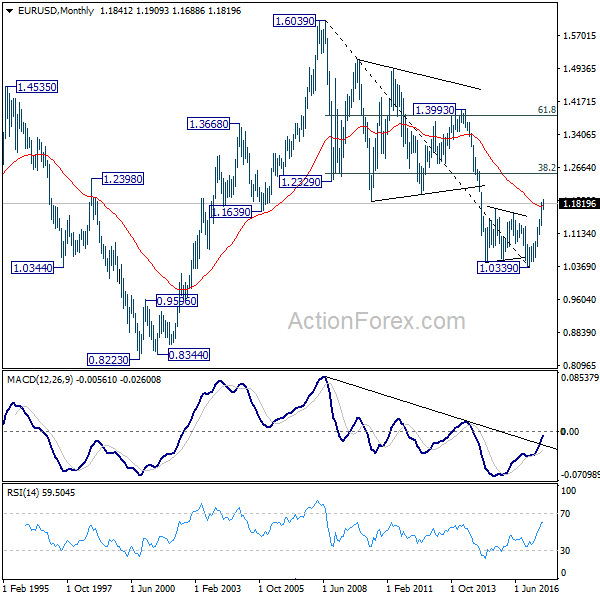
In the long term picture, 1.0339 is now seen as an important bottom as the down trend from 1.6039 (2008 high) could have completed. It's still early to decide whether price action form 1.0339 is developing into a corrective or impulsive move. But in either case, further rally would be seen to 38.2% retracement of 1.6039 to 1.0339 at 1.2516
Eco Data 8/18/17
[php_everywhere] [/php_everywhere]
Eco Data 8/17/17
[php_everywhere] [/php_everywhere]
Eco Data 8/16/17
[php_everywhere] [/php_everywhere]
Eco Data 8/15/17
[php_everywhere] [/php_everywhere]
Eco Data 8/14/17
[php_everywhere] [/php_everywhere]
Summary 8/14 – 8/18
Monday, Aug 14, 2017
[php_everywhere] [/php_everywhere]
Tuesday, Aug 15, 2017
[php_everywhere] [/php_everywhere]
Wednesday, Aug 16, 2017
[php_everywhere] [/php_everywhere]
Thursday, Aug 17, 2017
[php_everywhere] [/php_everywhere]
Friday, Aug 18, 2017
[php_everywhere] [/php_everywhere].
Weekly Economic and Financial Commentary: Fed to Keep Waiting for Inflation to Firm
U.S. Review
Inflation Still Soft in July
- The economic calendar was on the sparse side this week, the most important item being this morning's CPI update on the inflation picture, which was softer than expected.
- Fresh productivity data for the second quarter continued to show a sluggish trend, though it did pick up from Q1. Compensation growth slowed and is declining on an annual basis.
- Strong labor demand was highlighted by the all-time high level of job openings in the June JOLTS report.
Fed to Keep Waiting for Inflation to Firm
The economic calendar was on the lighter side early this week, as most of the focus was on this morning's CPI release to provide an indication of whether the inflation data will start to come in more supportive of the FOMC's goals. Consensus had estimated prices increased at a 0.2 percent pace in July, for both the headline and core CPI. The print came in softer than forecasted for the fourth consecutive month, as both headline and core rose 0.1 percent in July. Both are up 1.7 percent year-over-year. The report did color the inflation story in a few different lights. First, the continued misses suggest that the weakness in inflation is not as transitory as some had posited. The Fed is still likely to push forward with balance sheet reduction in September, but it does not yet have the "all clear" signal from the economic data for a December interest rate hike. Second, the details of the July CPI release were somewhat less disheartening than in June. Prices increased for apparel and recreation after falling in June, and food/beverage prices were up after June's flat reading. Prices continued to decline for energy and transportation, but at a slower pace. We doubt the Fed will change course just yet. A stronger print today would have given the Fed breathing room, but there are plenty of data points between now and December to navigate.
The unexpected decline in producer prices in July, released on Thursday, heightened the anticipation for the CPI reading. The PPI for final demand fell 0.1 percent on broad-based weakness, most notably a huge drop in margins for chemical wholesaling. PPI tends to be volatile month to month, but the report did little to suggest price pressures are building down the pipeline.
The June JOLTS report reinforced that demand for U.S. labor is strong, as the number of job openings was at its highest level of the series at the end of the month. Fewer hires took place in June than in May, though much of that decline was in the Northeast, as hiring increased in most of the other regions of the country. There were also fewer separations from employment due to a smaller number of workers quitting their jobs in June. The quit rate has been oscillating between 2.1 percent and 2.2 percent every other month this year; 2.2 percent is the upper bound of the current cycle and 2.3 percent is the high point of the prior cycle. It will be interesting to watch in the coming months whether that rate breaks out in either direction. As an increase in the quit rate would support an increase in average hourly earnings, the fact that the quit rate has been "stuck" this year may help explain the disappointing wage growth we have seen.
Judging by the high number of open positions, the demand for workers is there and to fill them, we will need either more people to quit their current jobs or entice more workers to enter the labor force. The trend in productivity growth remains sluggish. The rate of nonfarm output and hours worked increased slightly more than expected in the second quarter at a 0.9 percent annualized rate. The year over year growth of 1.2 percent remains below even the tepid trend of the current cycle. Until we see a breakthrough on the productivity front, our economy is likely to expand at a 2-2.5 percent pace.
U.S. Outlook
Retail Sales • Tuesday
Retail sales posted a disappointing 0.2 percent decline in June amid broad-based declines in sales. While softer prices for consumer goods including gasoline likely played a role in holding back the nominally reported number, there were signs of weakness in consumer demand. The closely watched control group, which feeds into the calculation for GDP, declined 0.1 percent. With gasoline prices trending higher over the last month, we suspect that somewhat higher inflation helped to boost headline retail sales to 0.3 percent in July. Excluding automobile sales, we expect sales increased 0.3 percent for the month. With a continued modest pace of both inflation and real consumer spending, we expect retail sales will average roughly 3 percent in the second half of this year. Real consumer spending is forecasted to expand at a 2.3 percent pace over the third and fourth quarters of this year.
Previous: -0.2% Wells Fargo: 0.3% Consensus: 0.4% (Month-over-Month)
Housing Starts • Wednesday
Housing starts rose 8.3 percent in June to a 1.215 million-unit pace. With unseasonably warm weather to start the year, June's increase marked the first positive reading for starts since February of this year. As can be seen in the graph to the left, the story has been a steady but gradual improvement in single family starts, but multifamily starts have begun to decelerate in the wake of a multiyear surge in apartment market building. Looking ahead to July's reading, we expect another modest improvement in housing starts for the month with an increase of 1.2 percent to a 1.229 million unit pace. As we look ahead to the second half, we estimate that housing starts will total 1.24 million 2017 and improve to a 1.32 million unit pace in 2018 as single-family building activity begins to pick up amid a tight supply of existing homes.
Previous: 1215K Wells Farg
Industrial Production • Thursday
Industrial production rose 0.4 percent in June as both manufacturing and mining overcame a decline in utilities output. Mining activity has played an outsized role in holding back industrial production growth since the middle of 2015, a trend that has reversed over the past few quarters. Another factor that has adversely affected industrial output has been the very weak pace of manufacturing output, held back in part due to soft global growth. With mining activity improving and global economic data beginning to surprise to the upside, we are marginally more positive on the outlook for industrial production. We expect industrial output rose 0.4 percent in July. In the second half, we expect output will expand at an average of 2.5 percent on an annualized basis. If current trends hold, 2017 will mark the first year-over-year growth in industrial output since 2014.
Previous: 0.4% Wells Fargo:
Global Review
Recent Economic Developments in South Korea
- The South Korean economy has expanded at a steady, albeit slow pace, over the past few years, and we expect the expansion to continue through the end of 2018. Rising tensions with North Korea clearly represent an immediate downside risk to the South Korean economic outlook.
- The build-up in leverage in the household sector represents a longer-term risk to the South Korean economic outlook. Although we do not look for the central bank to be "jacking up" rates anytime soon, growth in consumer spending could be depressed once a higher interest rate environment finally comes to pass.
Recent Economic Developments in South Korea
With tensions rising this week between the United States and North Korea, we thought we would take the opportunity to provide readers with an update on the South Korean economy. Measured at current exchange rates, South Korea had the 11th largest economy in the world in 2016 with nominal GDP equivalent to $1.4 trillion. As has been the experience of most economies, South Korea has experienced a slower rate of economic growth in recent years with real GDP growing at an annual average rate of only 2.8 percent between 2012 and 2016. We project that the economic expansion in South Korea will continue for the foreseeable future with real GDP growing 2.9 percent in 2017 and 2.8 percent next year. Of course, a war on the Korean peninsula, should one come to pass, would have profound effects on our growth forecasts.
Growth in the rest of the world is important for the South Korean economy because real exports of goods and services are equivalent to about 55 percent of GDP. China takes in one-quarter of South Korea's exports, making it South Korea's most important export market by a wide margin. So, economic deceleration in China since the beginning of the decade has exerted a slowing effect on the South Korean economy. However, South Korea has also experienced deceleration in its productive capacity as growth in its working-age population has slowed in recent years. The unemployment rate has trended up from about 3 percent or so in 2014 to its present rate of 3.8 percent, which is high by South Korean standards.
This slow growth environment has depressed rates of CPI inflation in South Korea (top chart). Consequently, the Bank of Korea cut its main policy rate from 3.25 percent in mid-2012 to 1.25 percent today. The combination of lower rates in South Korea in conjunction with expectations of higher U.S. rates caused the Korean won to depreciate nearly 20 percent versus the U.S. dollar between mid-2014 and early 2016 (middle chart). The won has recouped some of its losses over the past year, but it could come under downward pressure again if tensions between the United States and North Korea escalate further. Indeed, the won fell versus the greenback this week as tensions rose.
Clearly, a confrontation with the North represents a clear and immediate downside risk to the South Korean economy. A buildup of financial leverage represents a longer-term economic risk. The debt-to-GDP ratio in the non-financial corporate sector peaked ahead of the financial crisis in 1997-1998, and it has been stable on balance subsequently (bottom chart). However, the debt-to-GDP ratio of the household sector has trended up from about 40 percent in the early 1990s to more than 90 percent today. Although we do not look for the central bank to be "jacking up" rates anytime soon, growth in consumer spending could be depressed once a higher interest rate environment finally comes to pass.
Global Outlook
Japanese GDP • Monday
The Japanese economy has built some momentum of late, although on a relative basis growth remains softer in Japan than in most other advanced nations. An improved global growth environment has provided a boost; Japanese merchandise export volumes were up 4.0 percent year-over-year in June. Industrial production has followed, growing 4.9 percent over the same period.
If Q2 real GDP growth is positive, as we expect, this would be the sixth consecutive quarter of positive growth—the first time this has happened in Japan in more than a decade. Economic growth remains far from robust, however, and with consumer prices essentially flat over the past year, we believe the Bank of Japan will remain committed to its accommodative monetary policy measures for the foreseeable future.
Previous: 1.0% Wells Fargo: 2.2% Consensus: 2.5% (Quarter-over-Quarter, Annualized)
Chinese Industrial Production • Monday
Industrial production growth in China has stabilized since 2015 as policymakers have provided stimulus in the form of easier credit to support the economy. Combined with stronger demand abroad, industrial production and economic growth more broadly have been remarkably stable in China recently. Chinese consumption has also firmed against this backdrop. Data on retail sales in July, which also print next week, have grown at roughly an 11 percent year-over-year pace for most of the past year.
Chinese authorities are faced with the daunting task of deleveraging the non-financial corporate sector while also threading the needle on the government's economic growth target. Next week's indicator readings will likely show that economic activity in China was quite stable to start Q3, but we expect economic growth to slow gradually later this year and through 2018 as an aging population and high debt loads weigh on labor and capital growth.
Previous: 7.6% Consensus: 7.1% (Year-over-Year)
United Kingdom CPI • Tuesday
Monetary policymakers in the U.K. are among the few central bankers in the advanced world facing too fast, rather than too slow, inflation. CPI inflation has shot higher, at least in part, due to the marked depreciation of sterling in the wake of last year's Brexit referendum. Faster inflation and stagnant wage growth have taken a bite out of household's real disposable income, exerting some headwinds on consumer spending. Of the advanced economies for which we explicitly forecast economic growth, the U.K. economy is the sole one we expect to decelerate in 2017 relative to 2016.
The Monetary Policy Committee of the Bank of England (BoE) expects inflation to rise further in the coming months and to peak at around 3 percent in October before the inflationary pressure from the sterling's depreciation begins to fade. If the U.K. economy can achieve some modest strengthening over the next 18 months as we expect, the BoE could raise rates as soon as next spring.
Previous: 2.6% Wells Fargo: 2.5% Consensus: 2.7% (Year-over-Year)
Point of View
Interest Rate Watch
Net Treasury Issuance Update
In response to continued lower-thanexpected tax collections, we have increased our deficit estimate for the FY 2017 budget deficit to $700 billion and reduced our estimate for FY 2018 to $875 billion. The key factor behind our revision has been the consistent under-performance of both individual and corporate tax collections. As we wrote last month, in our view, the possibility of tax cuts next year has some individuals delaying the realization of capital gains taxes with the hope of a lower rate next year.
In light of our new budget deficit estimates and the latest information from the Treasury's Quarterly Refunding Statement, we now expect net Treasury issuance to total $685 billion for calendar year 2017 and $818 billion for calendar year 2018. While uncertainty remains about the potential for tax cuts next year and thus larger deficits, even in the absence of tax cuts we still expect larger budget deficits and thus higher net Treasury issuance next calendar year.
The story all year has been a paydown in the Treasury's cash balance after the reestablishment of the debt ceiling last March. This cash balance paydown has pulled T-bills off the market since Q2 of this year, a story we expect to continue in Q3. Given that the Treasury is still taking "extraordinary measures" to stay below the borrowing limit and because we do not expect the debt ceiling to be lifted until the middle or end of September, net Treasury issuance is expected to be light again in the third quarter at $96 billion with $105 billion in net interest-bearing issuance and a T-bill paydown of $9 billion. Looking ahead to the fourth quarter, we expect a large jump in net Treasury issuance on the other side of the debt ceiling increase. The Treasury is expected to replenish its cash balance in addition to financing a larger budget deficit in first quarter of the 2018 fiscal year (Q4 of the 2017 calendar year). We expect net Treasury issuance in Q4 of this calendar year to rise by $501 billion which, combined with our estimated budget deficit, would result in a December ending cash balance of $224 billion.
Credit Market Insights
Credit Standards Tightening in Q3
Last week, the Q3 Senior Loan Officer Survey was released. The report indicated a sense of caution among both consumer credit as well as business lending demand, with each slowing on the quarter.
The survey showed that banks' willingness to lend has decreased over the past five years, which matches the trend of each economic cycle since the 1980s. Coming out of the recession, banks were very willing to extend credit to consumers. However, as the cycle matures, banks begin to tighten lending; the current increase in auto and credit card delinquencies could be the driver behind the decreasing lending appetite of banks.
Consumer demand has also fallen at a steady pace since 2012, despite the historically tight labor market and employment figures. This indicates a sense of caution among individual consumers, and household debt service as a percentage of income currently sits at decade lows.
The net percent of banks reporting stronger demand from large and medium size firms dropped to -11.8 percent in Q3, indicating that demand among such firms has been weaker. This has been trending downward since 2014. This reduced appetite for debt among these firms may be driven by slowing final sales. With slower final sales growth, the need to expand inventory from its currently low levels has diminished. Without the need to expand inventory levels, the need for equipment financing has dropped concurrently.
Topic of the Week
U.S. Economy Has Low Sensitivity to Dollar
The trade-weighted value of the U.S. dollar has declined about 7 percent since the beginning of the year, and our currency strategy team looks for it to fall further on a trend basis in coming quarters. So, will this dollar depreciation have significant effects on the U.S. economy?
Probably not. Let's start with the effects of a weaker dollar on U.S. GDP growth. As shown in the top chart, there is an inverse correlation between growth in real exports and changes in the real value of the dollar. That is, as the dollar depreciates on a real basis, growth in real exports tends to strengthen and vice versa. However, the degree of correlation between these two variables is not all that high. The sensitivity of export growth is much higher for changes in foreign economic growth than it is to changes in the real value of the dollar. Furthermore, real exports of goods and services account for only 13 percent of U.S. GDP. The bottom line is that changes in the value of the dollar have little meaningful effect on the overall rate of U.S. real GDP growth.
Changes in the value of the dollar also have little meaningful effect on the rate of core CPI inflation in the United States (bottom chart). The degree of correlation between changes in the value of the dollar and changes in import prices is rather high. However, the U.S. economy is largely a service-based economy, and the vast majority of services are produced and consumed domestically. Consequently, changes in the value of the U.S. dollar do not have much effect on rates of overall U.S. CPI inflation. If the rate of dollar depreciation in coming quarters remains modest, which is our expectation, then CPI inflation is not likely to change much due solely to the effects of dollar depreciation.
The Weekly Bottom Line: Inflation Strengthens in Eurozone, But Stays Soft in U.S.
U.S. Highlights
- Markets this week have been largely driven by corporate earnings and political events, with tensions on the Korean Peninsula escalating to the point where markets can no longer ignore them.
- Inflation strengthened in the Eurozone, with prices growing by 0.13% in July and the year-over-year measure accelerating to 1.2% with strength particularly apparent in Germany and Spain.
- U.S. inflation surprised to the downside once again, with prices growing by 0.1% in July - or half the expected pace. Despite the soft CPI print and PPI figures, we expect inflation will strengthen somewhat in the coming months.
Canadian Highlights
- Canadian markets fell late in the week alongside their global counterparts as geopolitical tensions ratcheted up on the back of heated U.S.-North Korean rhetoric. Domestically, housing starts remained on an upward trend in July, but current headwinds suggest a slowing pace as the year progresses.
- NAFTA renegotiations are set to begin this Wednesday. While some areas, such as dispute resolution, are likely to prove challenging, several opportunities exist for improving and modernizing the agreement.
- The timing of Mexican presidential elections argue for a relatively short negotiating process. Trade negotiations are never simple affairs, but using TPP as a template for services trade liberalization may help accelerate the process.
U.S. - Inflation Strengthens in Eurozone, But Stays Soft in U.S.
Markets have this week been driven largely by political events and corporate results. Second quarter earnings continued to impress, boosting sentiment and stock valuations. Oil prices also helped, with the WTI benchmark rising above $50 on Thursday morning, helped along by rising global tensions and a drawdown in US inventories
Escalating tensions really begun to weigh on markets on Thursday afternoon with stock indices having the worst day in three months. Volatility sprung to life, with the VIX rising to 17. The tensions have so far boosted the flow of money into safe-haven assets, such as G7 government bonds. At the same time, risk assets exposed to the peninsula, such as the Kospi, Shenzen, and Nikkei equity indices fell on the week. While we don't expect situation on the Korean Peninsula to result in armed conflict, it could lead to weaker economic performance as consumers and businesses in the region pare back spending.
As far as economic data, this week was all about inflation. The story was relatively good in Europe, with several economies seeing robust readings. Core CPI in Germany and Spain rose by 0.4% and 0.3% (m/m) in July - the fastest monthly pace of several years. Price gains in France and Italy were less apparent, and averaged 0.13% for the Eurozone as a whole. Still, inflation in year-on-year terms accelerated to a four-year high of 1.2%, with these readings likely to provide further comfort for ECB officials to begin considering paring back on bond buying.
Inflation was far less robust in the U.S. with the producer price index (PPI) report on Thursday as well as its consumer cousin a day later, underwhelming. Total PPI declined 0.1%, marking its first decrease in eleven months, while the core measure pulled back by just as much in July, with the year-on-year measures decelerating by 0.3 percentage points to 1.9% and 1.8%, respectively. The consumer price index (CPI) also missed expectations, increasing by half of the 0.2% m/m gain that was expected.
The figures will not reassure Fed officials who have been looking for the data to turn after months of weaker than expected readings. While some of the past weakness has been transitory, the continued softness suggests that more permanent factors may be at play. As such, the Fed is likely to downgrade its inflation projections at its September meeting. They may also delay the timing for when inflation will finally reach its 2% target, but most will likely remain of the view that such an outcome will occur over the medium-term horizon.
There are reasons to be hopeful. This week's NFIB survey offered some reassurance, with the share of firms raising selling prices rising to 8% - the highest share since mid-2014. There was also an increase in the share expecting to raise prices from 19% to 23%. At the same time, labor market progress continues at a resilient pace.. With unemployment at 4.3%, wages growing at 2.5% y/y, and the trade-weighted dollar down 8% from its peak in December, inflation is likely to turn higher in the months ahead. This should allow the Fed to continue its plans to normalize its balance sheet and perhaps sneak in one rate hike before the year is out.
Canada - NAFTA Negotiation Process Begins Anew
Canadian markets started the shortened trading week with something of a yawn, as markets largely moved sideways until Thursday, as heated rhetoric from President Trump and Kim Jong Un took the S&P/TSX index, crude oil, and the loonie lower. The loonie recovered somewhat by mid-morning Friday assisted by soft US inflation data, but remained below US79 cents.
On the domestic front, the only major economic release was July housing starts, which came in ahead of market expectations at 222k units (at annual rates). The healthy climb, driven by multifamily units, led to a seventh straight monthly gain in the trend measure (Chart 1). In light of modest household formation rates and a number of headwinds to housing markets (rising borrowing costs, macro-prudential measures), it is likely that starts will begin to trend lower as the year progresses and multi-family projects pre-sold in prior years make their way through the start phase and into construction.
Much attention has rightly been given to the heated U.S.-North Korean rhetoric, but thankfully this has so far remained a war of words only. Where rhetoric has turned to action is on the trade front, with the first of seven planned rounds of NAFTA negotiations set to commence this Wednesday, August 16th. From a purely "Trumpian", zero-sum point of view, Canada likely has a favourable starting point vis-à-vis Mexico. While we run a surplus in goods with the U.S., once the significant trade in services is taken into account, Canada actually runs a small deficit overall (Chart 2). Not so for Mexico, where a larger goods surplus and smaller services deficit resulted in a roughly US$60 billion surplus in 2016.
Regardless of the starting point, negotiations are likely to see a number of sticking points. Both Canada and Mexico have already indicated their strong desire to see Chapter 19 dispute resolution (via independent arbitration) remain in the agreement. Potential changes to rules-of-origin requirements may also prove challenging, particularly if the U.S. pushes for an American content rule. Some areas that the U.S. has indicated it may focus on, such as agricultural products and the de minimus threshold for online purchases would likely benefit Canadian consumers, but face significant opposition from entrenched interest groups.
The service side of the agreement may prove to be both more important, and perhaps easier to come to agreement on. More important as the original NAFTA text, which was written before widespread internet access, is not reflective of modern, internet-enabled ways of doing business or the importance of intellectual property. Easier as all three countries can use the draft Trans-Pacific Partnership trade agreement as a starting point for negotiations. This is likely particularly important for the Mexican delegation, which will want to reach an agreement by February of next year - Presidential elections mean that after that point, an agreement can't be signed until January of 2019.
Ultimately, as in all negotiations, no party is likely to be completely happy with all outcomes. Nevertheless, the discussions are an important opportunity to expand and improve what has been an important component of Canadian prosperity over the past 23 years.
U.S.: Upcoming Key Economic Releases
U.S. Retail Sales - July
Release Date: August 15, 2017
Previous Result: -0.2%, ex-auto -0.2%
TD Forecast: 0.4%, ex-auto 0.4%
Consensus: 0.4%, ex-auto 0.4%
We expect retail sales to rebound 0.4% in July, led by a strong 0.5% increase in the control group (excluding auto, gasoline station, food services and building material sales). The prior two monthly readings have been soft, particularly for the control group, suggesting scope for a solid bounce back in July. Gasoline station and motor vehicle sales are not expected to move the needle on headline sales, consistent with little change observed in seasonally-adjusted gasoline prices and light weight vehicle sales. If realized, our projections would mark a solid start to the third quarter and would be consistent with real PCE growth of at least 2.5%, if not better.
Canada: Upcoming Key Economic Releases
Canadian Manufacturing Sales - June
Release Date: August 17, 2017
Previous Result: 1.1% m/m
TD Forecast: -1.2% m/m
Consensus: -1.0% m/m
Manufacturing sales are forecast to decline by 1.2% m/m in June, though weaker factory prices should allow volumes to outperform the nominal print. Energy products and motor vehicles should act as the primary drivers of the pullback, with the former expected to post a large decline due to softer crude prices, which bottomed towards the end of June, though export volumes edged lower as well. Motor vehicle exports also fell in June, which coincides with a pullback in domestic production and further evidence that the market for US auto sales has plateaued. Aerospace shipments should provide some offset but we still expect transportation to make a negative contribution on net. Elsewhere, we look for a fairly broad decline as manufacturers adjust to the rising Canadian dollar, a headwind which will grow stronger in Q3. While our forecast would represent the largest drop since early 2016, it would still leave Q2 nominal shipments up almost 5% on an annualized quarterly basis following three quarters of robust gains.
Canadian Consumer Price Index - July
Release Date: August 18, 2017
Previous Result: -0.1% m/m, 1.0% y/y
TD Forecast: -0.1% m/m, 1.1% y/y
Consensus: 0.1% m/m, 1.3% y/y
We look for July headline inflation to inch higher to 1.1% y/y from 1.0% y/y in June, reflecting a 0.1% decline in prices on the month. We expect energy prices on balance to decline on the month, led by lower gasoline prices, but should be neutral on a year-ago basis. Further gains in food prices are likely, in line with the past increases in agricultural prices though currency appreciation poses a downside risk in the months ahead. Other sources of strength in July include shelter costs on the back of the acceleration in new housing prices and rising mortgage rates. Though we believe underlying measures of inflation are bottoming, we proceed with caution in the near-term and continue to see risks skewed to the downside due to lagged effects of economic slack, renewed currency appreciation and other sources of transitory weakness. The three core metrics of inflation (CPI common, trimmed mean and median) averaged 1.40% y/y in June and will likely once again drive the market reaction, with some stabilization or pickup to the benefit of rate hike expectations.
Weekly Market Outlook: FOMC & RBA Meeting Minutes, Key Data in Focus
Next week's market movers
- In the US, the minutes of the July FOMC meeting could provide some specific details as to when the Committee is set to announce a normalization of the Fed's enormous balance sheet.
- In Australia, wage data for Q2 will be closely monitored, as they could determine whether the RBA will turn hawkish anytime soon. The minutes of the latest RBA gathering may also attract attention, as investors try to gauge how big of a concern the strong AUD is for policymakers.
- e also get key economic data from China, New Zealand, Australia, Sweden, the UK, the US, and Canada.
On Monday, during the Asian morning, focus will be on China's retail sales, industrial production and fixed asset investment, all for July. The forecast is for retail sales as well as industrial production to have slowed in yearly terms, while fixed asset investment is expected to have grown at the same pace as previously. We view the risks surrounding the industrial production forecast as skewed to the upside, perhaps for a more or less unchanged rate. We base our view on the nation's official and Caixin manufacturing PMIs for July, both of which showed that output growth was faster compared to a year ago.
In New Zealand, retail sales for Q2 will be released. Without any forecast available, we see the case for retail sales to have slowed somewhat in yearly terms. Our view is supported by the New Zealand electronic card transactions indicator, which showed that electronic sales slowed on a yoy basis throughout the quarter. What's more, the underperformance of the labor market during Q2 supports further the case for a slowdown in retail sales.
On Tuesday, during the Asian morning, the RBA releases the minutes of its latest policy gathering. At that meeting, the Bank acknowledged once again the latest strength in employment growth, but maintained its concerns regarding subdued wage growth. Perhaps the most noteworthy point was the officials' discomfort with the latest AUD appreciation. Even though the currency reacted little to these signals at the time, Governor Lowe recently raised the stakes by reminding the investing community that direct FX intervention is always on the table if needed. As such, we expect these minutes to be closely watched for more details regarding how big of a concern the strong AUD is for policymakers. As for policy signals, we doubt investors will find much in these minutes, as officials had little new data to work with at this meeting. We think that the main determinants of whether the Bank will begin to appear hawkish soon are the wage price index for Q2 and average weekly earnings for H1, out on Wednesday and Thursday respectively.
In the UK, CPI data for July will take center stage. The forecast is for both the headline and core CPI rates to have rebounded somewhat, something that is supported by the nation's services PMI for July, which indicated that prices charged rebounded from June's 11-month low. Even though a rebound in the CPI rates could keep alive some speculation regarding a BoE rate hike in the near-term, we remain skeptical on the prospect. Policymakers showed little urgency for a hike at the latest meeting, and we don't blame them considering the still-lackluster economic growth and wage prints.
From the US, we get retail sales for July and expectations are for both the headline and the core rates to have rebounded, after declining for two consecutive months. However, the nation's consumer sentiment indices did not paint a clear picture in July. Even though the Conference Board index rose notably, the U of M print declined, making us hesitant to place too much faith in the forecast.
In Sweden, CPI data for July are due to be released, though no forecast is available yet. We expect these prints to be closely watched, as investors try to gauge whether and when the Riksbank will follow in the footsteps of the Norges Bank and the ECB and remove its interest rate easing bias. At its latest meeting, the Riksbank showed no hurry to do so, indicating that it does not rule out repo rate cuts in the period ahead and that it remains prepared to implement further easing if necessary to safeguard the return of inflation to target. Markets will probably focus on any potential moves in the underlying CPI rate (CPIF) rather than the headline, as the Bank tends to pay more attention to that measure.
On Wednesday, during the Asian day, Australia's wage price index for Q2 is due out and subsequently on Thursday, we get the nation's average weekly earnings for H1 2017. Without any forecast available for these figures, we see the case for the wage price index to have accelerated from Q1. We base this view on the NAB business survey for Q2, which showed that growth in labor costs accelerated to +2.1% yoy from +1.3% yoy the previously quarter. A material acceleration in wages would probably be very encouraging news for RBA policymakers, especially considering that the NAB survey also showed that firms expect wages to pick up further in the next months. Strong prints could alleviate some of the RBA's concerns regarding subdued wages and would likely be another set of data entering the basket of those supporting that the Bank could begin shifting to a more hawkish stance soon.
In the US, dollar traders will have their gaze locked on the minutes of the latest FOMC meeting. The statement accompanying that decision had few changes compared to the previous one. The only changes related to the inflation outlook and the timing of the balance sheet normalization. Our view is that the financial community will dig into the minutes looking for more precise clues on the timing of the B/S normalization, than the "relatively soon" part of the statement. The statement was not clear on the inflation front either. The acknowledgment of inflation "running below 2%" was a downgrade from the previous description that it was "running somewhat below 2%". However, officials still expect it to stabilize around the target over the medium term. In our view, this doesn't paint a crystal clear picture of the Committee's view on inflation. The minutes of the June meeting showed a split Committee, with some members attributing the recent softness in prices to idiosyncratic factors, while others expressed concerns that this weakness may persist. Up until the July gathering, the latter camp appeared to be right as inflation continued to drift lower. As such, it will be interesting to scan the minutes and see whether this camp has grown.
In the UK, employment data for June will attract attention. The forecast is for the unemployment rate to have remained unchanged, while wages are anticipated to have risen at the same pace as previously. The forecasts are supported by the services PMI for June, which showed that the increase in employment was the strongest since April 2016, and that service firms continued to report rising staff salaries. We think market focus will be primarily on wages, which have remained subdued in recent months despite the notable pickup in inflation, keeping real wage growth in the UK negative and thereby, dampening the outlook for household spending and economic growth in general.
On Thursday, during the Asian morning, Australia's employment data for July are due out. Our own view is that the labor market may have posted another month of solid employment gains, something supported by the ANZ job ads indicator, which showed advertisements rising for the 5th consecutive month. Even though further tightening in the labor market would probably be very encouraging for the RBA, we think that market focus will be mainly on the wage data. As we already outlined, they could play the biggest role in determining the Bank's policy stance over the next months.
During the European day, we get the UK retail sales for July and expectations are for both the headline and the core figures to have slowed from the previous month. The forecasts are supported by the declines in the TR/IPSOS and the Gfk consumer sentiment indices for July. In addition, the BRC retail sales monitor showed a slight slowdown, enhancing the case.
Finally on Friday, we get Canada's CPI data for July. In the absence of any forecast, we see the case for the core inflation rate (at least) to have declined. We base our view on the fact that the Markit manufacturing PMI for the month showed that output-charge inflation moderated for the third month. With regards to the headline rate, we believe that it may have remained unchanged as the rebound in the yearly changes of oil prices may have offset some of the aforementioned softness. In any case, even if core inflation slows further, we doubt that it will alter expectations for another BoC hike this year. In the latest Monetary Policy Report, which was released when the Bank raised rates, the Bank anticipated inflation to slow somewhat further in Q3, before picking up again. As such, we believe that Q4 inflation data will play a much bigger role on whether the Bank will indeed decide to proceed with another rate increase this year. At this stage, we think that it would take a truly dreadful inflation report to stop the BoC from hiking again.