Sample Category Title
A Brief Look at Trading Psychology
Why is psychology such an important aspect in trading? Well, if you're incapable of controlling your mind/thoughts whilst operating in the market, you stand very little chance of reaching consistency.
Generally, traders, especially those new to the business, focus primarily on learning all they can about the technical side of trading. While we do agree that this is a necessary step for individuals wishing to function successfully by means of technical analysis, one MUST also place an equal amount of emphasis on mastering the psychological side of trading, as well. Unfortunately, the latter is often overlooked by so many!
During the course of this article, we aim to walk you through a number of different aspects relating to trading psychology, which we feel truly separates the winners from the losers.
Having a well-defined trading plan in place
Assuming that one has the discipline to FOLLOW their trading plan, it should help curb emotionally-driven mistakes. We personally think of a trading plan as a road map, guiding us through the market place. Without it, as far as we're concerned, you're essentially driving blind!
Below is a brief outline of what we believe should be covered in a trading plan:
- Risk parameters. This is where you will determine how much risk is to be allocated to each trade. Realistically, it should be an amount that you're comfortable losing without causing panic, which ultimately can result in 'revenge' trading. Revenge trading, for those who do not know, is the act of not observing risk management principles or executing trades beyond the scope of one's trading plan, in the hope of winning back a previous loss (or losses).
- Money management. Remember trading is a business, and should ALWAYS be treated as such. How one handles their account funds is crucial. This section should include, but is certainly not limited to, preparing for the worse-case scenario (how much of your account you're willing to lose before trading is to seize), planning for the long term and setting realistic financial goals.
- Timeframes. Filtering between different timeframes can be overwhelming for some and eventually lead to a poor trading decision. Therefore, it's imperative to have this outlined beforehand.
- Targets/Goals. Some traders set financial goals to achieve a certain amount per week/month and year. We try to remain somewhat flexible here by only having an annual percentage goal. The reason for this is that we firmly believe in being open to accepting whatever the market is willing to give us. Furthermore, if one has weekly or monthly targets that are not met, this can place a trader under pressure. And trading under pressure is not something we'd encourage!
- Markets. Will you stick to just the major currency pairs, delve into the minors or even the exotics? Do equities, commodities or bonds interest you? All of this should be well documented in your trading plan.
- Trading times. Though the market is a 24-hour auction house that operates five days a week, scheduling times to trade can instil some consistency to one's trading day.
- Performance evaluation. Evaluating each trade is crucial to the development of a trader. Remember, we learn by our mistakes!
- Software. Will you purchase specialized charting software or a dedicated news feed?
- Strategy rules. This is the section where one shapes his/her rules of engagement. Don't hold back here! Detail every point needed to confirm an acceptable setup. By doing this, you will avoid emotional decisions.
As you can see, without a trading plan you're likely going to be executing trades from a reactionary state. This is NOT a place you want to be. Compose a trading plan and refrain from trading blind!
Be careful who you follow!
Although there are a number of successful traders out there advertising trade setups for others to shadow, relying on these setups is not an approach that usually ends well for a number of reasons. For one, you have little knowledge of the method's nuances. Two, it's also impossible to know the psychological mindset of that particular trader from one day to the next. Above all else though, do you really want to spend your trading career relying on someone else's decisions? There is an exception to this, of course, and that is if you're using the trade calls to help solidify/complement your OWN trading setups.
Blindly trading other traders' ideas typically pushes one into a vicious psychological cycle. An illustration of such a cycle can be seen on the basic diagram below:
- At point one, you're full of optimism. The trader who provided the call to buy the EUR/USD (for example) has an outstanding record. So you naturally believe that this trade is highly likely to be a winner.
- The pair begins to move in favour and this carries you over into the excitement phase.
- At point three you're elated! The position has moved nearly double the position's risk and you feel on top of the world.
- It is at point four, though, where things begin to turn sour. Price starts consolidating and threatening bearish candles begin to emerge.
- At point five you've entered into a state of denial, as the market is now trading beyond your initial entry point.
- Taking into account that you have no plan in place to prepare for this situation, the next step is usually desperation. At this stage, you're essentially begging the market to get back to your entry level. However, even if price were to move in your favour and eventually lift itself back into the green again, would you, a trader with no plan for this, not just resort back to point one on the diagram above and begin the painful process all over again?
As we mentioned above, using other traders' ideas to complement your own setups is, in our opinion, a viable approach. Trading advertised setups blindly, however, will likely cause you a great deal of unnecessary stress.
Accept the risk
A financial loss is painful for just about anyone. That, we're sure, we can all agree on!
The majority of you reading this piece will genuinely believe that you already accept the risk on each trade you take. But do you really?
We're pretty sure that we've all been there. We place a trade and honestly believe that we are willing to lose the money invested i.e. have accepted the risk. Why then do we find ourselves altering the stop to protect our capital if the market does not act as expected? This, unless it is firmly in your plan to do so, is NOT accepting the risk. A way to overcome this is to begin trading positions that you are at ease with. What we mean by this is if you are feeling disappointed or angry at losing a certain amount of money, you may want to crank your size down considerably and work your way back up from there.
Accepting that your trades are random
What we want you to do now is visualize the perfect setup according to your rules. Now, picture the market steam rolling through your entry level like a knife through hot butter! This happens all the time and often leaves the trader in a state of confusion.
One has to realize that their analysis is NOT the market. The only reason the market responds to a setup is because other traders, often with deep pockets, get involved. Should others believe that the market is better sold at 1.2550 and you're selling at 1.2500, the trade will very likely fail.
Coming to realization that your trade outcomes are random is quite difficult for many. But until this happens, you will continue to have an emotional attachment to each trade you place.
Thinking in probabilities helps a great deal with this. In a nutshell, however, the point of this is to simply highlight and REMIND you that one losing trade means VERY little in the wide scheme of things and you can, even just by winning four times out of ten, still come out ahead. That is, of course, as long as you calculate risk accordingly! Taking colossal losses is a sure-fire way to a depleted account, and all the planning in the world will be of little use to you.
Having a can-do attitude
We believe this goes for just about everything in life! Without a positive attitude, you will likely get discouraged and emotional in this business. Still, we must point out that you mustn't confuse positive thinking with arrogance, as arrogance has absolutely no place in trading, despite what Hollywood films may portray.
In closing…
Let's remember that the main goal of trading the markets is to make a PROFIT. Satisfying the desire to be correct instead of making money is NOT how professional traders operate. The realisation that you can be wrong several times and still accomplish your goals is a difficult concept to accept, but one that is an essential component to a healthy trading mindset.
Typically, we only have our thoughts to work with when trading. Having the discipline to control these thoughts will, in our humble opinion, make or break you as a trader.
Despite covering some important aspects in this article, we have barely scratched the surface. It's compelling to think of how much of an effect psychology actually has on us as traders, and how little it is covered in mainstream teachings. To that end, we hope to dive deeper into this subject in future articles…
What are the Habits of Successful Traders?
What are the habits of successful traders? How can you implement these habits in your own trading to achieve better results? In this article, you can find some tips about trading habits that may help you achieve better results.
The better way to achieve success in trading is by having good trading habits. Find out what these are and how you can implement them.
Self-control
First of all, one of the most important characteristics of a trader is self-control. Once you develop a winning strategy, it's very important to control your actions and emotions when time comes to put it in practice. Some traders are not so successful because they cannot handle their actions when trading. In this sense, although they have a very good strategy, they let their emotions interfere too much, which may be prejudicial. Highly successful traders are often capable of becoming emotionally detached from their profits or losses. This can be very hard to achieve, but it's all about being capable of doing the right thing regardless of the amounts involved. The ultimate goal should be to trade well instead of making money – and the results will eventually come.
Accept Risk
Although trading allows you to make a serious amount of money, it may also lead you to lose a lot. This is a risky activity where high potential losses are involved. This means that, if you want to be a successful trader, you need to accept all the risks involved. You also need to be able of taking losses without it affecting your strategy. It's impossible to win every time so it's important to know what the stakes are from the beginning.
Once you manage to deal with risk, it's time to test your own limits. Some traders are risk lovers and can handle a major drawdown, while others prefer safer bets. Before starting to trade, it's better to know what kind of risk can you handle and develop a strategy from this point on.
Keep Stress at Bay
A successful trader should also be able to withstand a high level of stress. Real money is involved, and it's easy to lose focus once the market starts going against us. During such times, keep your rationale over your emotions. If you can make the right decisions under stress, probably your actions will be the right ones.
Be Patient and Adapt to the Market
The fourth essential habit in trading is to be patient. You don't need to be always trading to make money. The better trades come when you wait for the right time. If you wait for the right market conditions to apply your strategy, there's a higher probability it'll be more successful.
Establishing trading habits through psychology is the best way to apply it to your daily life.
Every day is different and the market may easily change drastically from one day to the other. Successful traders are the ones who can easily adjust to the market conditions and even profit from these changes. The first trader to realize a trend reversion and trade it is going to profit more. What was true yesterday may not be true today, and so it's always important to be prepared to adapt quickly.
Be Confident
You must be confident about your trading. If you did your analysis properly, don't be afraid to enter a position. There are a lot of great analysts that are poor traders because they are not capable of "pulling the trigger". Doing the research and testing a strategy is only half the way. The other half depends on the ability to enter the trade at the right time. Don't delay your actions, otherwise when you finally go in, the market may have already lost its steam.
Accept Losses
When trading, it's essential to be completely open-minded. What was right yesterday may be wrong today and the faster you realize your errors, the better. A lot of traders refuse to accept when they are wrong and always expect a market rebound. However, these traders often end up losing more than if they accepted their loss right from the beginning. It's not easy for the human being to accept he is wrong, but the most successful traders are the ones who can do this.
Recognizing a mistake earlier may lead to smaller losses, which contributes positively to your overall balance.
Establish Goals
Finally, establish your own goals and be perseverant. Sure, there will be times when everything seems to go against you: the prices never go your way, and that makes you go through a series of losses. That happens to all of us, good or bad traders. Just keep in mind that those losses are important for you to develop your skills and strategy, and to have better results in the future. Instead of focusing on the money lost, you focus on learning from what went wrong and try to improve it.
Establishing higher goals as times passes by is a good way to challenge yourself and commit to working harder.
Learn the top tips about trading habits that will help you achieve better results.
Of course, it's essential to have a good strategy and make a good analysis out of the market, but that's not everything in trading. Psychology plays a bigger role that we might think, and establishing trading habits is the best way to develop this in your daily life. The next time you trade, try to implement some of these trading habits and share with us if it helped to improve your results!
Everything You Need to Know about Confluence
To say confluence is powerful would, in our humble opinion, be a huge understatement! We agree that individual pattern recognition is worthy of attention, but without additional confluence it is not something we would entertain as a conceivable setup.
To become a successfully consistent trader you need an edge. This is something we're sure we can all agree on. That edge can involve areas of confluence. Still, truly understanding what confluence is and how to use it effectively is sometimes difficult to grasp. This is especially true in the earlier stages of one's journey, as confluent zones can form in a myriad of different shapes.
By the end of this article, you will have hopefully gained an understanding on how one can approach looking for confluence.
What is trading confluence?
Trading confluence can be defined in a simple sentence:
'An area in the market where two or more structures come together to form a high-probability buy/sell zone.'
As highlighted above, understanding what confluence is and how to use it effectively can be challenging. For instance, some traders solely rely on indicators to develop a trading zone, whereas others prefer to focus on price action and there are also those that favour a combination of the two. No matter which path you choose, having a thorough understanding of each complementing component is vital.
The chart below (H4 EUR/USD) provides a visual example of how traders can use indicators to form confluence. The small green zone marks where a possible reversal can (and in this case, did) take place.
Complementing the zone, the following indicators came together:
- MACD divergence.
- RSI divergence.
- 200 EMA.
- Bollinger band support.
The next chart shows how one can exclusively use price action to establish a trading area. For those who follow our daily reports: IC Markets Market analysis you may recall that this was actually a trade our desk showed a lot of interest in.
Forming this trading zone, we had the following converging structures:
- H4 channel support.
- A H4 AB=CD 127.2% ext. level.
- A H4 61.8% Fibonacci support level.
And for traders who prefer to use a combination of price action and indicators, one could have simply added the RSI on the chart above as additional confirmation, which happened to show divergence at the time (see above).
It's important to bear in mind that while trading areas of confluence does provide an edge, it doesn't mean that every single trade will produce a profitable result. Expecting each trade to win will be extremely frustrating because, well quite frankly, it WILL NOT happen!
However, if you take into account the setups that show strong confluence will, on average, produce reasonable results, you can profit in this business. As long as you see that your account is growing over the long term, a losing trade is not a cause for concern.
How much confluence should a trader look for?
This is where we get into the nitty-gritty.
How will a trader know when he/she has enough confluence to trade confidently? Clearly, this will be trader dependent. Some traders may only require two things to come together to form a zone, while another trader may need at least five concepts to merge before taking a trade.
For the purpose of this segment, we'll layout what we consider to be sufficient confluence. Personally, we designate each trade setup as either being: A1, A2 or A3.
An A1 setup is a first-rate trade. This is a setup which although may not be as regular as A2 and A3 setups, it tends to carry far more weight concerning the win/loss ratio. With that in mind, here are the following structures needed to fulfil an A1 formation:
- A credible area of structure. What we mean by this is the trading zone has to converge with either a supply or demand area, or a support or resistance barrier.
- A clear AB=CD formation. Ideally, the waves will have little interference. What we don't want to see is a smooth A-B leg and a distorted C-D leg.
- Trade with the trend. Personally, we only look on the traded timeframe for this. Therefore, if we're trading a H4 setup, we want to see the trend clearly painted on this timeframe.
- A psychological number. Most of us already know the importance of these values. For that reason, either a full round number (1.2300), or a mid-level number (1.2350) needs to be seen clearly around the area.
- Trendline convergence. Plotting the trendline is important here. Typically, we require at least two points, including the starting base, to be seen before drawing in a trendline.
- Either a 61.8% or 38.2% Fibonacci retracement point is required.
- A monthly or yearly opening level. Put simply, these are price points extended into the future from the opening candle of each year and month.
As you can see, there's a considerable amount of structure required here. Once an area forms that shows all of these levels come together, we would, unless there is a high-impacting news event due to be released, expect the zone to at least bounce price. Below is an example of such a setup which turned out to be a monster of a trade:
An A2 setup on the other hand, is a watered-down version of an A1 formation. With this, one is not required to have the yearly/monthly opening level, or a trendline. The remaining check points listed above in the A1 section are still needed to fulfil an entry. In addition, both A1 and A2 setups ideally need to show space for price to move on the higher timeframes (you will see this in action when we get to A3). Here's a basic A2 example:
This leaves the A3 setup. Just to be clear, we much prefer trading A1 and A2 patterns. But when there is nothing on the horizon, we will trade A3 setups, albeit using lower risk. Should a level such as a round number give way, with room seen for price to run, we would consider trading any retest of that level seen thereafter.
However, the retest must be accompanied by a bullish/bearish rotation candle (depending on which way you trade). A rotation candle is simply a candle that bounces from the level and forms a full, or very near-full-bodied candle. This, in our humble opinion, suggests buyer or seller intent. Of course, we would much prefer to see these levels bolstered by other structures such as a trendline, since every little helps!
Below is a perfect example of this in action as we recently took this trade. We must clarify though that our team did have additional reasons that bolstered this setup which we will explain shortly…
Ultimately, we were looking for a H4 close below the 1.32 handle to signify bearish resumption. Still, before we qualified a short, we needed a retest to take shape that is followed up with a H4 bearish (full-bodied) candle, which, as you can see, did indeed come to fruition. Nevertheless, this trade would not have been valid for us (especially using an A3 setup) if there was higher-timeframe support nearby. Looking to the daily timeframe on the chart below, you can see that there is room for the bears to stretch their legs, thus qualifying this trade:
What timeframe?
Which timeframe a trader selects will ultimately depend on his/her lifestyle. An individual who has a full-time job may only be able to swing trade, which entails one looking at the charts once (maybe twice) a day. Personally, to swing trade, we stick to the H4 timeframes and higher. Any lower, and we feel this is considered intraday.
If one is retired on the other hand, or works a part-time job, trading the market intraday is an option. Intraday simply means that a trade is executed and liquidated in the same day. Anything below the hourly timeframe is, for us, considered an intraday scale. This type of trading can involve sitting at the computer for several hours each day.
On the other side of the spectrum, you could also think about trading long term which involves looking at the charts a few times a week. This is slow and is not suited for everyone. Anything above the daily timeframe is what we deem to be long-term charts.
In closing…
Speaking personally, we feel trading areas of confluence is an incredibly strong edge. Without this, trading the markets successfully is difficult, not impossible mind you, but difficult. However, we must clarify that even with this edge it does not mean that you will succeed. Why? The reason simply comes down to psychology. Having the discipline to act, respect and follow your rules is often much harder than it sounds. In future articles, we hope to touch on the many psychological issues traders face.
Apply the Best Mindsets for Efficient and Enjoyable Trading
An optimal mindset is key to achieving efficient and enjoyable trades. With a volatile forex market, traders need a reliable mindset to manage all trading activities. By obtaining a strong and optimistic mental attitude, you can properly accomplish trades and vital tasks for success. Applying the right mindset allows a focused way of thinking that can minimize anxiety and reduce the chances of emotional trading. To have a healthy outlook towards the forex market, practice the best mindsets for optimal forex trading.
What is a good mindset?
A healthy trading mindset can make way for profitable output and a gratifying forex trading career. In any type of endeavor, a good mindset can inspire constant growth. It positively interprets experiences and drives the right actions to be taken. Because of this, forex traders must consider the best ways to apply a proactive and optimistic way of thinking.
A proper mindset is dictated by personal belief, innate skill and instinctive diligence towards the task at hand. In forex trading, it is also driven by incoming information and education used to make decisions. Even with an unpredictable market, traders are still able to control their mindset to achieve the target goals. Whether during challenging trades or successful executions , a forex trader's way of thinking is key to enhance growth and success.
For positivity and profit, apply the best mindsets for success in forex trading.
Benefits of an optimal mindset
Forex traders need to practice a positive and proactive way of thinking. Through a healthy mindset, you can go through trading activities and market challenges with a relaxed mind and full concentration. Here are the top benefits of having a good mindset while trading:
- Provides a sense of control over skill and progress
- Helps traders emotionally detach from challenging trades
- Allows you to enhance your innate skill and develop others that are necessary for optimal trading
- Encourages traders to further learn and grow from the forex market
- Inspires better corrective planning especially when dealing with any setbacks
"When we embrace a Get Better mindset, we welcome risk and are less afraid of failure, both key to personal development." -Heidi Grant Halvorson on 99U
What are the best mindsets for forex trading?
Mindsets can be cultivated to help you achieve the forex trading career you envision. Over time, these mindsets will encourage development and favorable results. With enough time and practice, a great mindset can be rooted into a trader's psychology. This will result in better forex trading character as well as performance. For success and wellbeing, practice the best mindsets for optimal forex trading:
The Holistic Mindset
- Focuses on the target goal and the overall forex trading journey
- Takes into consideration all the possibilities of the forex market including its setbacks
- Strengthens a way of thinking towards collective growth as well innate potential to succeed
Being holistic means seeing a person or a process as a whole. Having a holistic point of view is beneficial for traders who tend to be precise about every step of the trading process. With many learning stages and expected challenges in forex trading, practicing a holistic mindset can help you view the entirety of your trades. It describes a trader who sees both failure and accomplishment as part of the whole journey towards success.
The Positive Mindset
- Improves long-term mental health by minimizing anxiety
- Inspires confidence in the planned strategy and personal capabilities
- Provides an optimistic point of view when dealing with stress
Successful trades are fueled by calculated strategies and optimistic mindsets. For powerful mental health, traders who practice a positive mindset are able to deal with the challenges of forex trading. Optimism is a valuable state of mind that can make a difference in performance and psychology. To have a lasting career in forex trade, learn as 7 experts share their secrets to achieve a positive mindset.
The Proactive Mindset
- Initiates problem solving especially after trading losses
- Optimizes enhanced performance and strategy
- Boosts eagerness to learn and move on from mistakes or unexpected market turns
Applying a proactive mindset is a powerful way to process the challenges from the forex market. Through a proactive mindset, forex traders can master the ways to deal with losses while always gaining insight from it. According to 2nd Skies Forex, it is vital to use the information obtained from every experience to achieve target goals. Those who apply a proactive way of thinking can take action while learning how to trade more efficiently. With a proactive mindset, you can gain the habit of accepting losses instead of dwelling on it.
The Analytic Mindset
- Improves analytical skill when reading charts or processing incoming news
- Reduces impulsive trading
- Promotes better decision making especially during executions as well as the planning stages
A forex trader with a highly analytical mindset efficiently evaluates information and uses this analysis to improve and optimize. The analysis is applied from all information or updates coming in. While being updated when forex trading, having an analytical mindset also drives better decision in every trading activities. Along with a proactive mindset, forex traders with an analytical way of thinking also ensures the habit to study every experience and taking away lessons from it.
The Business Mindset
- Strengthens management of skills, tasks, as well as time
- Minimizes the risk of losses when steering away from emotional trading
- Allows traders to approach trading
This type of outlook describes a trader who sees forex trading as a business. As much as it is a personal endeavor, forex trading is a business venture. Having a business mindset can allow traders to explore the activities of forex trading with discipline. In the end, this mindset conditions all actions towards more calculated decisions like any businessman would. It prevents emotional trading and initiates constructive processes. Aside from this, applying a business mindset also promotes self-worth with forex trading as a personal investment.
Always look towards success. Use a growth mindset to drive progress and optimal trading.
The Steady Growth Mindset
- Increases the capability to master skills for better performance
- Expedites the learning curve especially for those new to trading
- Stimulates the habit to optimize and grow in every step of the process
There is a great advantage for traders who are naturally adept to trade forex. In a successful trading journey, being knowledgeable or market savvy is just a start-off point. Forex traders must have a growth oriented mindset to optimize systems and deliver consistently profitable trades. In many aspects of work and personal undertakings, a growth mindset is one of the best mindsets to ensure progress. With a growth mindset, traders can build more dedication and the feeling of fulfillment towards trading.
Avoid a fixed mindset!
The forex market evolves by the minute. To keep up with its volatile nature, traders must be open and adaptable. Because of this, it is important for forex traders to avoid a fixed mindset. Whether it is a fixed mindset that believes progress cannot be attained or failure will not happen, traders must always focus on growth. According to Psychlopaedia, a fixed mindset assumes that character, intelligence, and abilities cannot be changed. To grow towards success, forex traders should believe in personal potential and the possibilities of the market.
By avoiding a fixed mindset, you can create a trading career that is always optimizing. Through a strong and resilient mindset, any challenges can be faced with stable and disciplined decision making. At the same time, traders should also be ready to work hard and stay diligent.
Best mindsets for quality trades
A proper mindset can build a thriving career in forex trading. In a market full of possibilities, forex traders should attain a good mindset to succeed. Eventually, the mindset you practice will become as valuable as the strategy you develop. While analysing data or performing an execution, an optimal mindset can steer you through your calculated strategy without additional stress. For successful trades and a healthy well being, be aware of your thought process to achieve powerful forex trading mindsets.
In an exciting market, a forex trader's way of thinking is key to further growth and success.
The EUR/USD
Formed by two of the largest currencies in circulation, the EUR (Euro)/USD (United States dollar) currency pair continues to be one of the most actively traded assets in the world. Currently, the Euro ranks second behind the US dollar in regard to global liquidity.
Given that the unit is made up of two of the most important economies in the world, the pair is also considered a 'major'. This term is used to label the most central currency pairs in the world. For traders who are not aware of how currency pairs are structured, the EUR (in this case) would be considered the base currency, which always remains at one unit, with the US dollar representing the counter currency, or quote currency. The value of the counter currency fluctuates daily and communicates to investors/traders how much it will cost (in USD) to purchase a single unit of Euro.
Important organisations that surround the EUR/USD
Whether or not one actively invests in the financial markets, the majority of the world know, or have at least heard of, the Federal Reserve of the United States, or more commonly referred to as 'the Fed'. This is the central bank for that country, chaired by Janet Yellen who took office in February 2014. Its main objective is to direct general economic policy. The board of governors meet several times throughout the year to discuss US monetary policy and announce its target interest rate. Generally, if interest rates remain unchanged, attention will then be drawn to the tone of the FOMC, which is the Federal Open Market Committee. Investors typically look for dovish/hawkish clues in the Fed's dialogue, which, more often than not, will cause volatile price action on the EUR/USD.
While the Fed commands respect, it's not the only institution to affect the EUR/USD. The European Central Bank (ECB) sets and implements monetary policy for the Eurozone. When President Mario Draghi, who has served since November 2011, takes to the stage, the market most certainly listens!
Some economic influences that affect the EUR/USD
Although the US and European central banks are important, there are other major economic releases that can cause the currency pair to fluctuate, and eventually force the central banks to intervene and alter rates:
- Inflation figures. Inflation refers to the rate at which prices for goods and services rises. If inflation continues to climb (check CPI and PCE indexes) this may spur the Fed, or ECB, to hike interest rates. What this does is make things more expensive and therefore generally slows consumer spending. By the same token, deflation will likely see the two noted central banks lower interest rates in an attempt to encourage more spending.
- Employment data. The aftermath of the monthly US non-farm payrolls report generally produces a sizeable reaction on the EUR/USD. Getting caught on the wrong side of this beast will not be a pretty sight! Employment numbers for the Eurozone's major economies such as Germany and France should also be underscored!
The above two are what we'd consider to be major league. Yet, there are others that also deserve consideration, including, growth data (GDP), retail sales, trade balance etc.
EUR/USD correlations
Basic correlations for the pair are as follows:
- EUR/USD is typically inversely correlated with the USD/CHF.
- GBP/USD and the EUR/USD are positively correlated.
- The US dollar index can be used to determine the overall strength of the dollar, and thus can signal potential turns in the EUR/USD market, given the Euro's weight within the index (over 50%).
- EUR/USD and gold have an interesting positive correlation. The main reason for this has been the shared perception of gold and the Euro as alternative investments to US dollars.
Most active hours
Effectively the EUR/USD pair trades 24 hours a day five days a week. Still, it is not always active! Personally, we've found the EUR/USD to gain traction going into the London open. This typically continues throughout London trade, and follows into the US segment. Though, the pair tends to slow down somewhat during the US afternoon.
In closing…
Of course, there is a great deal more that affects the EUR/USD. What we have attempted to do in this article, however, is give you a foundation, a starting block if you will, to continue research.
How to Use Yearly, Monthly and Weekly Opening Points
We'd be surprised if the title did not raise a few eyebrows! Opening points? Well, we can tell you that we're not referring to pivot point levels. This is a common method. Just type 'Pivot points forex' into Google search, and you'll be inundated with information.
The approach we're going to show here, as far as we can see, is not widely used. Just to be clear though, this technique was not developed by us in any way shape or form. We've simply found credibility in these lines and use them to our advantage.
Yearly, monthly and weekly opening points?
Put simply, these are price points extended into the future from the opening candle of each year, month and week, similar to how you'd plot a typical support/resistance level. Irrespective of the timeframe being traded, however, we always look to draw lines from the opening candle on the hourly chart. This helps locate the exact opening value.
The level can then be used on the M1 right up to the monthly timeframe. The chart below shows a good example of a Monthly opening level used in May. Notice that we've attached the line to the OPEN of the candle. The high, low and close are not important here.
Below is another example. This time, nevertheless, we've taken it from the 2010 yearly open. Once again, the line was drawn using the open candle found on the hourly chart.
Why do these levels usually hold?
Technically, we have confidence in these levels due to years of back testing. Attached below are three charts, two of which were used above showing this in action:
Each level, be it a weekly, monthly or yearly opening, held price reasonably well. Just look at May's monthly opening band, for example. For two week's this monthly level provided strong support and resistance.
Apart from seeing these levels bounce price, what do we believe actually causes a reaction to take shape? To our way of seeing things, this is due to unfilled orders. When the year, month and week comes to an end, a great deal of traders with deep pockets look to cover, alter and open new positions. As such, lots of 'order swapping' takes place, and with it, unfilled orders are often left behind. What we mean by an 'unfilled order' is simply an order that was left unfilled, i.e. not triggered, around a certain price point.
Say that you were a 'big fish' in the forex world who wanted to add to your position going into the month's close, as the instrument being traded was showing signs of strength. Now, big fish do not trade like little fish. We retail traders can place orders and generally receive no slippage. However, when you are trading several hundred lots, one cannot just slam dunk that order into the market, as slippage could place you in a very awkward position, far away from your entry point. So, bigger fish usually enter the market incrementally, and by doing so, do not always get their entire position filled. Therefore, big fish have the choice of leaving the order in place unfilled so as price can pick it up when/if the market returns. This, we believe, is what generates a reaction from these levels from an order flow perspective.
How does one use these opening points?
Personally, we will never use an opening level, or any level for that matter, as a stand-alone tool. It always has to have additional confluence. We absolutely love points of confluence, and they do not get much better than a confluent yearly, monthly or weekly open level. Confluence, in trading, essentially means the combination of structures coming together to form a buy/sell zone.
The chart above shows a setup our team would be very interested in. It boasts a great deal of confluence. The yellow sell zone is made up of the following structures:
- A monthly open level at 1.0937 stretched all the way back from April 2016.
- A H4 mid-level resistance at 1.0950.
- A H4 AB=CD 127.2% ext. at 1.0946.
- A H4 61.8% Fib resistance at 1.0940.
The noted structures help form a trading area. Trading using a zone also gives the trade room to breathe, and a place to position a stop-loss order.
Forex Trader Checklist: Top 10 Must-Haves for the Ultimate Home Office
To build a profitable career out of forex trading, you will need to create the ultimate home office
Setting up a proper trading station at home is easy and highly effective. It improves focus and optimizes personal efficiency much needed in forex trading. Whether you are a novice or an expert, your home office can easily affect your mindset and productivity during trade hours.
For an efficient and positive work environment at home, make sure you have everything you need in your trading station. Here are our top 10 must-haves for the ultimate home office:
The Right Desk
After picking a secluded area for your workstation, one of the first things you will need is a great office desk. Don't forget that this will be the center of your home office where forex trading will take place. Make sure to choose the right size for the space as well as the perfect design for your workflow.
There are plenty of options to choose from. But before buying the best looking desk, make sure to consider the following points:
How many monitors do you have? Is the entire desk space going to be usable? Can picture yourself being productive with this desk?
Ergonomic Office Chair
Comfort is key when working in your at-home trading space. Finding a high quality and comfortable chair can encourage productivity and can also improve health. With the amount of hours you can spend trading or studying the market, an ergonomic chair can keep you focused and relaxed.
According to Life Hacker, some the best ergonomic office chairs are made by Herman Miller, Steelcase, Ergohuman and IKEA.
Using a bean bag or an exercise ball from time to time can also be an interesting alternative while working.
Computer
A premium computer setup is the best investment for an at-home trading office. Since most of your work is on the computer, your setup should be dependable and FAST! You want to make sure you get a minimum of a dual core processor, good RAM(Random Access Memory) and fast processing hard drive. This means faster execution times, no lagging issues and real-time figures without interruptions.
A laptop with long battery life is also a good investment. If your house loses power or if you may need to work outside of your home office, you can easily continue to work.
*Quick Tip when shopping: Ask for the best selling computers and laptops used for gaming. These will usually have high performance, reputable quality, and up-to-date hardware.
Multiple Monitors
Multiple monitors enable you to optimize your trading strategies. With so much information coming in, having at least two or three monitors will allow you to track and display trading data all at once. This setting helps you analyze charts or stocks while keeping an eye on other indicators. It also lets you place trades or view quotes without the interference of breaking news or chat rooms.
There are plenty of companies devoted to manufacturing monitors and computers for day trading. Visit EZ Trading Computers, Trading Computers or Falcon Trading Systems to get an idea on how to use monitors in your home office.
Other Important Desk Accessories
To enhance your trading results at home, here are some extra desk accessories you probably haven't thought about!
- Surge Protector – A simple and cost effective device that protects your computer from unexpected voltage spikes.
- Computer Cooling System – Whether this is a built-in or a makeshift cooling device, plan a cooling system to dissipate heat.
- Ergonomic Mouse – This is a kind of mouse made to fit your hand position and improve comfort during use.
- Gel Mouse Pad – All gel mouse pads decrease stress in the wrist especially during long hours of trading.
Powerful Internet Connection
You cannot be a successful forex trader if you don't have powerful internet connection. Along with a top performing computer, high speed cable internet is an essential for faster data exchange as well as quick executions.
Do browsing pages load quickly? When streaming in youtube.com, is there a lag?See if you are satisfied with your existing connection and go from there. If your current provider offers better plans, get it! The extra monthly fees will be a smart investment and a necessary business expense.
You cannot be a successful forex trader if you don't have powerful internet connection.
Back Up System
As a professional, you must always prepare for the unexpected. Here are a few instances when you would need backup system ready in your home office:
- Power goes off in the middle of an execution. Sudden power loss can be stressful and quite risky. You will need a battery backup power loss system like a UPS(uninterruptible power supply) that will keep your electronics running. Set up a backup power loss system in your home office with devices like an APC Back-UPS 650 or a Cyberpower 1350. Although more expensive, these systems usually come with a good surge protector.
- Your "old reliable" computer crashed without warning.The best way to deal with these unavoidable situations is to prepare a backup computer or a laptop with your trading software ready. You must also backup your Metatrader 4 via online storage service or an external hard drive. Lastly, always make it a point to copy and transfer all files from your day trading computer to any storage system to avoid data loss.
Smart Organization Products
Everyone knows the benefits of having an organized desk. Companies like The Container Store and IKEA have developed simple and stylish products that promote uncluttered spaces. From drawer organizers to cable wire control, there are many smart designs available that can improve your workflow.
Forex Trading Journal
Having a trading journal can seem like an optional tool in your office especially when you have a forex broker. But having your own journal can actually help you with your efficiency. It keeps track of how you execute trades and reviews your personal growth as a trader. It can also analyze your overall performance during a certain time.
Take it from babypips.com : "A disciplined trader is a profitable trader and keeping a trading journal is the first step to building your discipline."
Personal Checklist for De-stressing
Trading can be a high-stress career. But one big advantage in having a home office is that you can personalize your space and make room for things that promote relaxation. Try placing memorabilia on your desk or set up a coffee maker in the area if it helps. You can also prepare your favorite playlist.
Create your own personal checklist with relaxing tips to keep a level head while trading!
One of the best ways to become a successful forex trader is through an optimized trading station. Your setup should boost productivity and create a professional environment for best trading results. When you invest in the right tools for your ultimate home office, you start building a profitable and sustainable forex trading career.
To build a profitable career out of forex trading, you will need to create the ultimate home office.
EUR/USD Weekly Outlook
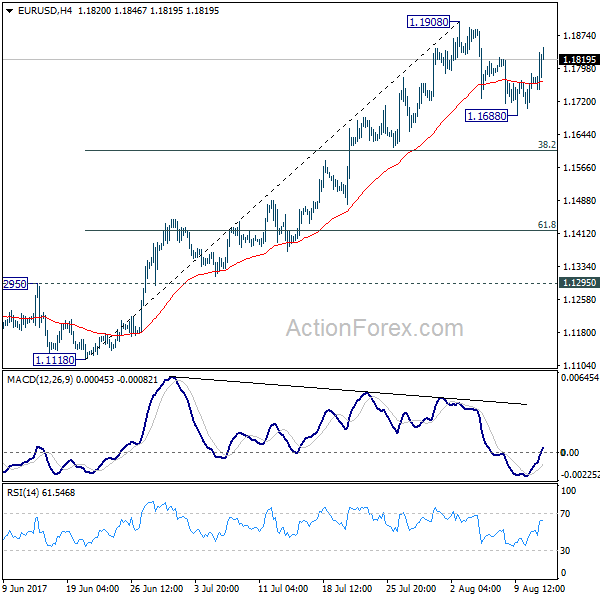
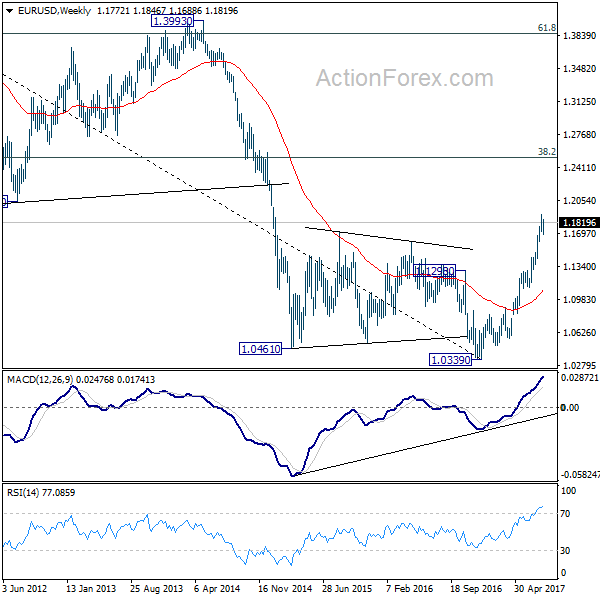
EUR/USD's pull back from 1.1908 extended to 1.1688 last week but recovered since then. With 1.1908 resistance intact, initial bias remains neutral this week for some more consolidations first. In case of another fall, downside should be contained by 38.2% retracement of 1.1119 to 1.1908 at 1.1606 to bring rebound. On the upside, break of 1.1908 will extend recent up trend to 1.2042 long term support turned resistance next.
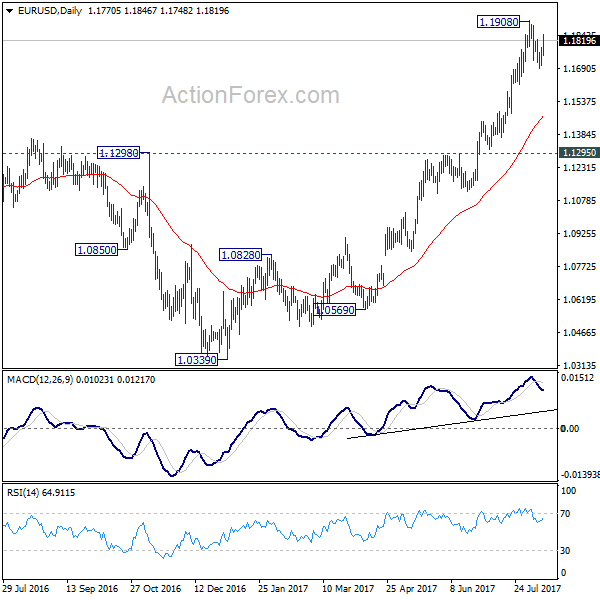
In the bigger picture, an important bottom was formed at 1.0339 on bullish convergence condition in weekly MACD. Sustained trading above 55 month EMA (now at 1.1768) will pave the way to key fibonacci level at 38.2% retracement of 1.6039 (2008 high) to 1.0339 (2017 low) at 1.2516. While rise from 1.0339 is strong, there is no confirmation that it's developing into a long term up trend yet. Hence, we'll be cautious on strong resistance from 1.2516 to limit upside. But for now, medium term outlook will remain bullish as long as 1.1295 support holds, in case of pull back.
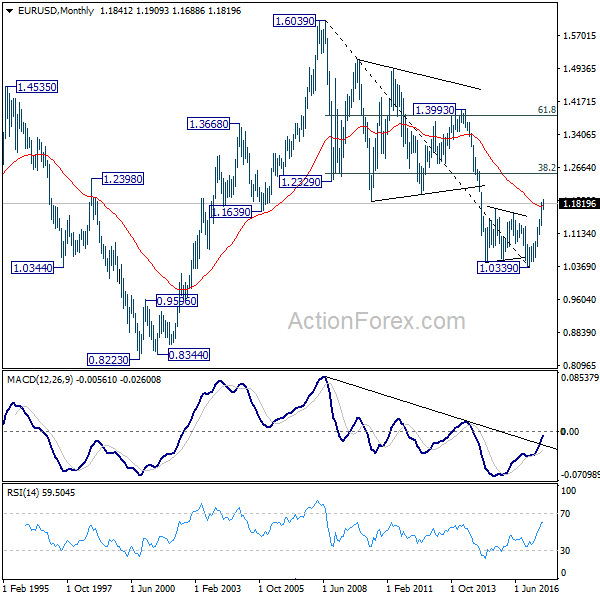
In the long term picture, 1.0339 is now seen as an important bottom as the down trend from 1.6039 (2008 high) could have completed. It's still early to decide whether price action form 1.0339 is developing into a corrective or impulsive move. But in either case, further rally would be seen to 38.2% retracement of 1.6039 to 1.0339 at 1.2516
USD/JPY Weekly Outlook
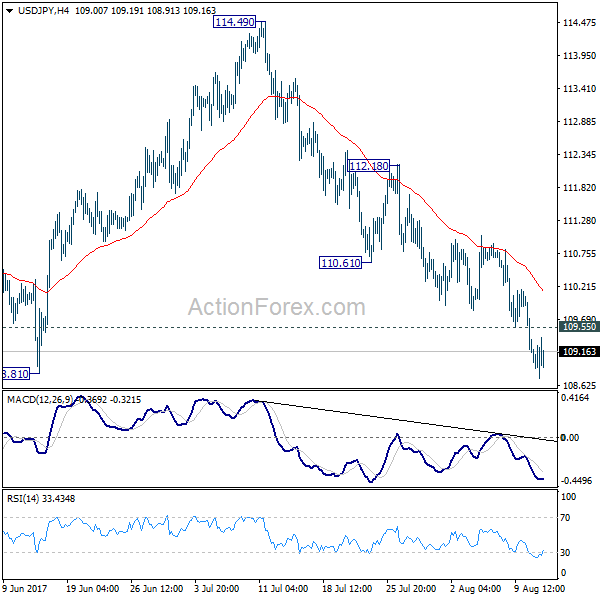
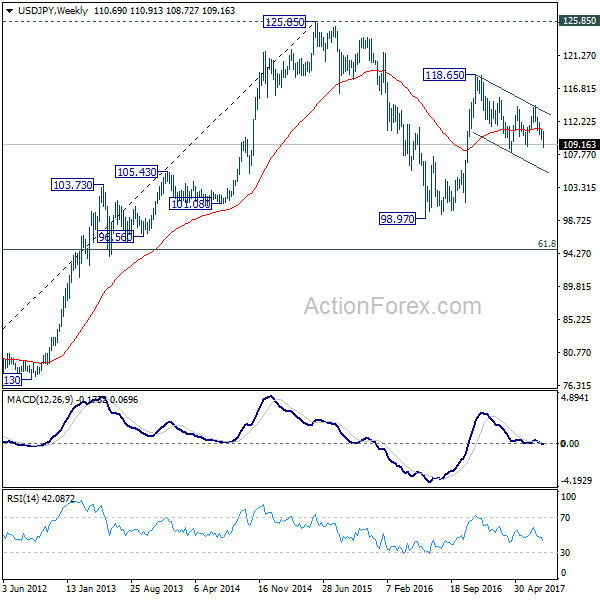
USD/JPY's fall from 114.49 extend lower last week and breached 108.81 support. Initial bias remains on the downside this week. Sustained break of 108.81 will resume whole corrective fall from 118.65 and target 61.8% retracement of 98.97 to 118.65 at 106.48. On the upside, above 109.55 minor resistance will turn intraday bias neutral first. But near term outlook will remain bearish as long as 110.61 support turned resistance holds.
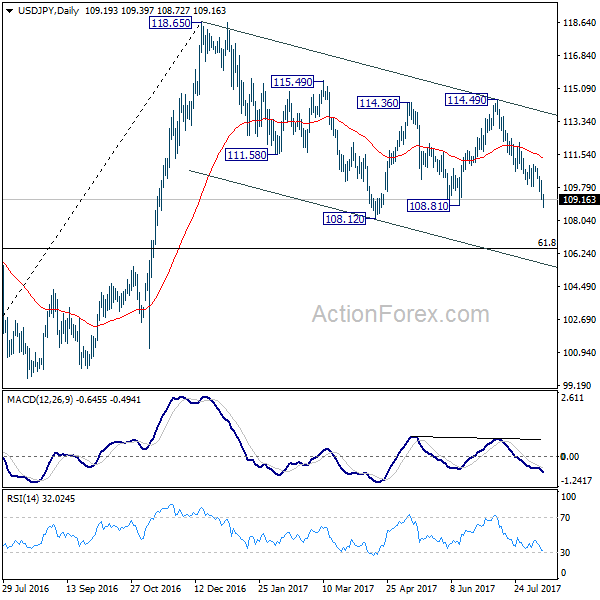
In the bigger picture, the corrective structure of the fall from 118.65 suggests that rise from 98.97 is not completed yet. Break of 118.65 will target a test on 125.85 high. At this point, it's uncertain whether rise from 98.97 is resuming the long term up trend from 75.56, or it's a leg in the consolidation from 125.85. Hence, we'll be cautious on topping as it approaches 125.85. If fall from 118.65 extends lower, downside should be contained by 61.8% retracement of 98.97 to 118.65 at 106.48 and bring rebound.
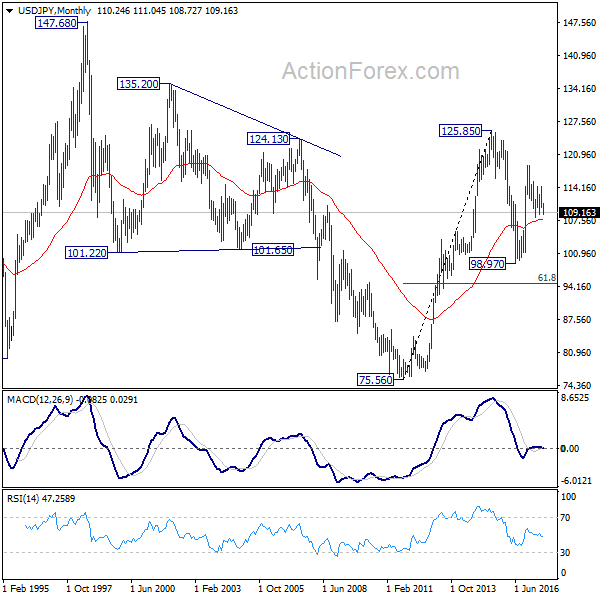
In the long term picture, the rise from 75.56 long term bottom to 125.85 top is viewed as an impulsive move. Price actions from 125.85 are seen as a corrective move which could still extend. But, up trend from 75.56 is expected to resume at a later stage for above 135.20/147.68 resistance zone.
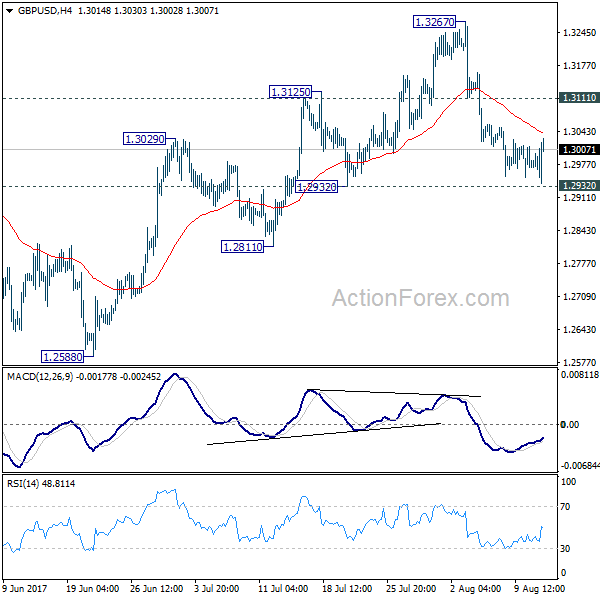
GBP/USD Weekly Outlook
GBP/USD's decline from 1.3267 extended lower last week but lost momentum ahead of 1.2932 support. Initial bias is neutral this week first. Near term outlook stays cautiously bearish as long as 1.3111 resistance holds and deeper fall is expected. As noted before, price actions from 1.1946 are seen as a corrective pattern and could have completed at 1.3267. Break of 1.2932 will affirm this bearish case and target 1.2588 key near term support for confirmation. However, break of 1.3111 resistance will turn bias back to the upside for retesting 1.3267 high instead.
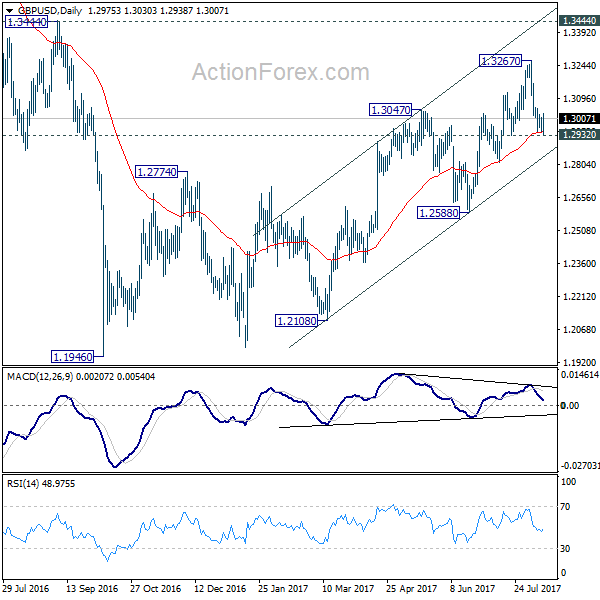
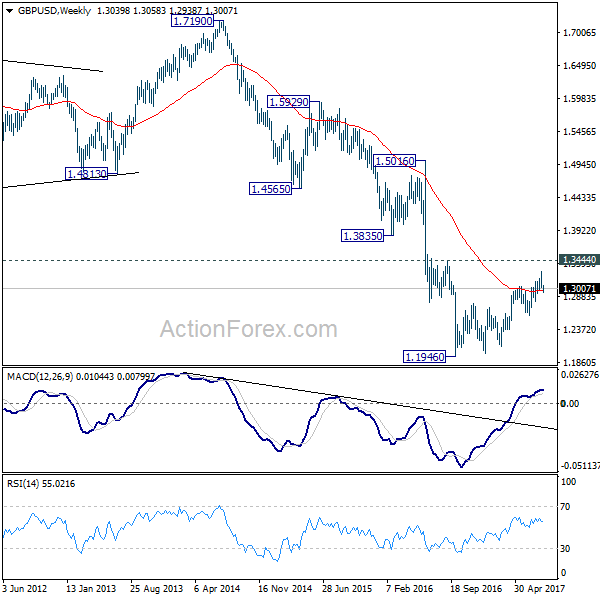
In the bigger picture, overall, price actions from 1.1946 medium term low are seen as a corrective pattern. While further rise cannot be ruled out, larger outlook remains bearish as long as 1.3444 key resistance holds. Down trend from 1.7190 (2014 high) is expected to resume later after the correction completes. And break of 1.2588 will indicate that such down trend is resuming.
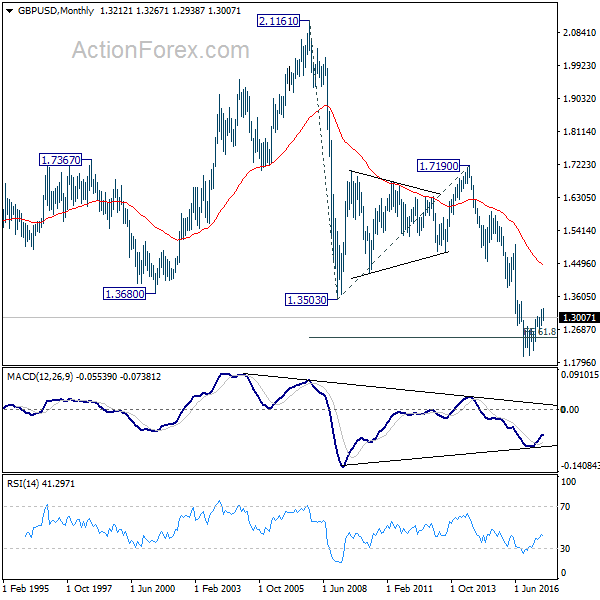
In the longer term picture, no change in the view that down trend from 2.1161 (2007 high) is still in progress. On resumption, such decline would extend deeper to 100% projection of 2.1161 to 1.3503 from 1.7190 at 0.9532. However, firm break of 1.3444 should confirm reversal and turn outlook bullish.