
Sample Category Title
EUR/JPY Weekly Outlook
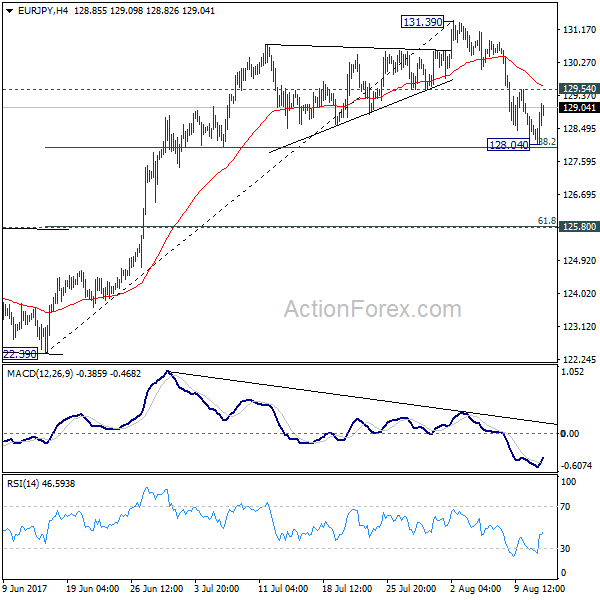
EUR/JPY's correction from 131.39 short term top extended to 128.04 last week. The cross then tried to draw support from 38.2% retracement of 122.39 to 131.39 at 127.95 and recovered. Initial bias is neutral this week first. Above 129.54 minor resistance will argue that the pull back is completed and will turn bias back to the upside for retesting 131.39. However, sustained break of 127.95 will bring deeper decline to 125.80 cluster support (61.8% retracement at 125.82) before completing the correction.
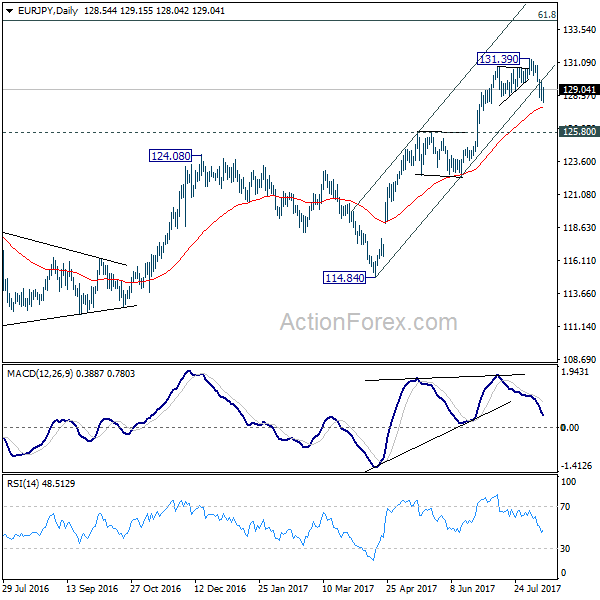
In the bigger picture, the down trend from 149.76 (2014 high) is completed at 109.03 (2016 low). Current rally from 109.03 should be at the same degree as the fall from 149.76 to 109.03. Further rise is expected to 61.8% retracement of 149.76 to 109.03 at 134.20. Sustained break there will pave the way to key long term resistance zone at 141.04/149.76. Medium term outlook will remain bullish as long as 124.08 resistance turned support holds.
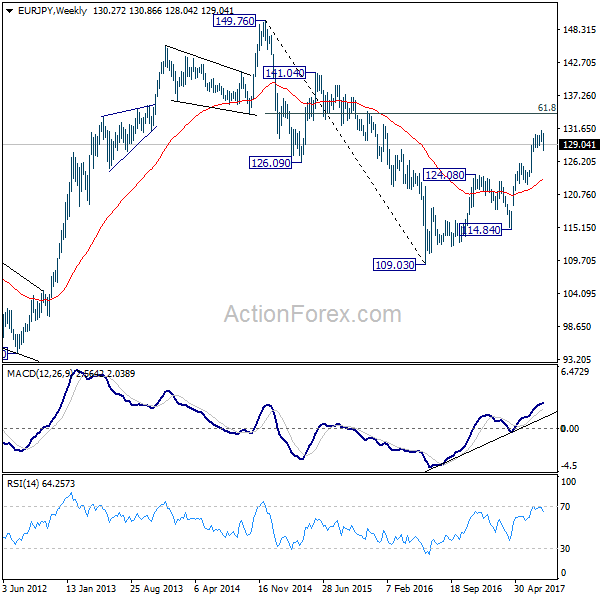
In the long term picture, at this point, there is no clear indication that rise from 109.03 is resuming that from 94.11. Hence, we'd be cautious on topping below 149.76 to extend range trading. Nonetheless, firm break of 149.76 will indicates strong underlying buying. In such case, EUR/JPY will target 100% projection of 94.11 to 149.76 from 109.03 at 164.68.
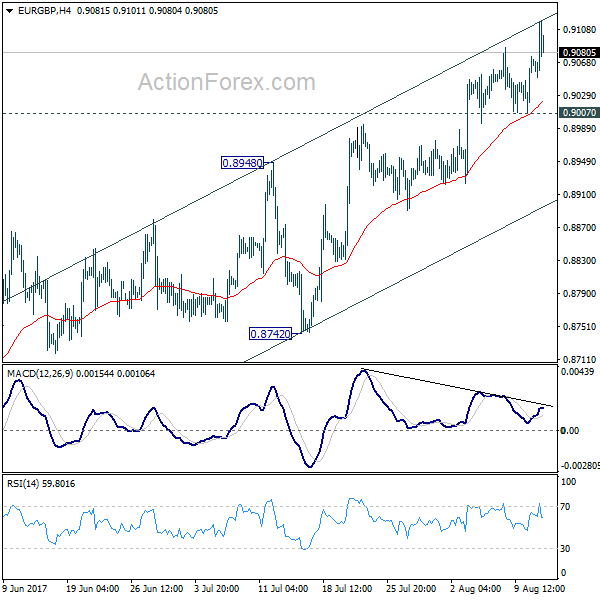
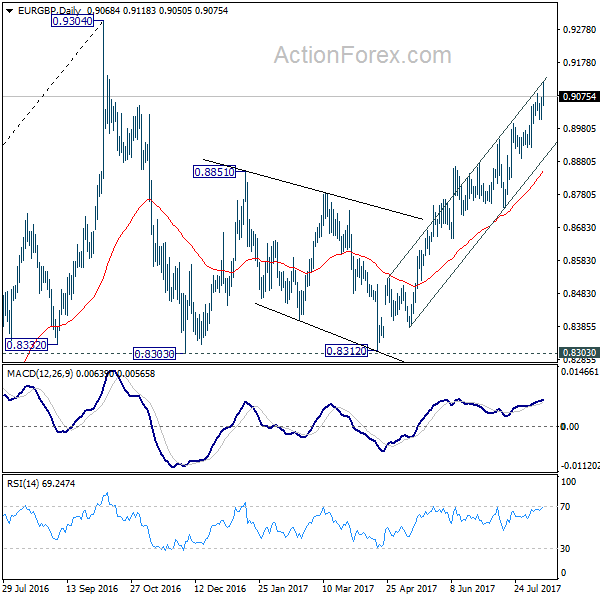
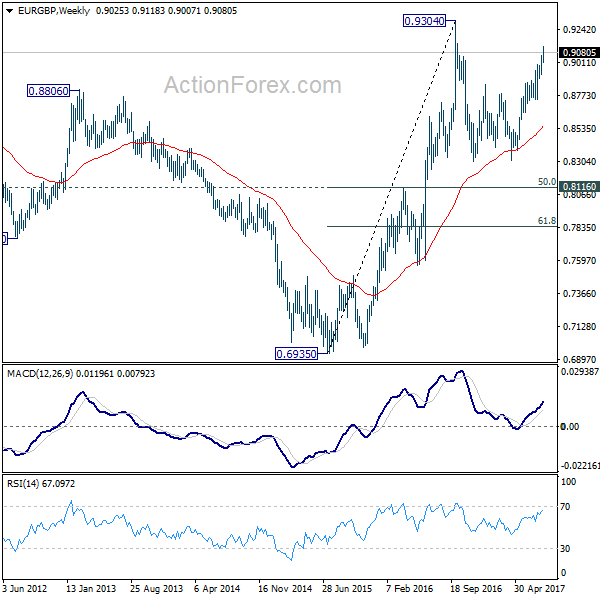
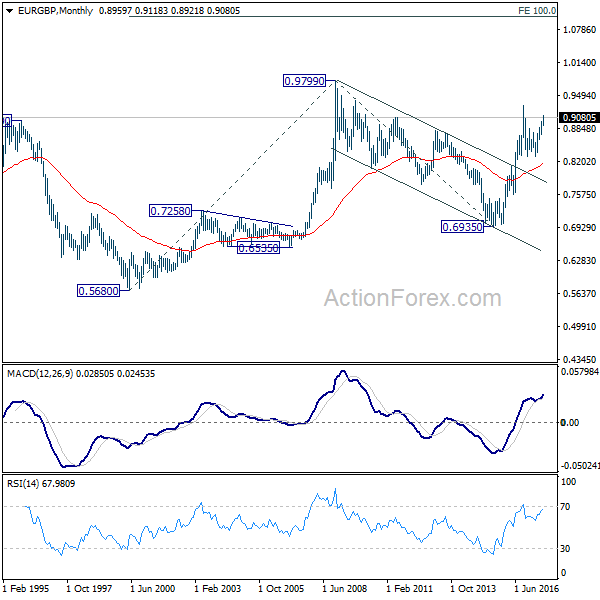
EUR/GBP Weekly Outlook
EUR/GBP's rally extended to as high as 0.9118 last week and there is no change in the bullish outlook. Initial bias stays on the upside this week as rise from 0.8312 would target a test on 0.9304 high. At this point, there is no clear sign of up trend resumption yet. Hence, we'll be cautious on strong resistance from 0.9304 to limit upside and bring another fall. On the downside, considering bearish divergence condition in 4 hour MACD, break of 0.9007 support will indicate short term topping. Intraday bias will then be turned back to the downside for 0.8742/8948 support zone.
In the bigger picture, price actions from 0.9304 are viewed as a medium term corrective pattern. It's uncertain whether it is finished yet. But in case of another fall, we'd expect strong support from 0.8116 cluster support (50% retracement of 0.6935 to 0.9304 at 0.8120) to contain downside and bring rebound. Whole up trend from 0.6935 is expected to resume after consolidation from 0.9304 completes.
In the long term picture, firstly, price action from 0.9799 (2008 high) is seen as a long term corrective pattern and should have completed at 0.6935 (2015 low). Secondly, rise from 0.6935 is likely resuming up trend from 0.5680 (2000 low). Thirdly, this is supported by the impulsive structure of the rise from 0.6935 to 0.9304. Hence, after the correction from 0.9304 completes, we'd expect another medium term up trend to target 0.9799 high and above.
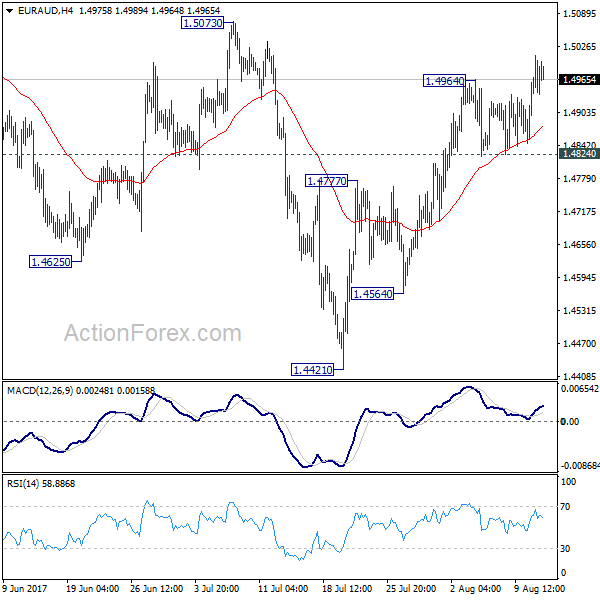
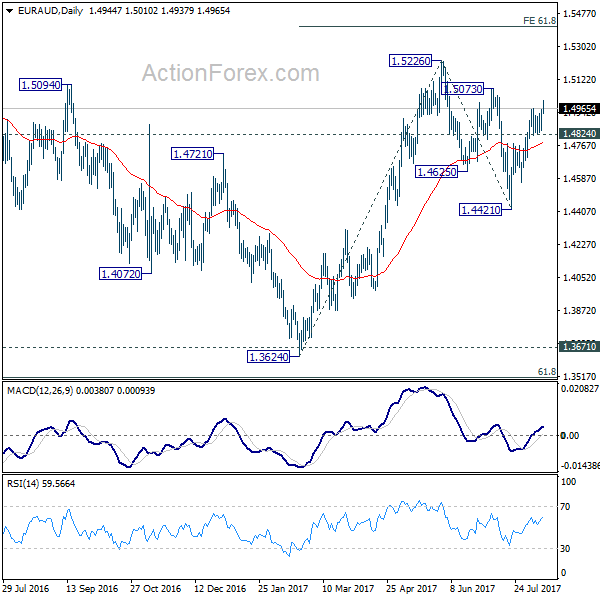
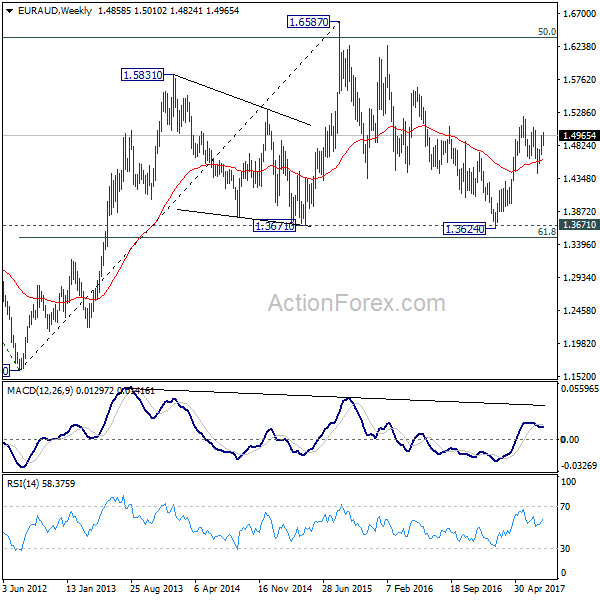
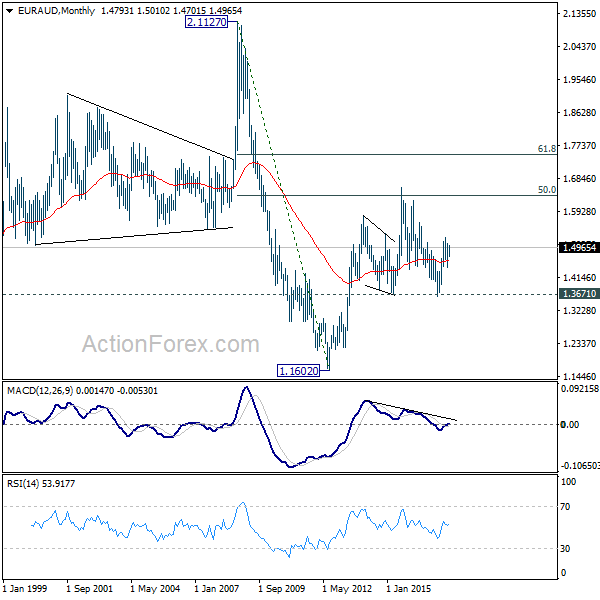
EUR/AUD Weekly Outlook
EUR/AUD's rise from 1.4421 resumed by taking out 1.4964 last week. Overall bullish near term outlook is unchanged. That is, correction from 1.5226 should have completed with three waves down to 1.4421 already. Initial bias remains on the upside this week for 1.5073 resistance first. Firm break there will likely resume the rise from 1.3624 and target 61.8% projection of 1.3624 to 1.5226 from 1.4421 at 1.5411 next. On the downside, however, break of 1.4824 support will dampen our bullish view and turn bias back to the downside for 1.4564 support instead.
In the bigger picture, we're holding on to the view that corrective decline from 1.6587 medium term has completed at 1.3624. Rise from 1.3624 is expected to extend to retest 1.6587. The corrective structure of the fall from 1.5226 is affirming this view. Above 1.5226 will target a test on 1.6587 key resistance. However, another decline will dampen our view and would drag EUR/AUD lower to retest key support zone around 1.3624.
In the longer term picture, the rise from 1.1602 long term bottom isn't over yet. We'll keep monitoring the development but there is prospect of extending the rise to 61.8% retracement of 2.1127 to 1.1602 at 1.7488 and above. However, sustained trading below 1.3671 should confirm trend reversal and target 1.1602 long term bottom again.
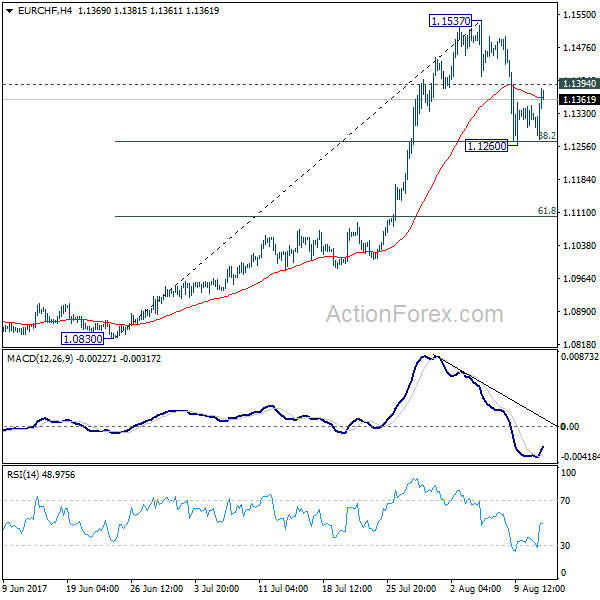
EUR/CHF Weekly Outlook
EUR/CHF's pull back from 1.1537 short term top extended to 1.1260 last week. But the cross drew support from 38.2% retracement of 1.0830 to 1.1537 at 1.1267 as expected and recovered. Initial bias stays neutral this week first. On the upside, break of 1.1394 minor resistance will argue that the correction is completed. In such case, intraday bias will be turned back to the upside for retesting 1.1537 high. Nonetheless, on the downside, firm break of 1.1267 will extend the fall and target 61.8% retracement at 1.1100.
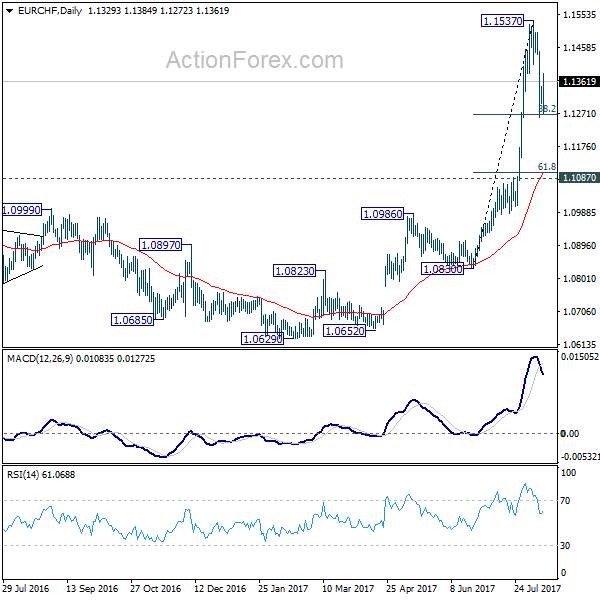
In the bigger picture, firm break of 1.1198 key resistance confirms resumption of the long term rise from SNB spike low back in 2015. In this case, EUR/CHF would eventually head back to prior SNB imposed floor at 1.2000. For now, this will be the favored case as long as 1.1087 resistance turned support holds.
Global Selloff on US-North Korea Tensions, Markets Starting to Price in Fed Cut
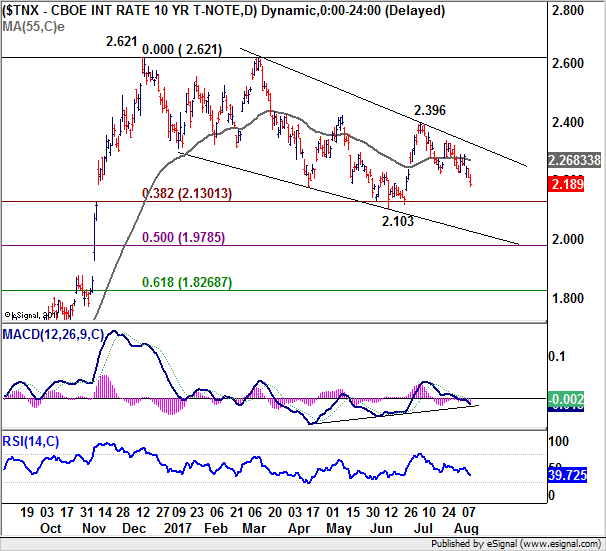
Risk aversion dominated the markets last week as tension between US and North Korea suddenly intensified on verbal exchanges of the leaders. DOW initial made new record high at 22179.11 but ended the week down -234.49 pts or -1.06% at 21858.32. S&P 500 closed down -35.51 pts or -1.43% at 2441.32. European indices were harder hit with DAX closed down -283.66 pts or -2.31%. FTSE closed down -201.75 pts or -2.69%. Japan was on holiday on Friday but Hong Kong HSI closed the week down -2.46%. US yields was further hit by tame CPI and PPI data with 10 year yield closed at 2.189, taking out 2.225 near term support decisively. In the currency markets, Yen and Swiss Franc ended as the strongest ones on risk aversion. Commodity currencies ended as the weakest ones, followed by Sterling. Gold surged on risk aversion and Dollar weakness and closed up 2.4% at 1295. WTI crude oil traded like a passerby and struggled to regain 50 on another attempt.
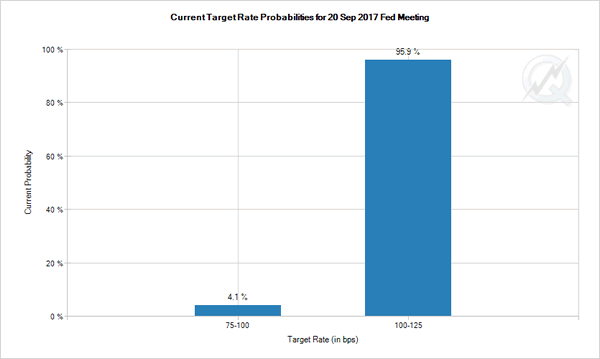
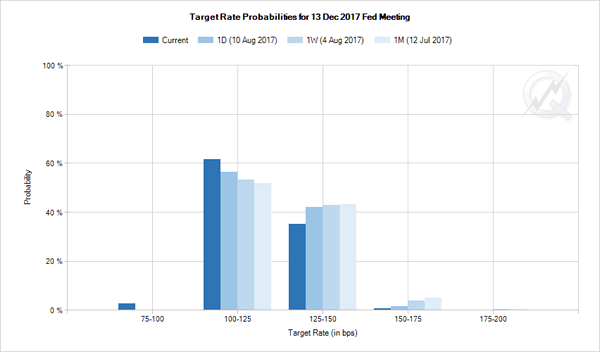
Fed fund futures pricing in 4.1% of September cut
A key takeaway from last week's development is the drastic change in Fed interest rate expectations. Risk aversion and tame inflation readers are factors contributing to the change. Also, markets keeps wondering when US President Donald Trump is going to put his focus back on the economy. Fed fund futures priced in 0% chance of a rate hike in September, that's expected. But the surprise is that they're now pricing in 4.1% chance of a rate cut in September, something that we haven't seen for some time. Meanwhile, the odds for December hike dropped to 35.9% only, comparing to 46% a week ago.
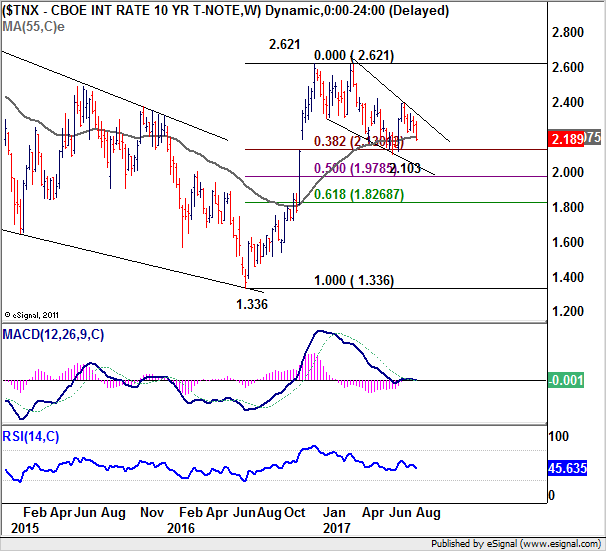
10 year yield heading back to 2.103/30 support zone
The change in market expectations is also clearly reflected in weakness in yield and Dollar. 10 year yield (TNX) dropped through 2.225 key near term support last week should be heading back to 2.103 cluster support level (38.2% retracement of 1.336 to 2.621 at 2.130. The mild downside acceleration now makes 2.103/30 quite vulnerable. We could see TNX drop further to 50% retracement at 1.9785 before completing the correction from 2.621.
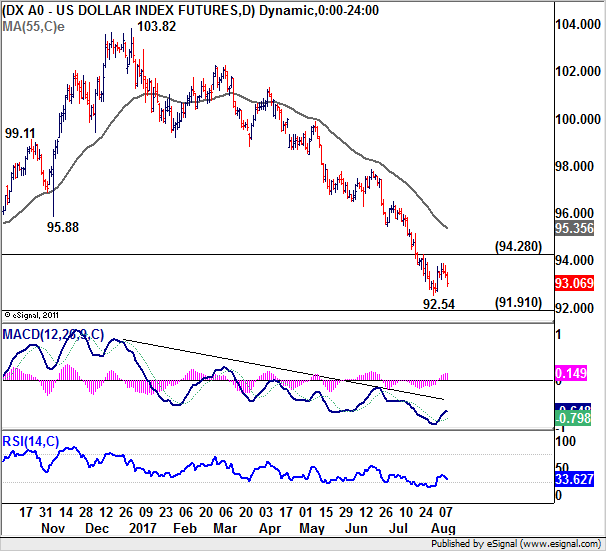
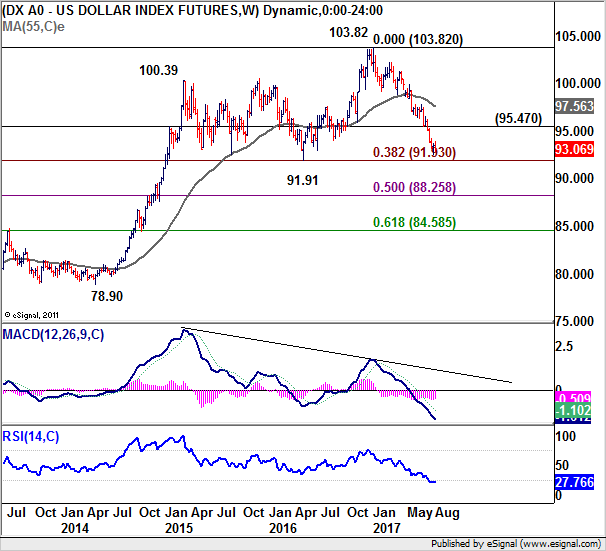
Dollar index risk breaking 91.91/3 key support
Dollar's recovery was limited well below 94.28 resistance and weakened again. More decline would be seen in near term with focus back on 91.91/3 cluster support (38.2% retracement of 72.69 to 103.82 at 91.93). At this point, we'd expect strong support from there to contain downside and bring rebound. But a firm break will extend the whole correction from 103.82 to 50% retracement at 88.25 and below.
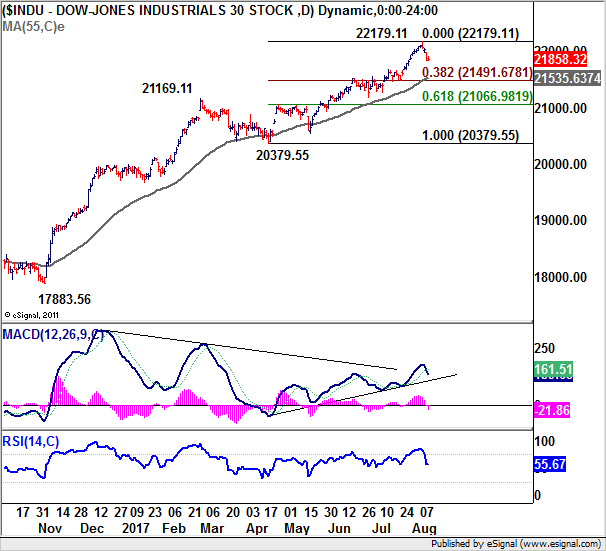
Still early to call reversal in DOW
Risk sentiment will be the main theme in the markets this week and that will be the main factor to determine which currencies will perform best. 22179.11 is clearly a short term top in DOW. Friday's mild recovery only indicates stabilization, not bottoming. Deeper fall is expected in near term. But still, it's too early to call for a trend reversal yet. Focus will be on 55 day EMA (now at 21535.63) and 38.2% retracement of 20379.55 to 22179.11 at 21491.67. The up trend is still intact as long as this levels hold and another record high is in favor. However, firm break there will indicate that fall from 22179.11 is developing into a medium term correction for support zone at 20379.55/21169.11.
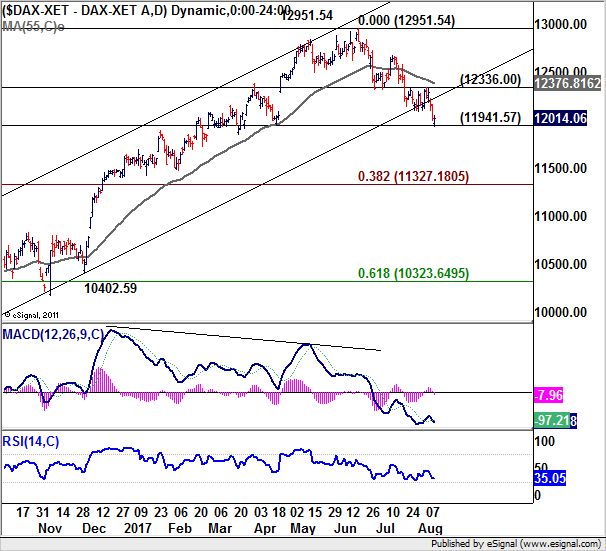
DAX likely in medium term correction
On the other hand, DAX is now more likely in a medium term correction already. That, is a medium term top is formed at 12951.54 on bearish divergence condition in daily MACD. And, this is supported by the break of channel support. Near term outlook will remain bearish as long as 12336.00 resistance holds. Break of 11941.57 support should confirm this bearish view and bring DAX lower to 38.2% retracement of 8699.29 to 12951.54 at 11327.18 before finding a bottom.
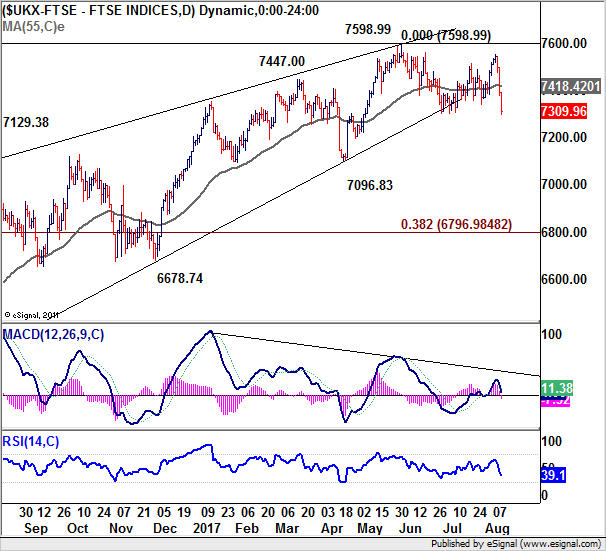
FTSE headling back to 7096 key support
FTSE's sharp fall last week and breach of 7302.71 key near term support suggests that the correction from 7598.99 medium term top is resuming. Further decline would now be seen back to 7096.83 support first. Decisive break there will confirm that fall from 7598.99 is a medium term decline and will drag it to 38.2% retracement of 5499.50 to 7598.99 at 6796.98 next.
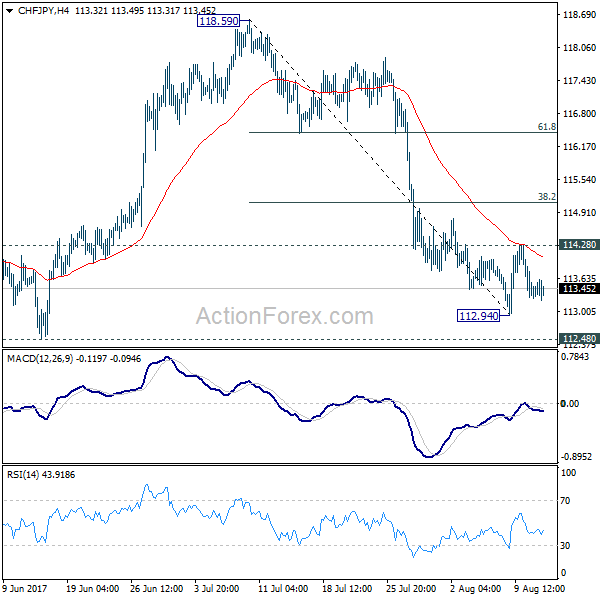
Rebound in CHF/JPY disapppointing
Based on the above analysis, risk aversion will likely continue in near term. Yen and Swiss Franc would be the ones that benefit most. We've pointed out the possibility of near term reversal in CHF/JPY during the week but the rebound from 112.94 was quite disappointing. The cross was rejected from 4 hour 55 EMA and weakened again. Initial bias will now stays neutral this week first. But considering that CHF/JPY is close to key support level at 112.48, with diminishing downside momentum, we'd still expect bottoming zone. Break of 114.28 resistance will affirm the case of reversal and target 38.2% retracement of 118.59 to 112.94 at 115.09.
Trading strategy: Close GBP/USD short, sell NZD/JPY on recovery
Regarding trading strategy, we sold GBP/USD at 1.3030 at open last week. The idea against Sterling was not too bad but Dollar clearly didn't have the momentum to sustain it's rebound. As Dollar index is now expected to resume it's recent decline, we will just close the position at market open this week first. Hopefully, we'd still be able to pocket a little bit of profit.
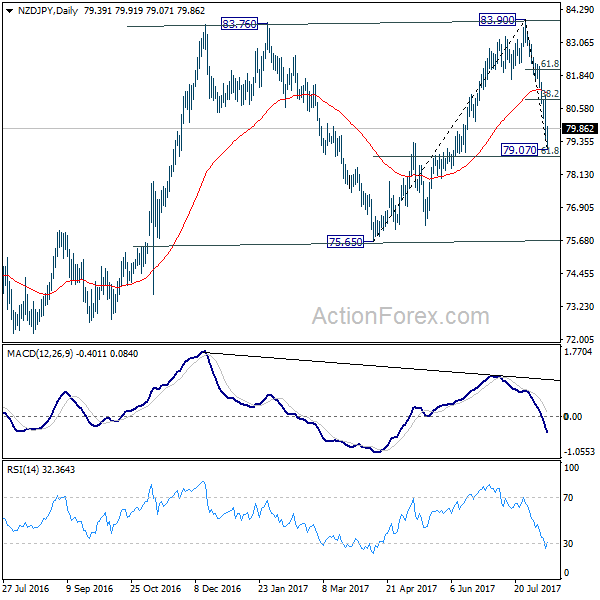
Instead, we'll look into selling NZD/JPY this week. Kiwi suffered some selloff last week as RBNZ heightened warning of the exchange rate. And as noted above, we're expecting further Yen strength in near term. There is much room for the decline from 83.90 to extend back to 75.65 support. Nonetheless, since NZD/JPY should have past its immediate selling climax after hitting 79.07, we'll try to sell it on recovery 80.85. 80.85 is slightly below 38.2% retracement of 83.90 to 79.07 at 80.91. Stop will be placed at 82.10, slightly above 61.8% retracement at 82.05. 75.65 will be the target.
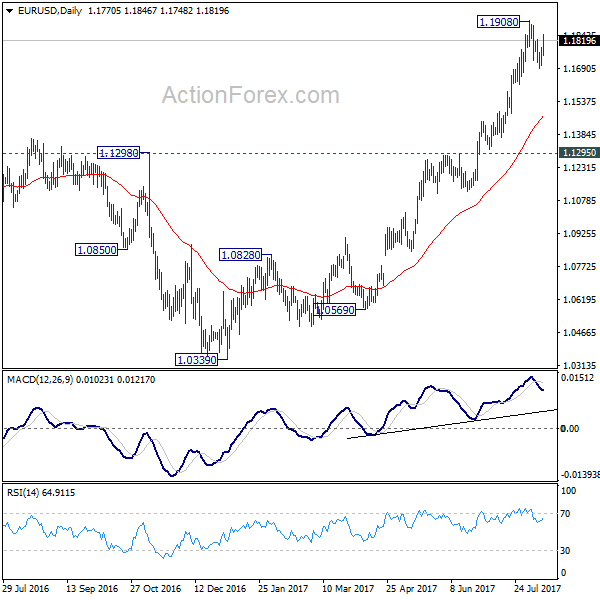
EUR/USD Weekly Outlook
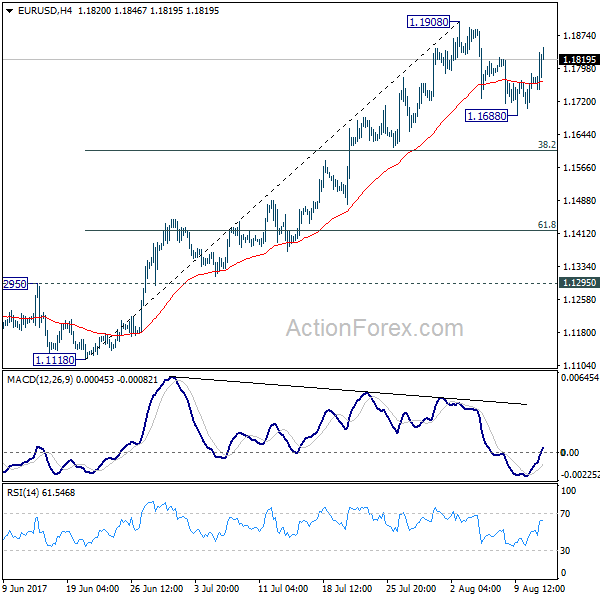
EUR/USD's pull back from 1.1908 extended to 1.1688 last week but recovered since then. With 1.1908 resistance intact, initial bias remains neutral this week for some more consolidations first. In case of another fall, downside should be contained by 38.2% retracement of 1.1119 to 1.1908 at 1.1606 to bring rebound. On the upside, break of 1.1908 will extend recent up trend to 1.2042 long term support turned resistance next.
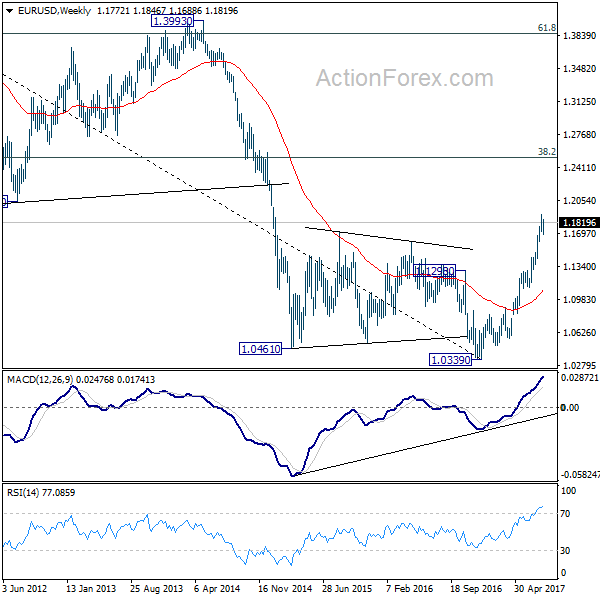
In the bigger picture, an important bottom was formed at 1.0339 on bullish convergence condition in weekly MACD. Sustained trading above 55 month EMA (now at 1.1768) will pave the way to key fibonacci level at 38.2% retracement of 1.6039 (2008 high) to 1.0339 (2017 low) at 1.2516. While rise from 1.0339 is strong, there is no confirmation that it's developing into a long term up trend yet. Hence, we'll be cautious on strong resistance from 1.2516 to limit upside. But for now, medium term outlook will remain bullish as long as 1.1295 support holds, in case of pull back.
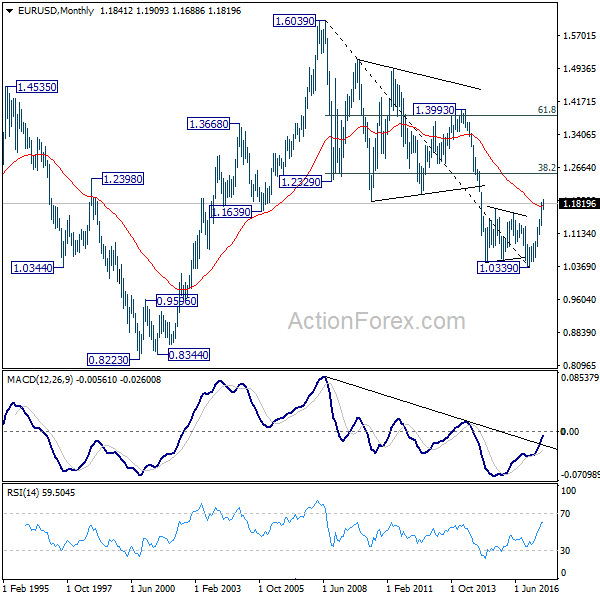
In the long term picture, 1.0339 is now seen as an important bottom as the down trend from 1.6039 (2008 high) could have completed. It's still early to decide whether price action form 1.0339 is developing into a corrective or impulsive move. But in either case, further rally would be seen to 38.2% retracement of 1.6039 to 1.0339 at 1.2516
Eco Data 8/18/17
[php_everywhere] [/php_everywhere]
Eco Data 8/17/17
[php_everywhere] [/php_everywhere]
Eco Data 8/16/17
[php_everywhere] [/php_everywhere]
Eco Data 8/15/17
[php_everywhere] [/php_everywhere]
Eco Data 8/14/17
[php_everywhere] [/php_everywhere]