Sample Category Title
US Consumer Prices Miss Forecasts; Dollar Down to One-Week Low
US core consumer prices, grew steadily for the fourth month in July, disappointing analysts who anticipated inflation to improve moderately. Following the data, the dollar retreated immediately against a basket of currencies to a one-week low, as the recent evidence on inflation, mirrored by consumer prices as well as by producer prices, indicated the weakness of prices to move toward the 2% Fed's target.
On Thursday, the US Bureau of Labor Statistics published the figures on consumer prices for the month of July. Headline inflation rose to 0.1% month-on-month (seasonally adjusted) after it showed no growth in June, undershooting the forecast of 0.2%. This drove monthly real earnings growth down to 0.2% compared to 0.5% seen in the previous month. Year-on-year, the CPI index increased by 0.1 percentage points to 1.7%, while expectations were for a rise to 1.8%.
The core CPI, which is a closely watched indicator by the Fed, as it excludes price volatility stemming from food and energy sectors and therefore is a better proxy of longer-term inflationary pressures, remained flat at 0.1% month-on-month. This was below 0.2% forecasted. On a yearly basis, the index was in line with expectations at 1.7%.
Looking at the details underpinning the records, gasoline prices continued weighing significantly on the index in July, falling the most among sectors by 2.8% month-on-month, while airline fares which dropped by 2.7% in June, improved by 0.7% in July. The fall in transportation costs softened from the negative 0.7% to a negative 0.1%.
Taking into account disappointing readings on US PPI which experienced the largest drop in 11 months in July, as well as today's softer US CPI, the odds for a third rate hike this year have diminished as inflation doesn't show any sign of approaching the Fed's target of 2%. However, further economic data releases in the next months will give a clearer picture on inflation before Fed policymakers gather to decide on the future rate path.
Turning to the reaction in the forex markets, the dollar index fell to a one-week low of 92.99 from round 93.40. Euro/ dollar gained the most, surging by 0.65% to 1.1834 from 1.1753.The pair was last trading at 1.1785. Dollar/yen dropped below the 109 key level to 108.71 but managed to recover soon after, picking up to 109.16.
Consumer Inflation Remains Soft in July
Coming in shy of expectations, headline and core CPI inflation ticked higher in July. Debate amongst Fed officials should remain robust as they assess whether the inflation backdrop warrants a near-term rate hike.
Inflation Pressures Remain Tame
Following soft monthly performances in May and June, the headline Consumer Price Index (CPI) edged higher in July, rising at 0.1 percent. The modest gain, however, missed expectations and, therefore, continues to paint a backdrop of tame inflationary pressures.
Marking its third consecutive decline, the energy index slipped 0.1 percent in July as natural gas prices registered their largest monthly decline since April 2015. Retail gasoline prices were unchanged on the month. Consumer food prices increased 0.2 percent in July, supported by matching increases in food both at, and away from, home.
Inflation pressures were no greater when excluding food and energy. Core CPI also edged up a weaker-than-expected 0.1 percent on the month, keeping the year-over-year pace steady at 1.7 percent. The shelter index recorded its smallest increase since March (0.1 percent). This modest gain, however, was primarily due to the record 4.2 percent plunge in lodging. Weakness was also seen in new vehicles, down 0.5 percent, its largest monthly decline since August 2009, and wireless services (-0.3 percent). Encouragingly, both apparel and airfares ended multi-month slides, rising 0.3 percent each, and medical care continues to post solid monthly gains.
Plenty of Runway to December, But Trajectory Needs to Turn
As we have cautioned, the runway to a potential December Fed interest rate increase is still somewhat long, giving opportunity for a change of trajectory to take place (note, four more CPI updates before the December 13 FOMC meeting). While this month's performance missed the chance to show a start to that quickening in the pace of inflation needed to cement the third Fed rate hike this year, it is encouraging that the recent slide stabilized somewhat.
In the July FOMC policy statement, officials continued to characterize consumer inflation as running below target, though they reaffirmed confidence that the target will be met over the medium-term horizon. Today's CPI performance does not inspire a lot of confidence that officials are on course for another rate hike this year, though any concerns over a September balance sheet normalization announcement not unfolding have fully dissipated. As previously cited, the Fed will remain on attentive watch for all incoming inflation indicators to better gauge attainability of their symmetric inflation goal. Our outlook projects a gradual firming in the pace of consumer inflation over the coming quarters. That quickening in the pace of consumer inflation is needed for officials to seriously consider further rate tightening at year's end. If the pace of inflation fails to turn higher over the coming months, projections for another rate hike this year should dissipate even further and push the next Fed rate hike into 2018.
Slower Inflation Growth in the US Results in EUR/USD Rise
The price of EUR/USD demonstrates positive dynamics after the release of important macro statistics on the consumer price index in the US, the growth of which was only 0.1% in July, doubly worse than the average forecast. Lower than expected inflation growth will restrain the FOMC from another round of rate increases until the end of the year, which in turn puts pressure on the US dollar that is also hit by political tensions within the US. The news on consumer inflation growth by 0.4% in Germany and 0.3% decline in France had little impact on the sentiment of traders.
The demand for defensive assets including the Japanese Yen, Swiss franc and gold remains high. The reason for such an interest was the Korean crisis which flared after news of potential attacks on American territory and the promise of Donald Trump to show "fire and fury" in response to the threat of nuclear attacks. Today in Japan there is a public holiday, but on Monday it will take centre stage due to the preliminary report on the GDP growth in Japan.
The oil price keeps mowing downward after a recent correction, despite the depreciation of the US dollar. Bears got some support from the recent statistics according to which the oil output within the OPEC increased in July by 173.000 barrels per day to 32.87 million barrels per day. At the same time production growth in Libya has been the fastest since the beginning of the year.
EUR/USD
The EUR/USD has shown a sharp upward movement and as a result has broken the upper limit of the descending channel and the resistance at 1.1800. This fact points to the high possibility of further growth until 1.1900 and 1.2000. In case of the fall resumption, the potential target will be at 1.1700.
USD/JPY
The USD/JPY quotes are moving along the lower limit of the descending channel. Now bears are trying to pull the price under the support at 109.00. In case of success, the immediate goals will be at 108.00 and 107.00. We do not exclude the price rebound from the lower limit of the channel with potential targets at 110.30 and 110.75. In such case the stop may be set under the 108.60.
WTI
The American oil benchmark WTI was unable to gain a foothold above the psychologically important level of 50.00 and started to correct downwards. After the strong decline, quotations may restore some positions and reach SMA100 on the 15-minute chart or even 49.00. The next targets within the saving current impulse will be at 47.75, 46.75 and 45.40.
US-North Korea Dispute Remains on the Forefront; Dollar Weakens on Inflation
Rising tensions between North Korea and the United States were once again the theme of the day with only the release of much-awaited inflation figures out of the US managing to divert attention away from developments on that front. Inflation numbers surprised to the downside, leading the dollar to post considerable losses relative to other major currencies within the first minutes of data release.
The all-important July inflation numbers out of the US failed to satisfy dollar bulls' hopes of strongly putting a Fed rate hike later in the year back on the table. In particular, July headline inflation came in at 0.1% month-month in July, falling short of expectations for CPI growth to stand at 0.2% – still this was better than June's 0.0%. On an annual basis, inflation grew by 1.7%, below the 1.8% that was expected but above the 1.6% from the previous month. Core inflation that excludes volatile food and energy items grew at a pace of 0.1% m/m, the same as in June but below the forecasted 0.2%. Year-on-year, the measure remained unchanged relative to June – it stood at 1.7% as expected. Odds of a Fed rate rise during the December meeting currently stand at around 40% according to the CME Group's 30-day Fed Fund futures prices.
In terms of forex market movements, the US currency lost significant ground relative to majors including the yen, sterling and the euro – most notably the latter one – as the news on inflation went public. Interestingly though, it soon after managed to more than make up for its losses relative to the Japanese and British currencies, while it recovered a significant portion of its losses versus the euro as well.
The dollar index, which gauges the greenback against the currencies of six major US trading partners, was last 0.2% down on the day during afternoon European trading hours – it stood at 93.20. It fell to a one-week low of 92.99 a few minutes after the release of inflation figures. Meanwhile, euro/dollar was 0.2% up, just shy of the 1.18 handle, pound/dollar was flat, having earlier hit a three-week low of 1.2939 and dollar/yen was 0.1% down above the 109 level – the pair fell to 108.72 after the data on US CPI, its lowest since April 20.
The US-North Korea spat that allowed safe havens to rally this week continued during today's European session. US President Donald Trump added to the heat by tweeting that "Military solutions are now fully in place,locked and loaded,should North Korea act unwisely. Hopefully Kim Jong Un will find another path!" [sic]. North Korea accused him of driving the Korean Peninsula to the brink of nuclear war. Safe-haven perceived gold rose to a more than two-month high of $1291.99 an ounce during today's trading. It later retreated to last trade slightly below the day's open at $1286.49. The precious metal posted hefty gains in the three preceding days. The Swiss franc, another safe-haven, failed to maintain momentum from earlier days, losing ground relative to the euro and was last broadly flat versus the dollar after dollar/franc fell to a fresh two-week low 0.9582 earlier in the day.
Turning to the oil-linked loonie, it managed to post some gains relative to the greenback despite weakening oil prices. Dollar/loonie was last down 0.3% and below the 1.27 mark after rising to a one-month high of 1.2752 earlier in the day. The pair advanced in the preceding nine out of ten trading days.
Concluding with oil, WTI was last 1.0% down on the day, just above $48 a barrel, while Brent crude was 0.9% down, around $51.40 a barrel.
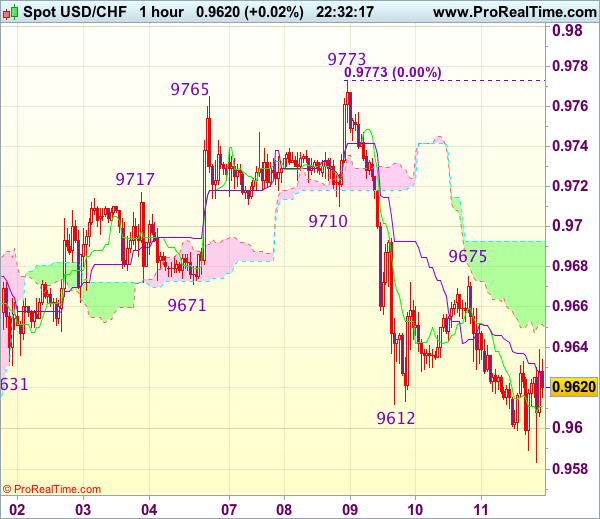
Trade Idea Wrap-up: USD/CHF – Hold long entered at 0.9610
USD/CHF - 0.9626
Most recent candlesticks pattern : N/A
Trend : Near term down
Tenkan-Sen level : 0.9611
Kijun-Sen level : 0.9621
Ichimoku cloud top : 0.9693
Ichimoku cloud bottom : 0.9652
Original strategy :
Bought at 0.9610, Target: 0.9710, Stop: 0.9575
Position : - Long at 0.9610
Target : - 0.9710
Stop : - 0.9575
New strategy :
Hold long entered at 0.9610, Target: 0.9710, Stop: 0.9580
Position : - Long at 0.9610
Target : - 0.9710
Stop : - 0.9580
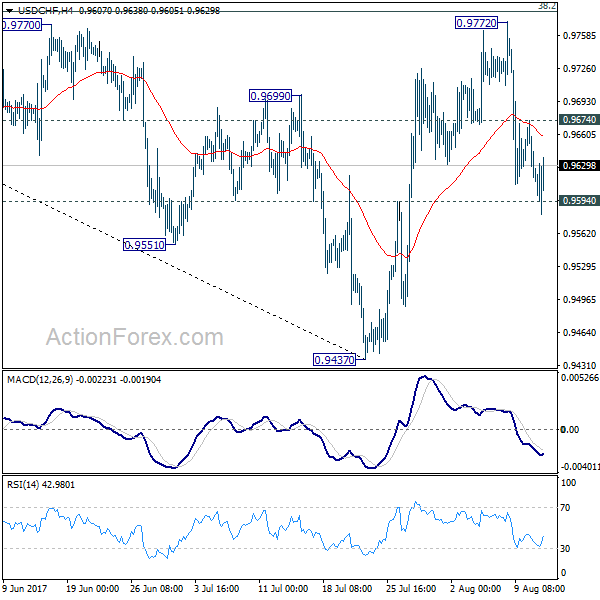
Although the greenback dropped again in NY morning, loss of near term downward momentum should prevent sharp fall below 0.9580 and upside risk remains for another rebound, above 0.9640-45 would bring test of resistance at 0.9675 but break of latter level is needed to signal an intra-day low is formed, bring test of previous support at 0.9710, above there would provide confirmation, bring stronger rebound to 0.9740 but price should falter well below 0.9773.
In view of this, we are holding on to our long position but one must exit on such rebound. Below 0.9580 would signal the fall from 0.9773 top is still in progress for retracement of recent upmove to 0.9565-70 (61.8% Fibonacci retracement of 0.9438-0.9773), then 0.9550 but price should stay well above support at 0.9490.
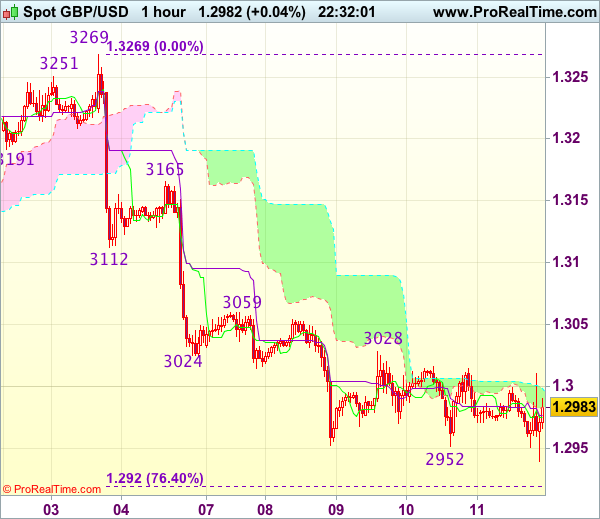
Trade Idea Wrap-up: GBP/USD – Stand aside
GBP/USD - 1.2981
Most recent candlesticks pattern : N/A
Trend : Near term down
Tenkan-Sen level : 1.2986
Kijun-Sen level : 1.2983
Ichimoku cloud top : 1.3003
Ichimoku cloud bottom : 1.2996
New strategy :
Stand aside
Position : -
Target : -
Stop : -
Despite falling marginally to 1.2940 in NY morning, lack of follow through selling and the subsequent rebound suggest further consolidation would take place and another bounce to 1.3025-30 cannot be ruled out, however, reckon upside would be limited to resistance at 1.3059 and price should falter below 1.3085-90 and bring another decline later.
On the downside, below said support at 1.2940 would signal recent fall from 1.3269 top has resumed and extend weakness to previous chart support at 1.2933 but reckon 1.2900 would hold from here, risk from there has increased for a rebound to take place later. As near term outlook is still mixed, would be prudent to stand aside for now.
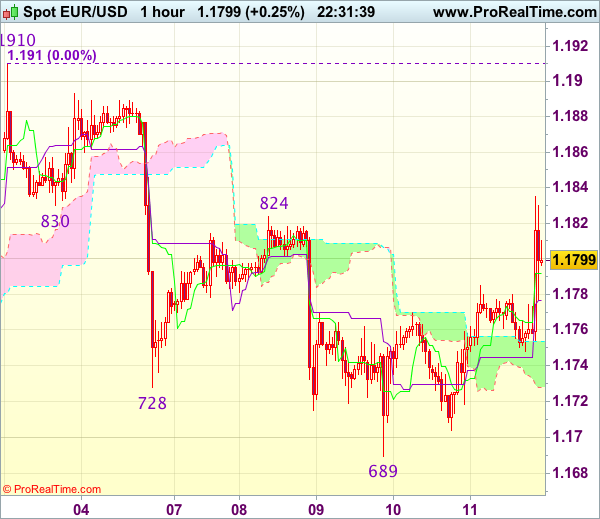
Trade Idea Wrap-up: EUR/USD – Hold long entered at 1.1790
EUR/USD - 1.1795
Most recent candlesticks pattern : N/A
Trend : Near term up
Tenkan-Sen level : 1.1792
Kijun-Sen level : 1.1777
Ichimoku cloud top : 1.1754
Ichimoku cloud bottom : 1.1728
Original strategy :
Bought at 1.1790, Target: 1.1890, Stop: 1.1755
Position : - Long at 1.1790
Target : - 1.1890
Stop : - 1.1755
New strategy :
Hold long entered at 1.1790, Target: 1.1890, Stop: 1.1755
Position : - Long at 1.1790
Target : - 1.1890
Stop : - 1.1755
Current rally in NY morning adds credence to our view that low has been formed at 1.1689 earlier this week and further gain to 1.1850, then 1.1880 would be seen, however, a firm break above latter level is needed to confirm correction from 1.1910 top has ended, bring retest of this level, break there would signal early upmove has resumed and extend headway towards 1.1940-50 first.
In view of this, we are holding on to our long position entered at 1.1790. Only below support at 1.1748 would defer and risk weakness to 1.1720, however, downside should be limited to 1.1700 and support at 1.1689 should remain intact, bring another rally next week.
Trade Idea Wrap-up: USD/JPY – Sell at 109.70
USD/JPY - 109.13
Most recent candlesticks pattern : N/A
Trend : Near term down
Tenkan-Sen level : 109.07
Kijun-Sen level : 109.22
Ichimoku cloud top : 110.20
Ichimoku cloud bottom : 109.85
Original strategy :
Sell at 109.50, Target: 108.50, Stop: 109.85
Position : -
Target : -
Stop : -
New strategy :
Sell at 109.70, Target: 108.70, Stop: 110.05
Position : -
Target : -
Stop : -
As the greenback has fallen again after brief recovery and fell to a fresh 4-month low in NY morning, adding credence to our view that recent decline is still in progress and bearishness remains for weakness to 108.50, then towards previous chart support at 108.13, however, loss of near term downward momentum should prevent sharp fall below there and reckon 108.00 would hold on first testing.
In view of this, would not chase this fall here and would be prudent to sell dollar on recovery as previous support at 109.54 should turn into resistance and limit dollar’s upside. Above the lower Kumo (now at 109.85) would risk test of indicated resistance at 110.18 but break there is needed to abort and signal recent decline has ended and risk a stronger rebound to 110.50 but price should falter below another previous resistance at 110.83.

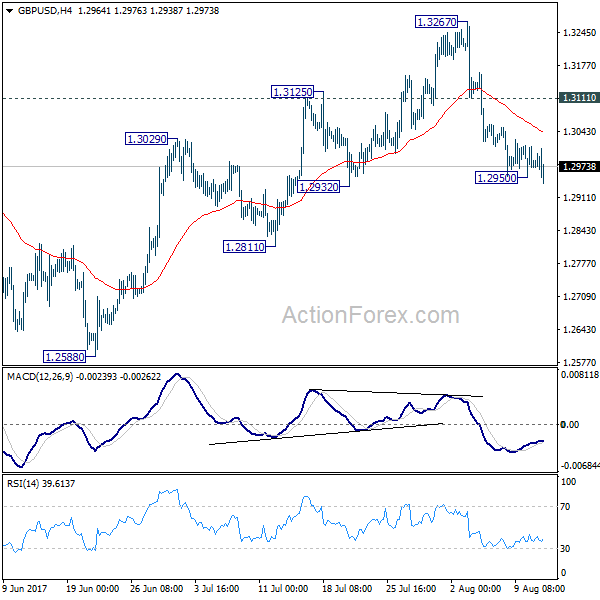
GBP/USD Mid-Day Outlook
Daily Pivots: (S1) 1.2946; (P) 1.2980; (R1) 1.3011; More...
Breach of 1.2950 suggests that GBP/USD's fall from 1.3267 is resuming. Intraday bias is back on the downside. . As noted before, price actions from 1.1946 are seen as a corrective pattern and could have completed at 1.3267. Break of 1.2932 will affirm this bearish case and target 1.2588 key near term support for confirmation. However, break of 1.3111 resistance will turn bias back to the upside for retesting 1.3267 high.
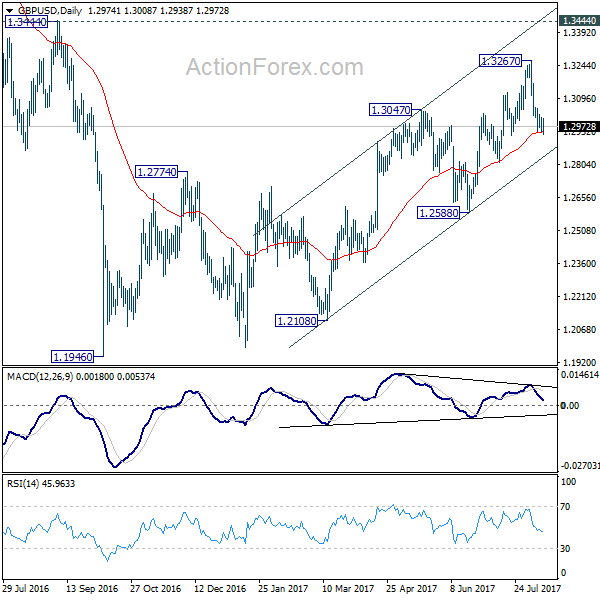
In the bigger picture, overall, price actions from 1.1946 medium term low are seen as a corrective pattern that is still in progress. While further upside is expected, larger outlook remains bearish as long as 1.3444 key resistance holds. Down trend from 1.7190 (2014 high) is expected to resume later after the correction completes. And break of 1.2588 will indicate that such down trend is resuming.
USD/CHF Mid-Day Outlook
Daily Pivots: (S1) 0.9603; (P) 0.9639; (R1) 0.9660; More...
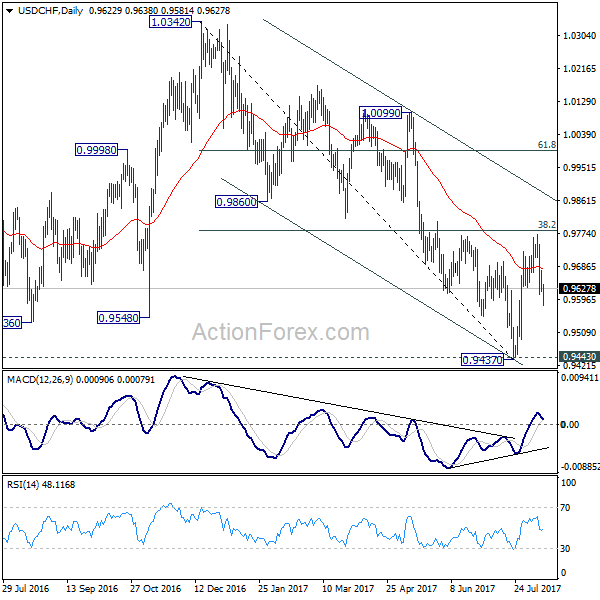
USD/CHF breached 0.9594 support but quickly recovered. Intraday bias stays neutral first. Outlook is a bit mixed as the pair is bounded inside medium term falling channel. The pair was also limited below 38.2% retracement of 1.0342 to 0.9437 at 0.9783. Firm break of 0.9594 will dampen our bullish view and turn bias back to the downside for 0.9437. This could also extend the fall through 1.0342 through 0.9437/43 key support level. On the upside, above 0.9772 will revive the bullish case of reversal and turn bias back to the upside.
In the bigger picture, current development argues that USD/CHF has successfully defended 0.9443 key support level. And long term range trading in 0.9443/1.0342 is extending with another rise. At this point, there is no sign of an up trend yet. Hence, while further rise is expected in USD/CHF, we'll start to be cautious on loss of momentum above 61.8% retracement of 1.0342 to 0.9437 at 0.9996.