Sample Category Title
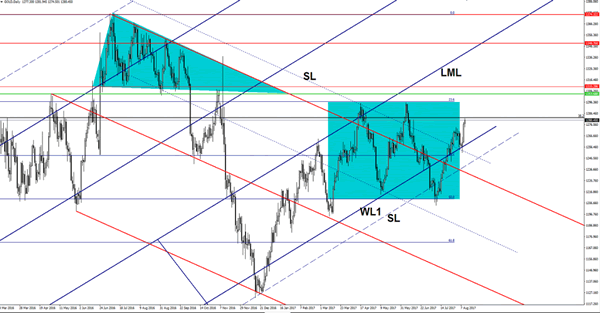
USD/CAD Extends The Latest Gains
Price edges higher ahead the US and the Canadian economic figures. Is strongly bullish on the short term and looks determined to recover much more after the impressive drop. Technically is expected to climb much higher because is located in the buyer's territory, only some poor US numbers will turn the rate to the downside again.
USD/CAD will be driven by the fundamental factors later, remains to see the direction, but a USDX's further increase will force the pair to climb higher as well.
The US PPI may increase by 0.1% in the previous month, matching the 0.1% growth in June, while the Unemployment Claims are expected to remain steady at 240K in the previous week. The Core PPIcould resume the uptrend, is forecasted to increase by 0.2%, more versus the 0.1% in the former reporting period. The Federal Budget Balance and the Natural Gas Storage will release as well, but I don't think that will bring anything.
Keeps rallying after the breakout above the 1.2678 static resistance (resistance turned into support) and looks determined to reach the next upside targets from the warning line (wl3) and the median line (ML) of the major descending pitchfork. Actually, the rate could be attracted by the confluence area formed by the third warning line (wl3) and the median line (ML), where he may find resistance again. However, a valid breakout through the confluence area will accelerate the upside momentum.
I want to remind you that is still under some pressure as long as is trading within the minor descending pitchfork's body and below the median line (ML) of the major descending pitchfork. The upside momentum towards the ML is natural after the failure to reach the LML.
EUR/JPY Breakdown Needs Confirmation
Price is trading in the red and tries to take out some major support levels to be able to start a broader drop. Is trading right above the 38.2% retracement level, which represents the last obstacle that needs to be ignored.
I've said in the previous articles that the bulls seem exhausted and could lose control. EUR/JPY goes down as the Yen is pushed higher by the Nikkei's amazing drop. The JP225 index plunges and is located much below the 19700 static support and is expected to drop much deeper. This situation will help the Yen to dominate the currency market.
EUR/JPY ignored the median line (ml), the upper median line (ML) and the sliding line (sl), but further sell-off will be confirmed below the 38.2% retracement level.
Gold Under First Upside Target
Gold shines despite the USD's growth and is almost to hit a major upside target. You can see that is very close to reach and retest the 38.2% retracement level, where he could find temporary resistance. Is trading above the $1280 per ounce and is expected to climb towards the $1295 per ounce in the upcoming days.
Korean Angst Eases Off But Gold Still Up | Yen, Euro, Sterling Face Sell- Off | Oil Steady
- Tensions around North Korea impacting the equity markets
- Euro-dollar suffer from profit taking
- Vix still sleeping
Heightened geopolitical uncertainty isn't something which is making the headlines for the first time, therefore, the dust created by this does settle more rapidly. This is reflected in the equity market today (the futures are trading higher for the FTSE). In the latest war of words between the US and North Korea, the officials from North Korean Peninsula have played down the fear of a full-blown nuclear war. "Load of nonsense" is the phrase which could stimulate some bargain hunters to step back, especially if Donald Trump sees the underlying message of cease fire here.
The intense situation ducked investors from jumping into a full risk-on mode and this helped the yellow metal to score more gains. The momentum would remain strong as long as the rhetorical brinkmanship between President Trump and North Korea does not come to an end. The VIX index failed to show any signs of explosions yesterday and with easing tension, we would expect the index to go further into the sleep mode today. Perhaps, more unconventional presidential comments are something which has become the new norm for the markets.
Back in the Eurozone, the Euro-dollar pair is suffering from profit taking as larger long bets are unwinding. The currency has surged nearly 13 percent against the dollar so far this year and this makes it best-performing currency the major currency. But the strength of the darling currency would be worrisome for the ECB hence investors are quick in taking some chips off the table. Mario Draghi has been fighting an uphill battle with inflation and a stronger euro will not only impact the imports of the Eurozone but it would also suppress the inflation and the ECB simply cannot let that happen. The Jackson Hall event is not far and it is widely expected that Mario Draghi will lay down the initial sketch for winding down the monetary policy. Remember that the bank will still be purchasing the bonds but just at a slower pace. Therefore, the size of the ECB balance sheet would still continue to increase while the Fed would be in a process of reducing their balance sheet
Over in Asia, the economic data out of Japan was simply rotten. Look at the core orders, they literally took a nose dive and fell 1.9 percent when the forecast was for an increase of 3.7 percent. This is not a great thing for the BOJ and for the Japanese yen. We have three consecutive fall in this number and it should the ring alarm bells for the central bank.
For Sterling traders, the focus is solely on the latest manufacturing and Industrial production number. The forecast for today is rather optimistic and the ONS numbers have been consistently adverse but if you look at the independent surveys, they are more optimistic. Industrial production, construction output and trade balance, all of them are expected to improve and this set the stage for disappointment.
Oil traders celebrated the crude inventory data which showed the longest week of back to back declines since May. Compliance is the vital issue for OPEC and traders are going to remain focused on it. We are far from being out of the woods and the oil market is going to remain in and out of positive territory unless there is a clear evidence that the demand and supply equation is close to equilibrium. From a technical perspective, we are stuck in a narrow range and only a break of $50 would confirm a new trend.
Market Update – Asian Session: European Industrial Production Data Mixed in Session
Notes/Observations
- Rhetoric from the US and North Korean officials is the main driver
- Focus on Fed's Dudley (dove, FOMC voter). Previously noted that Inflation was a little lower that what the Fed would like but believed Wages, inflation should pick up - European June Industrial Data mixed in session (France misses, UK beats)
Overnight
Asia:
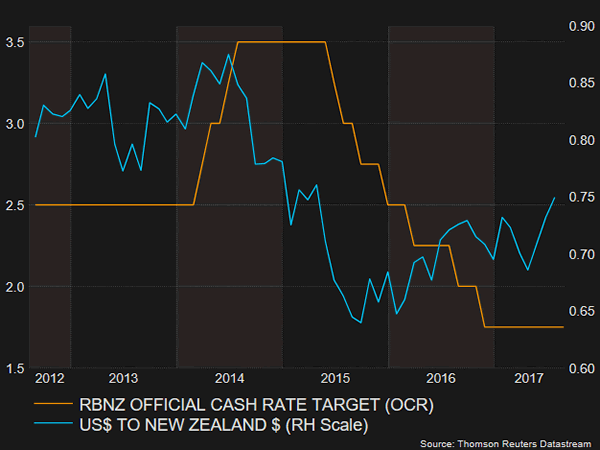
- RBNZ keeps policy steady (as expected). Gov Wheeler noted that very much Neutral on rates and for foreseeable future did NOT see OCR increasing. Thus would allow the economy to run hot before starting to reduce monetary accommodation
- North Korea govt: our military will have a strike plan against Guam prepared by mid-August, then await orders from our leader
- US Defense Sec Mattis: North Korea's Kim Jong-un should take heed of UN Security Council's unified voice
Europe:
- UK July RICS House Price Balance: 1% v 9%e
Americas:
- Fed's Evans (dove, voter): Dec Fed rate hike is possible, depends on inflation
- Fed's Bullard (non-voter, dove): Fed can leave rates on hold for now and evaluate data; Fed has been surprised by inflation on the downside
Economic Calendar
- (NO) Norway July CPI (beats) M/M: 0.3% v 0.2%e; Y/Y: 1.5% v 1.4%e
- (NO) Norway July CPI Underlying M/M: 0.3% v 0.3%e; Y/Y: 1.2% v 1.1%e
- (FR) France Jun Industrial Production (miss) M/M: -1.1% v -0.6%e ; Y/Y: 2.6% v 3.1%e
- (FR) France Jun Manufacturing Production (beat) M/M: -0.9% v -1.0%e; Y/Y: 3.3% v 3.2%e
- (DK) Denmark July CPI M/M: +0.8 v -0.1% prior; Y/Y: 1.5% v 0.8%e
- (DK) Denmark July CPI EU Harmonized M/M: +1.0% v -0.2% prior; Y/Y: 1.5% v 0.4% prior
- (SE) Sweden Jun Industrial Production M/M: +0.8% v -0.3%e; Y/Y: 8.5% v 7.5% prior
- (PH) Philippines Central Bank (BSP) left its Overnight Borrowing Rate unchanged at 3.00% (as expected)
- (UK) Jun Industrial Production (beat) M/M: 0.5% v 0.1%e; Y/Y: +0.3% v -0.1%e
- (UK) Jun Manufacturing Production (in-line) M/M: 0.0% v 0.0%e; Y/Y: 0.6% v 0.6%e
- (UK) Jun Visible Trade Balance (miss): -£12.7B v -£11.0Be; Overall Trade Balance: -£4.5B v -£2.5Be; Trade Balance Non EU: -£4.5B v -£3.0Be
**Fixed Income Issuance:
- (IT) Italy Debt Agency (Tesoro) sold €6.5B vs. €6.5B indicated in 12-month Bills; Avg yield: -0.337% v -0.352% prior; Bid-to-cover: 1.63x v 1.65x prior
SPEAKERS/FIXED INCOME/FX/COMMODITIES/ERRATUM
**Equities**
Indices [Stoxx50 -0.7% at 3,444, FTSE -1.1% at 7,410, DAX -0.7% at 12.065, CAC-40 -0.5% at 5,119, IBEX-35 -0.7% at 10,525, FTSE MIB -0.4% at 21,764, SMI -0.3% at 9,003, S&P 500 Futures -0.4%]
Market Focal Points/Key Themes: European stocks opened lower and continued to underperform; geopolitical concerns still weighing on risk sentiment; commodities higher but again fail to support materials stocks; Hannover Re fell despite beating estimates due to disappointing development in life/health insurance; upcoming US earnings include Kohl's, Perrigo, Macy's and News Corp
Equities
- Consumer discretionary [Adecco [ADEN.CH] -5.5% (Earnings), Heidelberger Druck +8.5% (Earnings)]
- Materials: [Glencore [GLEN.UK] -1.4% (Earnings)]
- Industrials: [Henkel [HEN.DE] -2.7% (Earnings), ThyssenKrupp +1.2% (Earnings)]
- Financials: [Hanover Re [HNR1.DE] -3% (Earnings), Aegon [AGN.NL] +7.4% (Earnings, Divestment), Prudential -1.3% (Earnings, combines UK businesses)]
- Technology: [United Internet [UTDI.DE] -2.6% (Earnings)]
- Healthcare: [Galapagos [GLPG.BE] +17% (Top line results in FLORA Phase 2a trial)]
Speakers
- Ukraine Central Bank stated that it saw more risks for increase in 2017 CPI
- South Korea govt official: To take all necessary steps to ease tensions on Peninsula. Door is open for dialogue with North Korea
- Philippines Central Bank policy statement reiterated its view that current policy settings was appropriate and that inflation risks were tilted to the upside. It did raise its CPI forecast for 2017 thru 2019 period but CPI forecast to remain close to midpoint over forecast horizon
Currencies
- Safe haven currencies (CHF and JPY) consolidate recent gains inspired by a deepening anxiety over tensions between the United States and North Korea. Political commentators warn that this time may be different but markets only price a modest concern with tensions in the region having existed for decades and ultimately blow over
- The NZD currency (Kiwi) was softer after the RBNZ Gov indicated that the OCR stay steady for the foreseeable future. The NZD/USD fell to test 7262 as RBNZ indicated that the OCR would remain unchanged until mid-2019 compared to market pricing for the first hike by around August next year. Kiwi has fallen for 6 of the past 8 days). The July low around the .7200 level is a key support
Fixed Income
- Bund futurestrades at 163.80 up 6 ticks and continuing to respect crucial support at the 163.48 level. Downside targets 162.67 followed by 162.56. To the upside the 165.00 to 165.20 remains key resistance.
- Gilt futurestrades at 127.40 down 1 tick, with a limited reaction to the UK Industrial Output beat. A continuation to the upside eyeing 127.75 then 128.25. A move back above 126.51 targets 125.97
- Thursday's liquidity report showed Wednesday's use of the marginal lending facility fell to €97M from €197M prior.
- Corporate issuancesaw $5.15B come to market via 3 issuers headlined by McCormick & Company $2.5B 4-part offering of senior unsecured notes.
Looking Ahead
- 05:30 (ZA) South Africa Jun Total Mining Production M/M: 0.0%e v -0.2% prior; Y/Y: -0.6%e v +3.6% prior; Gold Production Y/Y: No est v -3.4% prior; Platinum Production Y/Y: No est v -17.5% prior
- 05:30 (HU) Hungary Debt Agency (AKK) to sell 12-month Bills;
- 05:30 (HU) Hungary Debt Agency (AKK) to sell floating rate notes - 05:30 (PL) Poland to sell Bonds
- 06:00 (IL) Israel July Consumer Confidence: No est v 126 prior
- 06:00 (PT) Portugal July CPI M/M: No est v -0.4% prior; Y/Y: No est v 0.9% prior
- 06:00 (PT) Portugal July CPI EU Harmonized M/M: No est v -0.5% prior; Y/Y: 1.0%e v 1.0% prior
- 06:00 (IE) Ireland July CPI M/M: No est v 0.1% prior; Y/Y: No est v -0.4% prior
- 06:00 (IE) Ireland July CPI EU Harmonized M/M: No est v 0.1% prior; Y/Y: No est v -0.6% prior
- 06:45 (US) Daily Libor Fixing - 06:45 OPEC Monthly Report
- 07:00 (ZA) South Africa Jun Manufacturing Production M/M: -0.6%e v -0.3% prior; Y/Y: -2.7%e v -0.8% prior
- 07:00 (BR) Brazil Aug IGP-M Inflation (1st Preview): -0.2%e v -1.0% prior
- 08:00 (UK) July NIESR GDP Estimate: 0.3%e v 0.3% prior
- 08:00 (BR) Brazil CONAB Corp Report
- 08:00 (UK) Baltic Dry Bulk Index
- 08:30 (US) July PPI Final Demand M/M: 0.1%e v 0.1% prior; Y/Y: 2.2%e v 2.0% prior
- 08:30 (US) July PPI Ex Food and Energy M/M: 0.2%e v 0.1% prior; Y/Y: 2.1%e v 1.9% prior
- 08:30 (US) July PPI Ex Food, Energy, Trade M/M: 0.2%e v 0.2% prior; Y/Y: No est v 2.0% prior
- 08:30 (US) Initial Jobless Claims: 240Ke v 240K prior; Continuing Claims: 1.96Me v 1.968M prior
- 08:30 (CA) Canada Jun New Housing Price Index M/M: 0.5%e v 0.7% prior; Y/Y: No est v 3.8% prior
- 08:30 (CL) Chile Central Bank Economist Survey
- 08:30 (US) USDA weekly Net Export Sales
- 09:00 (RU) Russia Gold and Forex Reserve w/e Aug 4th: No est v $418.9B prior
- 10:00 (US) Fed's Dudley (Voter, dove)
- 10:30 (US) Weekly EIA Natural Gas Inventories
- 11:00 (BR) Brazil to sell 2018, 2019 and 2022 LTN bills
- 12:00 (US) USDA World Agricultural Supply and Demand Estimates (WASDE) Crop Report
- 13:00 (US) Treasury to sell $15B in 30-year bonds
- 14:00 (MX) Mexico Central Bank (Banxico) Interest Rate Decision: Expected to leave Overnight Rate unchanged at 7.00%
- 14:00 (US) July Monthly Budget Statement : -$52.0Be v -$90.2B prior
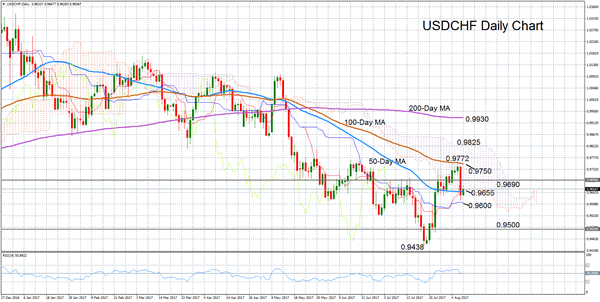
USDCHF Turns Neutral In Short Term, Outlook Still Bearish
USDCHF has rebounded from near two-year lows of 0.9438 set in July to a 7-week high of 0.9772 this week, climbing back into the Ichimoku cloud. However, it’s ascent into the cloud was cut short after the pair found resistance at the 100-day exponential moving average. It has since dropped back below the cloud, with the bottom of the cloud currently providing resistance around the 0.9655 area. The RSI has fallen to around the 50 mark, pointing to a neutral bias in the near term.
Should prices continue declining, the kijun-sen line will likely act as the next support at just above the 0.96 handle. Below that, the psychological 0.95 level could prove another barrier before the pair challenges the July 21 low of 0.9438. A breach of this low would signal a resumption of the longer-term downtrend that began in January.
In the event of a fresh push into the Ichimoku cloud, the previous resistance level of 0.9690 could stand in the way of the 100-day exponential moving average, which is currently at 0.9750. A break above this level would open the way towards the top of the cloud at 0.9825. However, without a sustained rally that would take prices to the 200-day moving average at around 0.9930, the medium-term outlook will remain bearish.
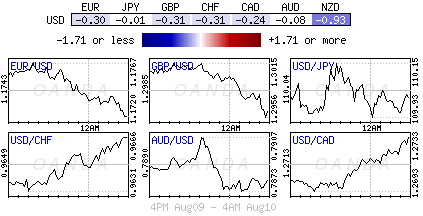
North Korea Nerves Weigh On Equities Again, Dollar And Gold Higher
Thursday August 10: Five things the markets are talking about
Market tension re-North Korea continues to sap global equity markets, with Euro bourses following their Asian counterparts into the red ahead of the U.S open as the saber rattling continues and investors remain on edge.
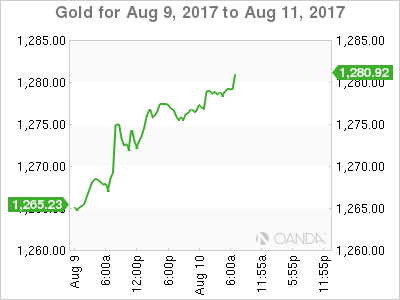
Capital Markets are on the defence as a risk-off tone dominates proceedings, with gold ($1,278.34) and the Japanese yen (¥109.810) advancing and sovereign bond prices edging higher as tension grows between the U.S and North Korea. The ‘mighty' dollar remains better bid against G10 currency pairs ahead of tomorrow's U.S inflation data (08:30 am EDT), while oil prices advance.
Expect Fed speak this morning to shape a portion of the U.S dollars direction. The Fed's William Dudley (dove, FOMC voter) delivers opening remarks at the Economic Press Briefing on Wage Inequality in the Region in New York City, followed by a question and answer session (10:00 am EDT).
1. Stocks Sea of red
Asian stocks largely finished well off their session lows, but still dropped again following yesterday's geopolitics-fuelled declines.
In Japan, Nikkei edged down -0.2% ahead of Friday's holiday as investors eye North Korea. The broader Topix shed -0.1%.
In Hong Kong, profit taking hit regional bourses. The Hang Seng index ended down -1.1%, while the China Enterprises Index lost -1.7%.
Down-under, Australia's S&P/ASX 200 Index lost -0.1%, while in China, shares followed regional peers lower, led by materials stocks. The blue-chip CSI300 index fell -0.4%, while the Shanghai Composite Index also lost -0.4%.
In Europe, regional indexes opened lower and continue to underperform as geo-political concerns still weigh on risk sentiment, Commodity prices are trading higher, but again fail to support materials stocks.
U.S equities are expected to open deep in the red (-0.4%).
Indices: Stoxx50 -0.7% at 3,444, FTSE -1.1% at 7,410, DAX -0.7% at 12.065, CAC-40 -0.5% at 5,119, IBEX-35 -0.7% at 10,525, FTSE MIB -0.4% at 21,764, SMI -0.3% at 9,003, S&P 500 Futures -0.4%
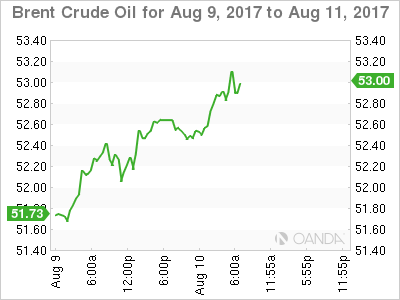
2. Oil rises as inventory overhang erodes, gold higher
Ahead of the U.S open, oil prices remain better bid, lifted by a sustained decline in inventories and as Saudi Arabia prepared to cut crude supplies to its Asian accounts.
Note: Crude is down -7% year-to-date, on concerns that OPEC may not be able to force global oil inventories to drop by cutting production.
The Saudi's this week indicated that they are prepared to cut supplies to most buyers in Asia by up to +10% next month.
Brent crude futures are up +29c at +$52.99 a barrel, while U.S West Texas Intermediate (WTI) crude is up +17c at +$49.73.
Yesterday's weekly EIA numbers saw U.S inventories (-6.5m vs. -1.5m barrels) at their lowest since October, having fallen for 10 of the last 12 weeks.
Gold prices (up +0.1% to +$1,278.51 per ounce) linger atop of its two-month high print overnight, as rising tensions on the Korean peninsula continue to support safe-haven demand.
Platinum prices fell -0.3% to +$968.20 per ounce. In yesterday's session, it marked its highest print since April at +$980.60.
3. Yields lower on risk aversion
Europe's bond yields trade atop of their six-week lows as North Korea outlined detailed plans for a missile strike near the U.S territory of Guam.
The yield on Germany's 10-year Bund is a tad higher ahead of the U.S open at +0.44%, just above its low of +0.42%print yesterday. U.S Treasuries (declined less than -1 bps to +2.24%) and U.K Gilts (+1.14%) are also trading a touch above Wednesday's six-week lows.
Note: In the U.K, issuance of new Gilts is scheduled to resume Aug. 23. Until then, lack of supply should make it difficult for gilt yields to rise and this should also help gilts out-perform U.S treasuries in the near term.
The medium-term outlook depends on the BoE – Governor Carney and company is expected to find it difficult to hike policy rate given the downside risks to growth.
4. Dollar in demand, a tad
The markets continue to look for direction after yesterday's sharp moves and geopolitical concerns will dominate investor thinking in the coming days.
Both the CHF and JPY managed to notch up impressive gains yesterday outright after President Trump warned North Korea that it would face 'fire and fury' if it threatened the U.S.
Ahead of the U.S open, safe haven currencies, like the CHF ($0.9658) and JPY (¥109.81), are consolidating this weeks recent gains inspired by a deepening anxiety over tensions between Washington and Pyongyang.
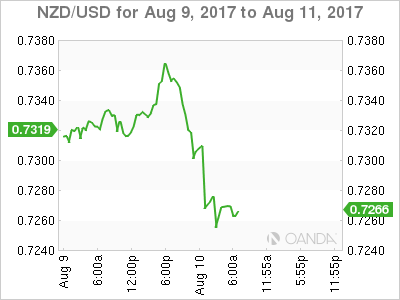
Elsewhere, the NZD (NZ$0.7268) is a good bit softer after Reserve Bank of New Zealand (RBNZ) Governor Wheeler indicated that the overnight cash rate (OCR) should stay steady for the foreseeable future. The futures market had been pricing in a Kiwi rate hike within 12-months, rather than a mid-2019 date indicated by the RBNZ overnight.
5. Reserve Bank of New Zealand (RBNZ) monetary policy
RBNZ Governor Wheeler delivered his last major policy statement yesterday before retiring next month, leaving interest rates unchanged (+1.75%) and keeping the guidance ‘neutral.'
Note: This will give the new governor maximum optionality should activity data disappoint, wages growth remain weak, and inflation continue to undershoot target.
In his press conference, Governor Wheeler did confirm that they monitor a 'traffic light system' for currency intervention closely, but would not comment on whether currency strength is affecting the system. He believes that intervention in FX remains open to policy makers.
DAX Losses Continue As Geopolitical Tensions Continue
The DAX index is down considerably in the Thursday session. Currently, the DAX is trading at 12,060.00, down 0.77% on the day. On the release front, it’s a second straight day without any German or Eurozone events. On Friday, both Germany and the US release CPI reports.
With a lack of European economic data this week, investors are focusing on political risk, which continues to rise over tensions between the US and North Korea. As the war of rhetoric between the two countries has escalated, investors have dumped shares in favor of safe-haven assets, such as gold. North Korea has vowed to retaliate over new sanctions imposed by Washington and has threatened to attack Guam, which is a major US military base. President Donald Trump is taking a tough line on North Korea, and has promised that any aggression from North Korea will be met with “fire and fury.” With Trump and North Korean President Kim Jong-un on a possible collision course, the stock market slide could continue.
Low inflation levels remain a major headache for ECB policymakers. Inflation in the eurozone stood at 1.3% year-on-year in July, well below the bank’s inflation target of 2%. Even Germany, whose economy is very strong, is grappling with weak inflation. The ECB’s ultra-accommodative policy, which includes interest rates of 0.00% and asset purchases (QE) of 60 billion euros/month, has failed to push inflation upwards. The QE program, which is scheduled to terminate in December, is coming under closer scrutiny. However, December should not be treated as a drop-dead date – the ECB has been careful to state that QE could be extended “if necessary”. The ECB holds its next policy meeting in September 7, and there is a strong possibility that the bank will make an announcement regarding tapering QE, which could start in early 2018. The dilemma facing policymakers is that despite a stronger labor market and improved growth, which would suggest that a tighter monetary might be appropriate, inflation levels remain stubbornly low, as the ECB’s inflation target of 2% has proven overly optimistic. The ECB is well aware that any talk of tighter policy could send the euro higher, as was the case in June, when investors snapped up euros after Mario Draghi made some hawkish comments at a meeting of central bankers. As far as interest rate moves, the ECB is unlikely to raise rates until its tapering process is well under way, meaning we’re unlikely to see any rate moves before the second half of 2018.
What does the Fed have planned in the second half of 2017? The markets are looking for some clarity from the Federal Reserve, which is showing signs of backtracking on another rate hike in 2017. Earlier this year, the Fed strongly hinted that it planned to raise rates three times in this year, but so far only pressed the rate trigger twice, in March and June. After the June hike, Fed Chair Janet Yellen shrugged off concerns over low inflation, saying that it was due to “transient” factors. However, inflation has not improved and the Fed has changed its tune. Last week, St. Louis Federal Reserve President James Bullard said he opposed further Fed hikes, warning that another hike would actually delay inflation from hitting the Fed’s target of 2%. The Fed appears uncertain about when to raise rates, and predictably, this hesitancy is making investors skeptical that the Fed will act. There is little chance that the Fed will make any moves at the September and November meetings, and the odds of a rate hike in December are currently at 42%. Analysts are hoping for some insight into the Fed’s thinking when the Fed Reserve Dallas President Robert Kaplan and Minneapolis President Neel Kashkari deliver speeches on Friday.
Euro Softens, Markets Eye German Inflation Reports
EUR/USD has posted slight losses on Thursday. Currently, the pair is trading at 1.1712, down 0.40% on the day. On the release front, there are no German or Eurozone events on the schedule. In the US, there are two key events – Producer Price Index and unemployment claims. Both indicators are expected to remain unchanged – PPI at 0.1% and unemployment claims at 240 thousand. On Friday, the US releases CPI, and we'll hear from two FOMC members – Robert Kaplan and Neel Kashkari.
The eurozone economy has improved in 2017, but stubbornly low inflation levels remain a major headache for ECB policymakers. Inflation stood at 1.3% year-on-year in July, well below the bank's inflation target of 2%. The ECB's ultra-accommodative policy, which includes interest rates of 0.00% and asset purchases (QE) of 60 billion euros/month, has failed to push inflation upwards. The QE program, which is scheduled to terminate in December, is coming under closer scrutiny. However, December should not be treated as a drop-dead date – the ECB has been careful to state that QE could be extended “if necessary”. The ECB holds its next policy meeting in September 7, and there is a strong possibility that the bank will make an announcement regarding tapering QE, which could start in early 2018. The dilemma facing policymakers is that despite a stronger labor market and improved growth, which would suggest that a tighter monetary might be appropriate, inflation levels remain stubbornly low, as the ECB's inflation target of 2% has proven overly optimistic. The ECB is well aware that any talk of tighter policy could send the euro higher, as was the case in June, when investors snapped up euros after Mario Draghi made some hawkish comments at a meeting of central bankers. As far as interest rate moves, the ECB is unlikely to raise rates until its tapering process is well under way, meaning we're unlikely to see any rate moves before the second half of 2018.
The markets are looking for some clarity from the Federal Reserve, which is showing signs of backtracking on another rate hike in 2017. Earlier this year, the Fed strongly hinted that it planned to raise rates three times in this year, but so far only pressed the rate trigger twice, in March and June. After the June hike, Fed Chair Janet Yellen shrugged off concerns over low inflation, saying that it was due to “transient” factors. However, inflation has not improved and the Fed has changed its tune. Last week, St. Louis Federal Reserve President James Bullard said he opposed further Fed hikes, warning that another hike would actually delay inflation from hitting the Fed's target of 2%. The Fed appears uncertain about when to raise rates, and predictably, this hesitancy is making investors skeptical that the Fed will act. There is little chance that the Fed will make any moves at the September and November meetings, and the odds of a rate hike in December are currently at 42%. Analysts are hoping for some insight into the Fed's thinking when the Fed Reserve Dallas President Robert Kaplan and Minneapolis President Neel Kashkari deliver speeches on Friday.
RBNZ Holds Monetary Policy Unchanged, Kiwi Sinks To A Four-Week Low
Early on Thursday, RBNZ policymakers gathered to decide on monetary policy. As it was widely expected, the RBNZ held cash rates unchanged maintaining rates at a record low of 1.75%. However, the bank’s preference over a lower exchange rate, expressed after the release of the statement, pushed the kiwi down to a four-week low, while electronic retail sales figures pressured the currency further.
Despite recent data showing a negative change in employment for the first time since November 2015, and a softer GDP growth and inflation, the bank decided to keep rates on hold while it also stated that monetary policy will remain accommodative for a “considerable period”. Particularly the RBNZ sees rates increasing to 1.8% in December 2018, to 1.9% in December 2019 and to 2.1% in September 2020. Following the statement, the RBNZ governor, Graeme Wheeler, said during his testimony that as headline inflation is expected to rise in the midpoint of the target range of 1-3% in the long-run there was no need to cut rates, while he added that in the coming quarters the bank expects inflation to slow down. Moreover, the statement pointed out concerns over an appreciating exchange rate, which has been rising significantly since the May meeting, on the back of a weaker dollar. The RBNZ governor explained that a lower currency is favorable as it would raise tradeable inflation and deliver a more balanced growth. Although he added, the bank has always the option to intervene in exchange markets and prevent rapid appreciation, even though it was reluctant to do so in the past.
Few minutes after the release of the statement, Statistics New Zealand published the figures on electronic card retail sales for the month of July. The numbers disappointed expectations, as retail sales plummeted by 0.5% month-on-month, missing the forecast of a growth of 0.3%. In the previous month, electronic card sales were down by 0.1% (downwardly revised from 0%). On a yearly basis, sales improved by 2% compared to 4% seen in June. This was the lowest increase since September 2012.
Looking at the forex markets, Wheeler’s comments on the exchange rate as well as worse than expected electronic retail sales weighed on the kiwi during the Asian session. The kiwi fell by 1% to a four-week low of $0.7250. Before the release of the statement, kiwi/dollar was trading at 0.7350.