Sample Category Title
How the Markets Could React to a North Korea Strike
It's difficult to interpret a rational response to an untested modern day warfare strategy using nuclear weapons. Nevertheless, below are a number of possible market scenarios under 'flash' and 'short-term' constraints.
A nuclear flashpoint is difficult to factor as its considered a non-traditional build up to conflict.
It's assumed that the U.S would be required to destroy North Korea's ability to retaliate in one massive short onslaught, not just its ballistic missile capability. Any strike of this scale would require a massive deployment of battleships and aviation assets to the region.
There are two main reason for that:
- Seoul, South Korea lies less than -100km from the border. It is within artillery strike.
- Japan is also within range of missiles and could expect a heavy bombardment.
In a war scenario we could expect the following:
Under Flash Conditions:
- USD/JPY could rally immediately above ¥130.00 (possibly ¥140+) and the Nikkei could drop by at least ~20%. By day's end, JPY may "not" be a safe haven. However, negating some of the 'big' dollar moves will be the fact that Japan is a net overseas investor, both on the retail and institutional levels. Thus, investors who have their assets in 'non-yen' is at risk because they are exposed to FX volatility - expect many domestic investors to want to reduce their risk by unwinding some of their overseas investments.
- USD/Asia - all Asian currencies could depreciate aggressively ~10%+
- ASIAN stock markets could collapse by at least ~10% and probably more in China and Hong Kong.
- KRW will most likely be untradeable due to liquidity constraints.
- With trade routes, east and west, expected to be severely disrupted, could be particularly bad for Australia. Expect the ASX to drop by ~10-20% as a high beta to China and its main export market. Expect the AUD to come under severe pressure and drop by at least ~10%.
- USD is expected to appreciate by at least ~5 to 10% against G10 pairs for starters.
- Global stock markets ex-Asia and APAC could drop by ~5 to 10%.
- Oil will be expected to rally aggressively, up to $70-90+ a barrel and then some
- CHF could appreciate by ~10% crushing the SNB along the way. It's already posted its biggest daily rise in 2 and a half years this week on 'carry' trade unwinds.
- Gold will move higher by a minimum of ~20% to $1500, and expected to go much higher. Similar moves will be seen in Silver and Platinum.
- Base metals could collapse as demand from China plummets, or because it is unsafe to transport raw materials.
- Food prices will suffer a knee jerk reaction higher as Asia scrambles for supplies to stockpile, but probably finds that no one will be willing to ship them.
Under Short-Term conditions:
- G7 Central Banks will be expected to produce massive cuts in interest rates to head of a liquidity crisis.
- U.S Treasury's, Bunds, Gilts yields will collapse - Bunds going strongly negative and U.S 10-year yields to plummet towards +1 - 1.5%.
- On collateral damage to either South Korea or Japan could see a reversal of some of the USD bets into EUR as a safe haven.
Are Further Gains in WTI Limited?
Oil prices drifted slightly higher on Wednesday, after the weekly US EIA crude inventory data showed a bigger-than-anticipated drawdown. The precious liquid traded in a relatively quiet manner so far this week, despite the OPEC & non-OPEC meeting in Abu Dhabi on Monday and Tuesday. Even though members that have been overproducing in recent months reaffirmed their commitment to comply with the production numbers agreed in May, these signals probably fell short of impressing investors, evident by oil being unable to assume a clear direction in the aftermath.
Moving forward, besides the weekly inventory data, there aren't that many items on the agenda that could drive oil prices in the next days. The next OPEC & non-OPEC compliance meeting is scheduled on the 21st of August. Until then, oil's forthcoming direction may be primarily decided by movements in the US dollar. Tomorrow's US CPI data could prove critical for the currency's forthcoming direction. A rebound in US inflation could support the greenback and thereby put a lid on any near-term oil rallies.
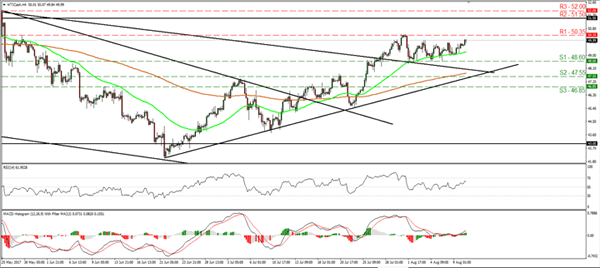
WTI traded higher during the European morning Thursday, but it still remains within a narrow range between the support of 48.60 (S1) and the resistance of 50.35 (R1). Having in mind that the price is trading above the short-term uptrend line taken from the low of the 21st of June, and also above the upper bound of the downside channel that contained the price action from the beginnings of February until the 7th of July, we consider the short-term outlook to be cautiously positive. We expect the bulls to challenge the 50.35 (R1) line soon, where a decisive break is possible to set the stage for extensions towards the next key obstacle of 51.50 (R2).
Shifting our attention to the short-term momentum indicators, we see that both of them support the case for oil prices to continue trading higher, at least for a while. The RSI is back above 50 and is now headed towards its 70 line, while the MACD has bottomed near zero, crossed above its trigger line, and is now pointing up.
As for the broader picture, even if the price continues higher in the short run, we remain sceptical with regards to the establishment of a long-term healthy uptrend. WTI is now getting closer to the lower end of the 51.50-55.00 range, where we believe US shale producers may be attracted to increase production.
Trade Idea Wrap-up: USD/JPY – Stand aside
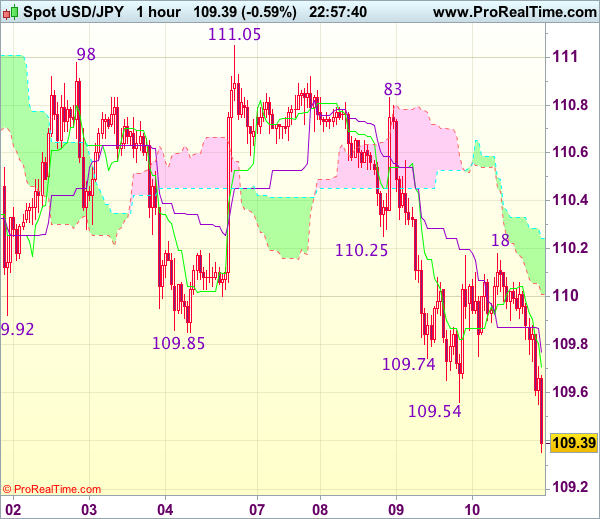
USD/JPY - 109.39
Most recent candlesticks pattern : N/A
Trend : Near term down
Tenkan-Sen level : 109.70
Kijun-Sen level : 109.76
Ichimoku cloud top : 110.24
Ichimoku cloud bottom : 110.01
New strategy :
Stand aside
Position : -
Target : -
Stop : -
The greenback met renewed selling interest at 110.18 and has dropped again, suggesting recent selloff is still in progress and bearishness remains for weakness to 109.20-25, then towards 109.00, however, near term oversold condition should prevent sharp fall below 108.70-75 today and reckon 108.50 would hold from here, bring rebound later.
In view of this, would not chase this fall here and would be prudent to stand aside in the meantime. Above the Kijun-Sen (now at 109.76) would defer and risk recovery to 110.00 but only break of said resistance at 110.18 would signal low is formed instead, bring further gain towards 110.45-50.
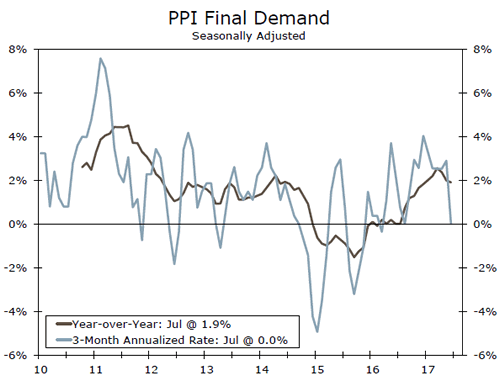
Soft Producer Price Inflation Extends in July
On broad-based weakness, the PPI for final demand unexpectedly fell 0.1 percent in July - extending the recent decline in the year-over-year rate. This only heightens anticipation for tomorrow's CPI update.
Alert: Chemical Spill
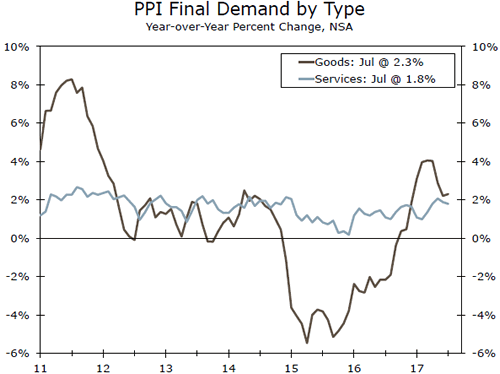
Marking the first monthly decline since August 2016, the PPI for final demand unexpectedly contracted in July. Price declines were broad-based with lower readings in energy and services, while wholesale food prices remained flat.
Services accounted for over 80 percent of the headline's decline, with about 60 percent attributable to a 5.8 percent drop in margins for chemicals and allied products wholesaling.
Outlook Remains Tame
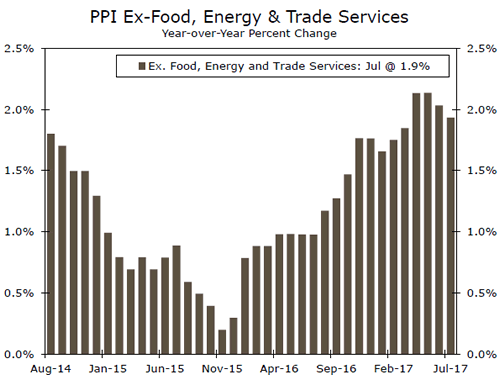
Our favorite measure of core producer prices, ex-energy, food and trade services, was flat on the month, taking the year-overyear rate down modestly to 1.9 percent. It is important to remember the PPI data can be volatile on a monthly basis. That said, today's miss heightens the focus on the July CPI report. From our view, the health of economic fundamentals continues to point to a firming inflation environment in H2.
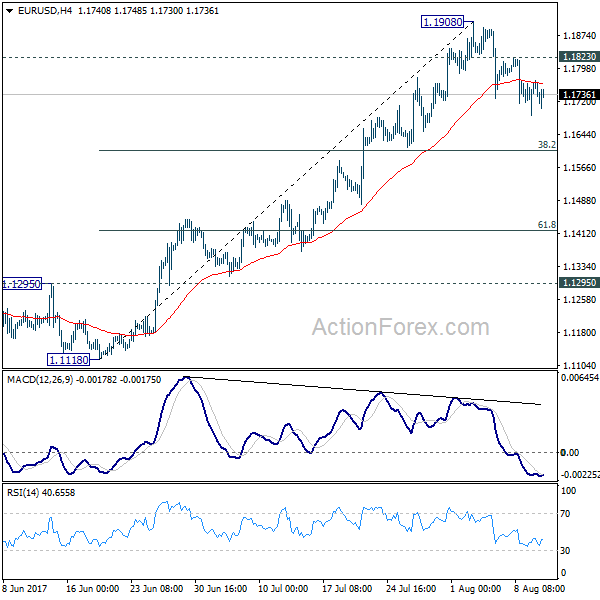
EUR/USD Mid-Day Outlook
Daily Pivots: (S1) 1.1710; (P) 1.1736 (R1) 1.1784; More...
Intraday bias in EUR/USD remains on the downside as the pull back from 1.1908 is still in progress. At this point, we'd expect strong support from 38.2% retracement of 1.1119 to 1.1908 at 1.1606 to bring rebound. But break of 1.1908 is needed to confirm up trend resumption. Otherwise, more consolidation would be seen in near term. Meanwhile, sustained break of 1.1606 would bring deeper pull back to 61.8% retracement at 1.1420.
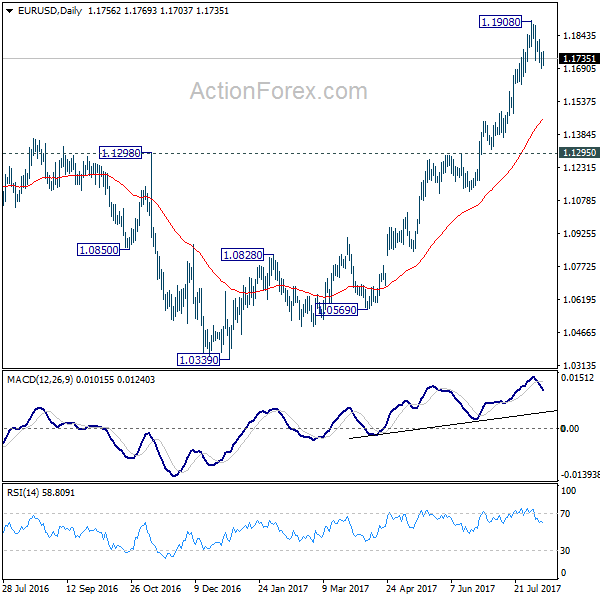
In the bigger picture, an important bottom was formed at 1.0339 on bullish convergence condition in weekly MACD. Sustained break of 55 month EMA (now at 1.1760) will pave the way to key fibonacci level at 38.2% retracement of 1.6039 (2008 high) to 1.0339 (2017 low) at 1.2516. While rise from 1.0339 is strong, there is no confirmation that it's developing into a long term up trend yet. Hence, we'll be cautious on strong resistance from 1.2516 to limit upside. But for now, medium term outlook will remain bullish as long as 1.1295 support holds, in case of pull back.
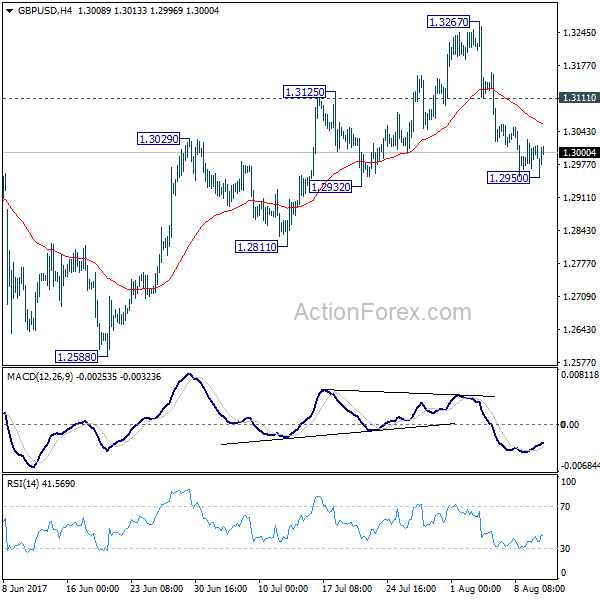
GBP/USD Mid-Day Outlook
Daily Pivots: (S1) 1.2970; (P) 1.2998; (R1) 1.3030; More...
A temporary low is in place at 1.2950 with 4 hour MACD crossed above signal line and intraday bias is turned neutral first. Deeper decline will be expected as long as 1.3111 resistance holds. As noted before, price actions from 1.1946 are seen as a corrective pattern and could have completed at 1.3267. Break of 1.2932 will affirm this bearish case and target 1.2588 key near term support for confirmation. However, break of 1.3111 resistance will turn bias back to the upside for retesting 1.3267 high.
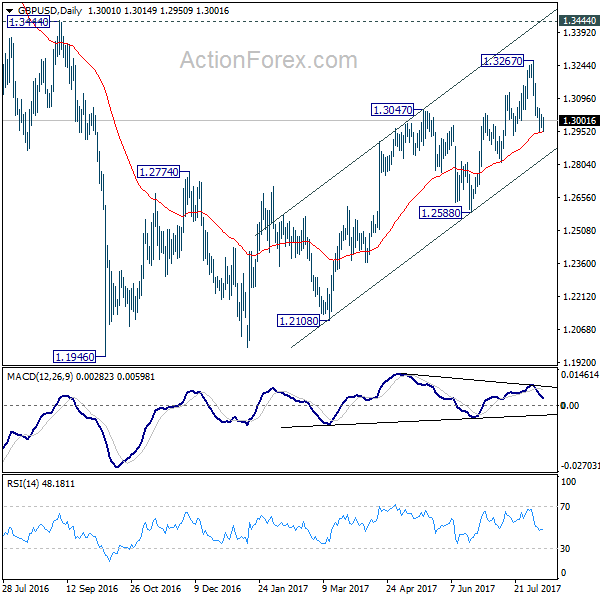
In the bigger picture, overall, price actions from 1.1946 medium term low are seen as a corrective pattern that is still in progress. While further upside is expected, larger outlook remains bearish as long as 1.3444 key resistance holds. Down trend from 1.7190 (2014 high) is expected to resume later after the correction completes. And break of 1.2588 will indicate that such down trend is resuming.
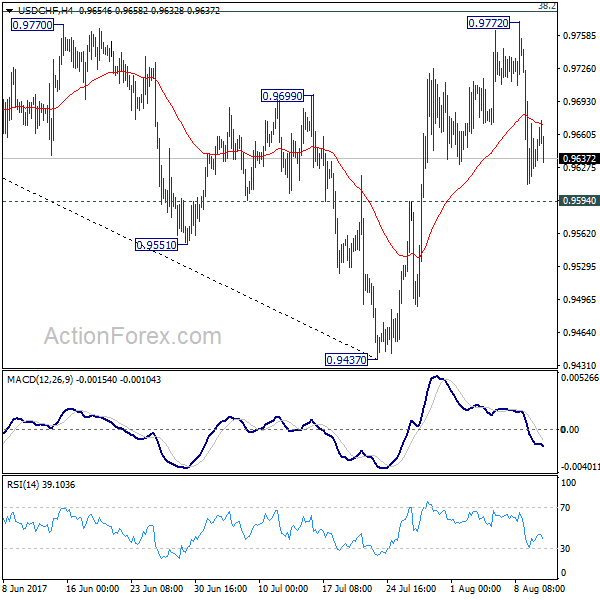
USD/CHF Mid-Day Outlook
Daily Pivots: (S1) 0.9583; (P) 0.9663; (R1) 0.9716; More...
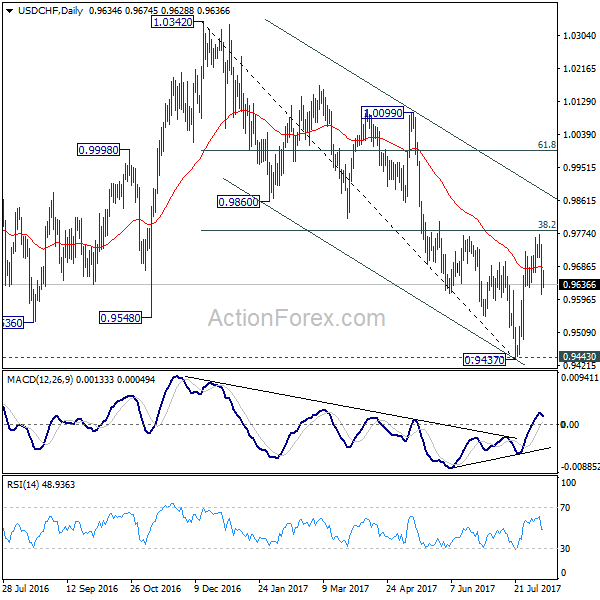
USD/CHF is staying in range of 0.9594/9772 and intraday bias remains neutral for the moment. Outlook is a bit mixed as the pair is bounded inside medium term falling channel. The pair was also limited below 38.2% retracement of 1.0342 to 0.9437 at 0.9783. Firm break of 0.9594 will dampen our bullish view and turn bias back to the downside for 0.9437. This could also extend the fall through 1.0342 through 0.9437/43 key support level. On the upside, above 0.9772 will revive the bullish case of reversal and turn bias back to the upside.
In the bigger picture, current development argues that USD/CHF has successfully defended 0.9443 key support level. And long term range trading in 0.9443/1.0342 is extending with another rise. At this point, there is no sign of an up trend yet. Hence, while further rise is expected in USD/CHF, we'll start to be cautious on loss of momentum above 61.8% retracement of 1.0342 to 0.9437 at 0.9996.
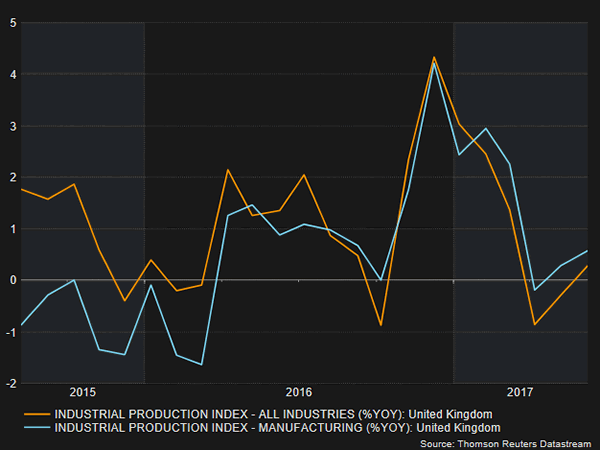
Sterling Gains as British Iindustrial Production Rises, but Trade Balance Disappoints
While the BOE is hoping for exports and investments to rebalance the slowdown in consumption, as MPC member Michael Sanders expressed a month ago, data released on Thursday showed the goods trade deficit widening and reaching the highest level since September. On the other hand, industrial output showed improvement, but the improvement was seen as temporary. As a response, sterling picked up from a three-week low it touched prior the data.
According to the Office for National Statistics, British industrial output expanded unexpectedly in June as oil companies postponed seasonal maintenance. Industrial production recovered from a 0.1% contraction in May, expanding by 0.5% month-on-month and exceeding the forecast of 0.1% growth. Year-on-year the change was positive at 0.3%, while analysts expected the figure to rise from a negative 0.2% to a negative 0.1%. However, the improvement in the data was mainly due to a postponing in oilfield maintenance which is likely to take place later in the year.
Looking at the industrial sectors, the output in the manufacturing sector showed no growth in June as expected, following a decline of 0.1% in May (upwardly revised from 0.2%). A reason for this was attributed to a sharp fall in car production which amounted to 3.6% (steepest fall since December 2013) versus a drop of 2.3% in May. On a yearly basis manufacturing output growth doubled in June, in line with forecasts, from 0.3% to 0.6%.
Construction activities, which represent 6% of the economy, also contracted during the month, falling surprisingly by 0.1% compared to a 0.4% downturn in the previous month. Analysts anticipated instead a 1.5% improvement in construction output. The yearly equivalent increased from 0.5% to 0.9%, missing the forecast of 1.9%.
In the other important report of the day, trade data came in worse than expected. Goods trade deficit widened from £11.31 billion to £12.72 billion, whilst analysts expected the trade deficit to narrow to £11 billion. This was the biggest trade deficit since September. Regarding Non-EU trade balance, the deficit rose by almost £1 billion to £4.47 billion, above the £3 billion expected.
Including exports in services, the trade deficit rose to £4.6 billion, the highest record since September. This brought doubts on whether British exporters have really benefitted since the Brexit vote from the depreciated pound (18%).
In the forex markets, sterling reacted positively after the release of the data with sterling/dollar finding support from better- than- expected industrial output growth. Sterling/dollar jumped by 0.30% slightly above the 1.30 handle before it slipped back to 1.2992. Before the data, the pound was hovering around a three-week low of 1.2950 reached today.
Canadian Dollar Yawns as US Inflation Data Disappoints
The Canadian dollar is unchanged in Thursday trade. In the North American session, USD/CAD is trading at the 1.2701, up 0.03% on the day. On the release front, Canadian NHPI posted a gain of 0.2%, short of the forecast of 0.5%. In the US, inflation releases missed expectations, as PPI and Core PPI both posted declines of 0.1%. Unemployment claims rose to 244 thousand, higher than the estimate of 240 thousand.
Global markets remain uneasy, as tensions continue to ratchet higher between North Korea and the US. With the war of words escalating between the two countries, global markets are down, as investors have dumped shares in favor of safe-haven assets, such as gold. North Korea has vowed to retaliate over new sanctions imposed by Washington and has threatened to attack Guam, which is a major US military base. President Trump and North Korean President Kim Jong-un are on a possible collision course, which has caused alarm in South Korea and Japan, strong allies of the US.
In contrast to the uncertainty over the Fed's monetary plans, the Bank of Canada is leaning towards further tightening, possibly before the end of 2017. The bank raised interest rates in July and the odds of a rate increase in October are at 78 percent. In May, annualized GDP was up 4.6%, and the labor market continues to produce jobs. The increase in oil prices has revived the economy has also pushed the Canadian dollar higher. At the same time, similar to the situation in the US, inflation remains subdued, despite a stronger economy and an improving labor market. The lack of inflation could cause the Federal Reserve to abandon plans for another rate hike this year, and this could also lead to the BoC deciding to delay a rate hike until inflation moves higher.
The markets are looking for some clarity from the Federal Reserve, which is showing signs of backtracking on another rate hike in 2017. Earlier this year, the Fed strongly hinted that it planned to raise rates three times in this year, but so far only pressed the rate trigger twice, in March and June. After the June hike, Fed Chair Janet Yellen shrugged off concerns over low inflation, saying that it was due to "transient" factors. However, inflation has not improved and the Fed has changed its tune. Last week, St. Louis Federal Reserve President James Bullard said he opposed further Fed hikes, warning that another hike would actually delay inflation from hitting the Fed's target of 2%. The Fed appears uncertain about when to raise rates, and predictably, this hesitancy is making investors skeptical that the Fed will act. There is little chance that the Fed will make any moves at the September and November meetings, and the odds of a rate hike in December are currently at 42%. Analysts are hoping for some insight into the Fed's thinking when the Fed Reserve Dallas President Robert Kaplan and Minneapolis President Neel Kashkari deliver speeches on Friday.
Sterling Mixed as UK Data Conflicts
Market players are unsure whether to throw Sterling a lifeline, or to punish the currency further on Thursday, following the mixed bag of different economic releases from the United Kingdom.
Total industrial production exceeded expectations by rising 0.5% in June but manufacturing remained flat. The trade deficit unexpectedly widened, which weighed on sentiment.
With the UK economy ending the second quarter on a soft note, and with disappointing manufacturing data, speculation around the Bank of England raising UK interest rates this year is likely to weaken even further. Although it has been over one year since Britain voted to leave the European Union, it's remarkable how the deteriorating economic fundamentals are now starting to shine through, and continue to suggest that the nation is struggling to shake off the Brexit blues.
The British Pound is still struggling to nurse its wounds, following the sharp sell-off in Sterling last week, after the Bank of England (BoE) doves crashed the party, in August's monetary policy meeting. The economic data from the UK is not complimenting prior hints from the BoE, that UK interest rates could be raised, which is seen as a threat that may limit buying sentiment.
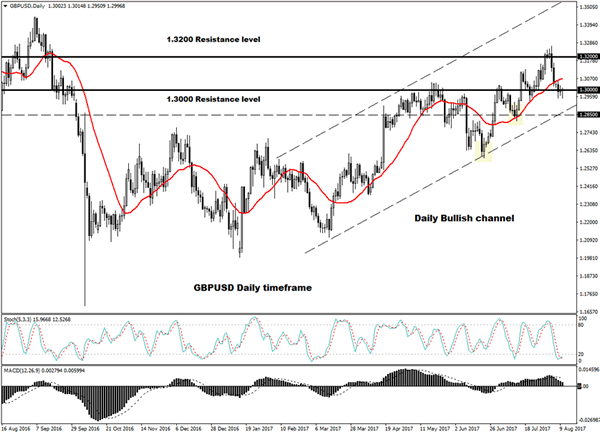
Sterling bears still seem to be in control of the Pound, following the inspiration they received after the downgrade in economic forecasts from the BoE. This coupled with the weakening optimism of a UK interest rate rise seems to indicate that the Pound could still drop lower. From a technical standpoint, the GBPUSD remains under pressure on the daily charts. A weekly close below 1.3000 should encourage a further depreciation towards 1.2850.