
Sample Category Title
USD/JPY Mid-Day Outlook
Daily Pivots: (S1) 109.62; (P) 109.98; (R1) 110.42; More...
Intraday bias in USD/JPY remains on the downside as the decline from 114.49 is still in progress. Further fall should be seen to 108.81 support. Break there will resume whole correction from 118.65 and target 61.8% retracement of 98.97 to 118.65 at 106.48. On the upside, break of 111.04 resistance is needed to indicate short term bottoming. Otherwise, outlook will stay bearish in case of recovery.
In the bigger picture, the corrective structure of the fall from 118.65 suggests that rise from 98.97 is not completed yet. Break of 118.65 will target a test on 125.85 high. At this point, it's uncertain whether rise from 98.97 is resuming the long term up trend from 75.56, or it's a leg in the consolidation from 125.85. Hence, we'll be cautious on topping as it approaches 125.85. If fall from 118.65 extends lower, down side should be contained by 61.8% retracement of 98.97 to 118.65 at 106.48 and bring rebound.


Dollar Mildly Lower after PPI Miss, Gold Heading to 1300, WTI Oil Breaches 50
There is no change in the general risk-aversion mode in the financial markets today. Investors continue to watch the development of US-North Korea tension with much caution. Yen remains the strongest one but Aussie and Canadian Dollar are catching up. Gold extends recent rally and breaches 1290, setting to take on 1300 handle. WTI crude oil was lifted by news that OPEC raised demand forecast and breaches 50 handle finally. Dollar trades lower in early US session, in particular against Japanese Yen after disappointing PPI. New Zealand Dollar remains the weakest one after dovish RBNZ comments.
US PPI missed expectations, jobless claims steady
US headline PPI dropped -0.1% mom in July, missing expectation of 0.1% mom. PPI annual rate slowed to 1.9% yoy, down from 2.0% yoy, missing expectation of 2.2% yoy. Core PPI dropped -0.1% mom, below expectation of 0.2%. Core PPI annual rate slowed to 1.8% yoy, down from 1.9% yoy and missed expectation of 2.1% yoy. While Fed is generally expected to start unwinding the balance sheet in September, question remains on whether it will hike again in December. Slowdown in inflation will more likely keep Fed on hold throughout the year.
Initial jobless claims rose 3k to 244k in the week ended August 5, slightly above expectation of 240k. Initial claims have now stayed at or below 250k level for 10 straight weeks already. Continuing claims dropped 16k to 1.95m in the week ended July 29. From Canada, new housing price index rose 0.2% mom in June.
Oil breaches 50 as OPEC raised demand forecasts
WTI crude oil is gathering some upside momentum and breaches 50 handle today. OPEC raised forecast of demand by 100k barrels a day for both 2017 and 2018. That is, demand will reach 1.37m barrels a day this year. OPEC also lowered estimated supply of non-OPEC countries by 50k barrels a day in 2017 and 90k barrels a day in 2018. That offset the impact of rise in production in July due to Libya, Nigeria and Saudi Arabia.
Reuters poll: Half of economists expect ECB tapering in September
According to a Reuters poll, 25 of 50 economists surveyed expected ECB to make an announcement in September on tapering the EUR 60b asset purchase program. 15 expected the announcement to happen in October. Most of the others expected it to start in early 2018. Economists consensus for growth in Eurozone is 2% this year. They expect inflation to hit 1.5% this year, and 1.4% in 2018, both well below target of 2%. 43 respondents answered an extra question and believed that rising Euro will not threaten Eurozone's recovery.
Sterling steady after mixed data
Sterling is staying in tight range against Euro after mixed economic data. Industrial production rose 0.5% mom, 0.3% yoy in June, above expectation of 0.1% mom, -0.1% yoy. Manufacturing rose 0.0% mom, 0.6% yoy, versus consensus of 0.0% mom, 0.7% yoy. Construction output dropped -0.1% mom in June. Trade deficit widened to GBP -12.7b in June. NIESR GDP estimate rose 0.2% in July. RICS house price balance dropped to 1 in July.
RBNZ left OCR unchanged at 1.75% as widely expected
As expected, the RBNZ left the OCR unchanged at 1.75%. Governor Wheeler reiterated that the monetary policy would remain accommodative for some time. The staff projection continued to forecast the first rate hike to come in 2H19. They also revised lower the short term inflation outlook and intensified the warning that a lower currency is needed for growth. NZD/USD jumped to a 3-day high of 0.7371 after the announcement, but gains were erased afterwards. At the time of writing NZD/USD has already resumed recent fall from 0.7553 and reaches as low as 0.7298. More in RBNZ Left Policy Stance Unchanged, Heightened Warning Over NZD Strength.
USD/JPY Mid-Day Outlook
Daily Pivots: (S1) 109.62; (P) 109.98; (R1) 110.42; More...
Intraday bias in USD/JPY remains on the downside as the decline from 114.49 is still in progress. Further fall should be seen to 108.81 support. Break there will resume whole correction from 118.65 and target 61.8% retracement of 98.97 to 118.65 at 106.48. On the upside, break of 111.04 resistance is needed to indicate short term bottoming. Otherwise, outlook will stay bearish in case of recovery.
In the bigger picture, the corrective structure of the fall from 118.65 suggests that rise from 98.97 is not completed yet. Break of 118.65 will target a test on 125.85 high. At this point, it's uncertain whether rise from 98.97 is resuming the long term up trend from 75.56, or it's a leg in the consolidation from 125.85. Hence, we'll be cautious on topping as it approaches 125.85. If fall from 118.65 extends lower, down side should be contained by 61.8% retracement of 98.97 to 118.65 at 106.48 and bring rebound.
Economic Indicators Update
| GMT | Ccy | Events | Actual | Forecast | Previous | Revised |
|---|---|---|---|---|---|---|
| 21:00 | NZD | RBNZ Rate Decision | 1.75% | 1.75% | 1.75% | |
| 23:01 | GBP | RICS House Price Balance Jul | 1% | 9% | 7% | |
| 23:50 | JPY | Machine Orders M/M Jun | -1.90% | 3.70% | -3.60% | |
| 23:50 | JPY | Domestic CGPI Y/Y Jul | 2.60% | 2.30% | 2.10% | 2.20% |
| 01:00 | AUD | Consumer Inflation Expectation Aug | 4.20% | 4.40% | ||
| 04:30 | JPY | Tertiary Industry Index M/M Jun | 0.00% | 0.20% | -0.10% | |
| 08:30 | GBP | Industrial Production M/M Jun | 0.50% | 0.10% | -0.10% | |
| 08:30 | GBP | Industrial Production Y/Y Jun | 0.30% | -0.10% | -0.20% | |
| 08:30 | GBP | Manufacturing Production M/M Jun | 0.00% | 0.00% | -0.20% | -0.10% |
| 08:30 | GBP | Manufacturing Production Y/Y Jun | 0.60% | 0.70% | 0.40% | 0.30% |
| 08:30 | GBP | Construction Output M/M Jun | -0.10% | 1.20% | -1.20% | -0.40% |
| 08:30 | GBP | Visible Trade Balance (GBP) Jun | -12.7B | -11.0B | -11.9B | -11.3B |
| 12:00 | GBP | NIESR GDP Estimate Jul | 0.20% | 0.30% | 0.30% | |
| 12:30 | CAD | New Housing Price Index M/M Jun | 0.20% | 0.50% | 0.70% | |
| 12:30 | USD | Initial Jobless Claims (AUG 05) | 244K | 240K | 240K | 241K |
| 12:30 | USD | PPI M/M Jul | -0.10% | 0.10% | 0.10% | |
| 12:30 | USD | PPI Y/Y Jul | 1.90% | 2.20% | 2.00% | |
| 12:30 | USD | PPI Core M/M Jul | -0.10% | 0.20% | 0.10% | |
| 12:30 | USD | PPI Core Y/Y Jul | 1.80% | 2.10% | 1.90% | |
| 14:30 | USD | Natural Gas Storage | 38B | 20B | ||
| 18:00 | USD | Monthly Budget Statement Jul | -55.5B | -90.2B |
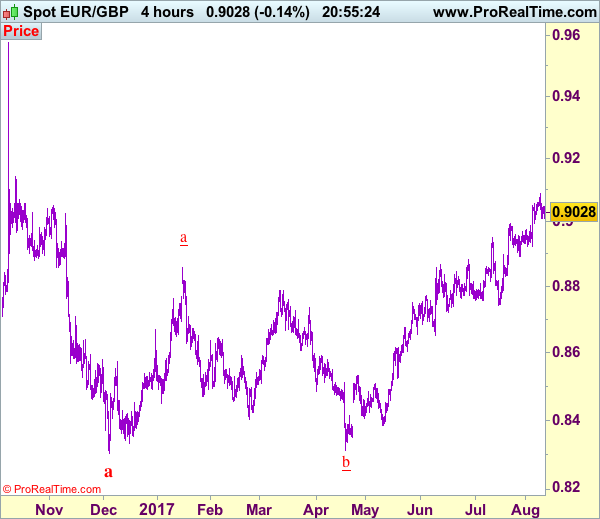
Trade Idea: EUR/GBP – Hold short entered at 0.9080
EUR/GBP - 0.9025
Recent wave: Major double three (A)-(B)-(C)-(X)-(A)-(B)-(C) is unfolding and 2nd (A) has possibly ended at 0.6936.
Trend: Near term up
Original strategy :
Sold at 0.9080, Target: 0.8980, Stop: 0.9080
Position : - Short at 0.9080
Target : - 0.8980
Stop : - 0.9080
New strategy :
Hold short entered at 0.9080, Target: 0.8980, Stop: 0.9080
Position : - Short at 0.9080
Target : - 0.8980
Stop : - 0.9080
Euro’s retreat after this week’s brief rise to 0.9088 has retained our view that consolidation below this level would be seen and mild downside bias remains for test of indicated support at 0.8995, break there would suggest top is possibly formed there, then weakness to 0.8965-70 would follow but below 0.8945-50 is needed to add credence to this view, bring retracement of recent upmove towards support at 0.8922.
In view of this, we are holding on to our short position entered at 0.9080. Above said resistance at 0.9088 would risk gain to 0.9145-50, however, still reckon sharp move beyond there should not be repeated and upside should be limited to 0.9175-80, price should falter below 0.9100, bring correction later.
Our preferred count is that, after forming a major top at 0.9805 (wave V), (A)-(B)-(C) correction is unfolding with (A) leg ended at 0.8400 (A: 0.8637, B: 0.9491 and 5-waver C ended at 0.8400. Wave (B) has ended at 0.9413 and impulsive wave (C) has either ended at 0.8067 or may extend one more fall to 0.8000 before prospect of another rally. Current breach of indicated resistance at 0.9043 confirms our view that the (C) leg has ended and bring stronger rebound towards 0.9150/54, then towards 0.9240/50.
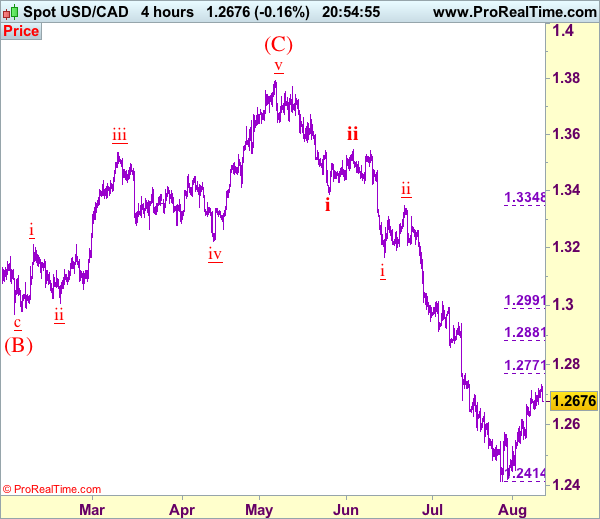
Trade Idea: USD/CAD – Sell at 1.2770
USD/CAD - 1.2680
Recent wave: Only wave v of c has ended at 0.9407 and wave C of major A-B-C correction is underway with wave iii ended at 1.4690, wave v of C may bring one more marginal rise probably in 2018
Trend: Down
Original strategy :
Sell at 1.2770, Target: 1.2570, Stop: 1.2830
Position: -
Target: -
Stop: -
New strategy :
Sell at 1.2770, Target: 1.2570, Stop: 1.2830
Position: -
Target: -
Stop:-
Although the greenback has retreated from 1.2735, as long as 1.2625-30 holds, risk of one more corrective rise rise cannot be ruled out, above said resistance would extend the rebound from 1.2414 (wave iii trough) for retracement of early decline in wave iv to 1.2771 (previous resistance as well as 38.2% Fibonacci retracement of wave iii) where renewed selling interest should emerge and bring retreat later, below 1.2625-30 would bring test of 1.2540-50, break there would suggest the rebound from 1.2414 has ended instead, bring further fall to 1.2490-00 but reckon support at 1.2451 would hold on first testing. We are keeping our count that wave v as well as wave (C) ended at 1.3794 and impulsive wave (i ii, i ii) is now unfolding with minor wave iii possibly ended at 1.2414, hence wave iv correction is underway.
In view of this, would be prudent to stand aside for now and look to sell on further subsequent rebound as 1.2771 resistance should limit upside. Above 1.2800-10 would defer and risk a stronger correction to 1.2850, however, still reckon upside would be limited to 1.2880-85 (50% Fibonacci retracement of wave iii) and bring retreat later next week.
To recap, wave B from 1.3066 is unfolding as an a-b-c and is sub-divided as a: 1.2192, b: 1.2716 and wave c is a 5-waver with i: 1.1983, ii: 1.2506, extended wave iii with minor iii at 1.0206, wave iv ended at 1.0781 and wave v as well as wave iii has ended at 0.9931, hence the subsequent choppy trading is the wave iv which is unfolding as (a)-(b)-(c) with (a) leg of iv ended at 1.0854, followed by (b) leg at 1.0108 and (c) leg as well as the wave iv ended at 1.0674. The wave v is sub-divided by minor wave (i): 0.9980, (ii): 1.0374, (iii): 0.9446, (iv): 0.9913 and (v) as well as v has possibly ended at 0.9407, therefore, consolidation with upside bias is seen for major correction, indicated target at 1.3700 and 1.4000 had been met and further gain to 1.4700 would be seen later.
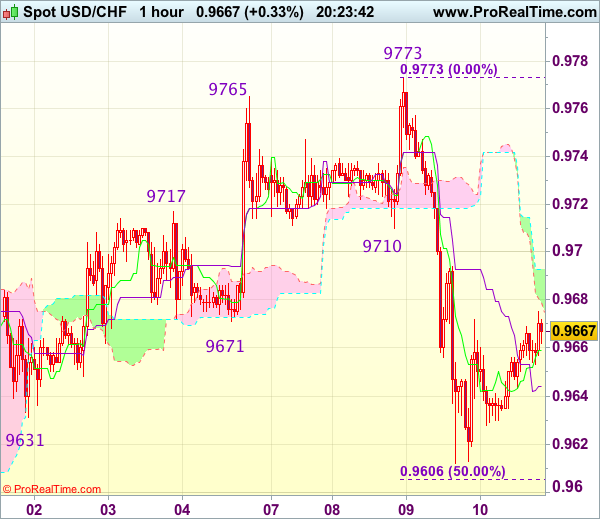
Trade Idea Update: USD/CHF – Sell at 0.9725
USD/CHF - 0.9666
Original strategy :
Sell at 0.9725, Target: 0.9625, Stop: 0.9760
Position : -
Target : -
Stop : -
New strategy :
Sell at 0.9725, Target: 0.9625, Stop: 0.9760
Position : -
Target : -
Stop : -
As the greenback recovered after yesterday’s selloff to 0.9612, suggesting consolidation above this level would be seen and gain to 0.9700 cannot be ruled out, however, as top has been formed at 0.9773, reckon upside would be limited to 0.9720-25 and bring another decline, below said support at 0.9612 would add credence to this view and extend the fall from 0.9773 top for retracement of recent upmove to 0.9605-10 (50% Fibonacci retracement of 0.9438-0.9773), then 0.9580 but reckon 0.9665 (61.8% Fibonacci retracement) would hold from here.
In view of this, we are looking to sell dollar on subsequent recovery as 0.9725-30 should limit upside. Only a break of this week’s high at 0.9773 would abort and revive bullishness for the rise from 0.9438 to extend gain to 0.9800-10.
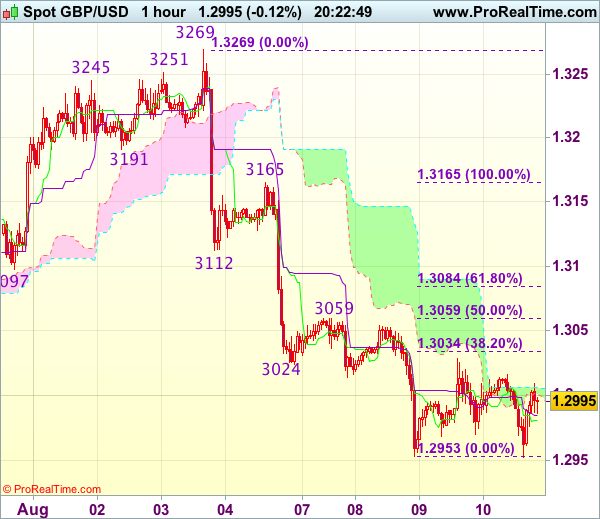
Trade Idea Update: GBP/USD – Stand aside
GBP/USD - 1.2995
Most recent candlesticks pattern : N/A
Trend : Near term down
Tenkan-Sen level : 1.2993
Kijun-Sen level : 1.2999
Ichimoku cloud top : 1.3006
Ichimoku cloud bottom : 1.2992
Original strategy :
Bought at 1.3000, stopped at 1.2965
Position : - Long at 1.3000
Target : -
Stop : - 1.2965
New strategy :
Stand aside
Position : -
Target : -
Stop : -
Although cable fell marginally to 1.2952, lack of follow through selling and current rebound suggest further consolidation would take place and another bounce to 1.3025-30 cannot be ruled out, however, reckon upside would be limited to resistance at 1.3059 and price should falter below 1.3085-90 and bring another decline later.
On the downside, below support at 1.2952-53 would signal recent fall from 1.3269 top has resumed and extend weakness to previous chart support at 1.2933 but reckon 1.2900 would hold from here, risk from there has increased for a rebound to take place later.
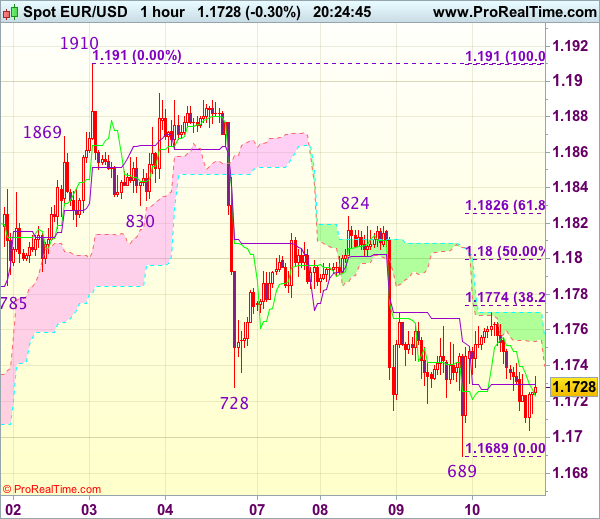
Trade Idea Update: EUR/USD – Hold short entered at 1.1770
EUR/USD - 1.1735
Original strategy :
Sold at 1.1770, Target: 1.1670, Stop: 1.1770
Position : - Short at 1.1770
Target : - 1.1670
Stop : - 1.1770
New strategy :
Hold short entered at 1.1770, Target: 1.1670, Stop: 1.1770
Position : - Short at 1.1770
Target : - 1.1670
Stop : - 1.1770
As the single currency found support at 1.1689 yesterday and rebounded, suggesting consolidation above this level would be seen, however, as long as resistance at 1.1770 holds, bearishness remains for the fall from 1.1910 top to bring retracement of early upmove, hence further weakness to 1.0670 would be seen but reckon support at 1.1650 would remain intact due to oversold condition.
In view of this, we are holding on to our short position entered at 1.1770. Above 1.1800-05 would risk another test of 1.1824-30 resistance but only break there would signal the erratic fall from 1.1910 has ended, bring further gain to 1.1855-60 first.
Trade Idea Update: USD/JPY – Stand aside
USD/JPY - 109.77
New strategy :
Stand aside
Position : -
Target : -
Stop : -
Despite falling to 109.54 yesterday, the subsequent rebound suggests consolidation above this level would be seen and test of previous support at 110.25 cannot be ruled out, however, break there is needed to signal low has been formed there, bring a stronger rebound to 110.55-60 but reckon upside would be limited to resistance t 110.83 and price should falter below 111.05 (last week’s high).
On the downside, below said support at 109.54 would signal recent decline has resumed and extend weakness to 109.20-25, having said that, loss of near term downward momentum should prevent sharp fall below there and price should stay above 109.00. As near term outlook is mixed, would be prudent to stand aside for now.

The Armageddon Trade
The geopolitical fear trade lifted off Wednesday in a classic flight to CHF, JPY and gold on North Korea worries. The Swiss franc led the way, while the Australian dollar lagged. Early in Asia-Pacific trade, the RBNZ held rates while the kiwi fell sharply when the assistant governor McDermott accentuated the change in the language that the currency "needed to" weaken. US PPI and Fed's Dudley are due next. All 3 Premium index shorts are in the green.
Markets are an unparalleled price discovery mechanism, except in once case. Add a bit of fear into the equation – especially fear of life and death – and markets overreact. Recent examples are the trouble in Ukraine and the ebola episode.
War is naturally frightening and uncertain. Now that North Korea has nuclear weapons (or close to it) it will remain a part of the trading landscape. Expect that to provide several opportunities to fade the "fear trade". The first came on Wednesday as stocks and USD/JPY fell only to later recover most of the dip. Bids in bond and gold mostly remain but once the rhetoric cools, so will the trade.
Fading armageddon rests on two critical assumptions: 1) That the US will obliterate North Korea if it uses nuclear weapons. 2) That Kim Jong-Un values his life.
The only conclusion is an extended stalemate, which is really just a continuation of the status quo since the end of the Korean War. The media thrives on inspiring fear but the best trade is almost always on the other side so expect that to remain the case for North Korea.
A more traditional trade is ongoing in the New Zealand dollar after rates were left unchanged at 1.75% and Wheeler said they would remain there for the foreseeable future. But 8 hours later, NZD/USD later fell by anotehr half a cent when McDermott stepped in.
CAC Under Pressure on North Korea Anxieties
The CAC index has posted losses for a second straight day. In the Thursday session, the index is at 5,126.30, down 0.35% on the day. On the release front, French Industrial Production suffered a sharp decline of 1.1%, worse than the estimate of -0.6%. On Friday, France releases Final CPI and Preliminary Nonfarm Payrolls.
With a quiet week for European indicators, investors have shifted their attention to Southeast Asia, where tensions continue to ratchet higher between North Korea and the US. With the war of words escalating between the two countries, global markets are down, as investors have dumped shares in favor of safe-haven assets, such as gold. North Korea has vowed to retaliate over new sanctions imposed by Washington and has threatened to attack Guam, which is a major US military base. President Trump and North Korean President Kim Jong-un are on a possible collision course, which has caused alarm in South Korea and Japan, strong allies of the US.
Low inflation levels remain a major headache for ECB policymakers. Inflation in the eurozone stood at 1.3% year-on-year in July, well below the bank's inflation target of 2%. Even Germany, whose economy is very strong, is grappling with weak inflation. The ECB's ultra-accommodative policy, which includes interest rates of 0.00% and asset purchases (QE) of 60 billion euros/month, has failed to push inflation upwards. The QE program, which is scheduled to terminate in December, is coming under closer scrutiny. However, December should not be treated as a drop-dead date – the ECB has been careful to state that QE could be extended "if necessary". The ECB holds its next policy meeting in September 7, and there is a strong possibility that the bank will make an announcement regarding tapering QE, which could start in early 2018. The dilemma facing policymakers is that despite a stronger labor market and improved growth, which would suggest that a tighter monetary might be appropriate, inflation levels remain stubbornly low, as the ECB's inflation target of 2% has proven overly optimistic. The ECB is well aware that any talk of tighter policy could send the euro higher, as was the case in June, when investors snapped up euros after Mario Draghi made some hawkish comments at a meeting of central bankers. As far as interest rate moves, the ECB is unlikely to raise rates until its tapering process is well under way, meaning we're unlikely to see any rate moves before the second half of 2018.