Sample Category Title
AUD/USD Growing Selling Pressures
AUD/USD's short-term technical structure is bearish. Hourly resistance is given at 0.8066 (27/07/2017 high) while hourly support can be found at 0.7875 (21/07/2017 low). Expected to continued decline.
In the long-term, we are waiting for further signs that the current downtrend is ending. Key supports stand at 0.6009 (31/10/2008 low) . A break of the key resistance at 0.8295 (15/01/2015 high) is needed to invalidate our long-term bearish view.
USD/CAD Short-Term Bullish Momentum Continues
USD/CAD's short-term bullish momentum continues. The road is wide open for further increase. Hourly support is given at a distance at 1.2414 (27/07/2017 low). Expected to show continued increase.
In the longer term, the pair has broken longterm support that can be found at 1.2461 (16/03/2015 low) before bouncing back. Strong resistance is given at 1.4690 (22/01/2016 high). The pair should head further lower
USD/CHF Growing Selling Pressures
USD/CHF is having some weakness after the pair failed to monitor resistance at 0.9771 (15/06/2017 high). Hourly support at 0.9631 (01/08/2017 low) has been broken. Expected to to show further downside pressures.
In the long-term, the pair is still trading in range since 2011 despite some turmoil when the SNB unpegged the CHF. Key support can be found 0.8986 (30/01/2015 low). The technical structure favours nonetheless a long term bullish bias since the unpeg in January 2015.
USD/JPY Riding Downtrend Channel
USD/JPY's bearish momentum continues. The pair has failed to break resistance implied by the upper bound of the downtrend channel. The pair is heading towards 108.83 (17/04/2017 low). Expected to show further downside pressures.
We favor a long-term bearish bias. Support is now given at 96.57 (10/08/2013 low). A gradual rise towards the major resistance at 135.15 (01/02/2002 high) seems absolutely unlikely. Expected to decline further support at 93.79 (13/06/2013 low).
GBP/USD Monitoring Support At 1.2933
GBP/USD keeps on weakening. Hourly resistance is given at 1.3267 (03/08/2017 high). Hourly support is given at 1.2933 (20/07/2017 low). Expected to show further monitoring of support at 1.2933.
The long-term technical pattern is even more negative since the Brexit vote has paved the way for further decline. Long-term support given at 1.0520 (01/03/85) represents a decent target. Long-term resistance is given at 1.5018 (24/06/2015) and would indicate a long-term reversal in the negative trend. Yet, it is very unlikely at the moment.

EUR/USD Edging Lower
EUR/USD bullish pressures are still on despite ongoing consolidation. Hourly resistance is given at 1.1910 (02/08/2017 high). Hourly support can be found at 1.1715 (08/08/2017 high). Stronger support lies at 1.1613 (26/07/2017 low). Expected to show renewed bullish pressures.
In the longer term, the momentum is now turning largely positive. We favour a continued bullish bias. Key resistance holding at 1.1871 (24/08/2015 high) has been broken while strong support lies at 1.0341 (03/01/2017 low).
Banxico To Stay On Hold, NZD Dips Lower
Banxico: Markets expect no rate hike but...
It is very likely that Banxico will maintain tonight its rate differential with the Fed. The Mexican central keeps on trying to avoid capital outflow that would result from a narrower rate differential. As a result Banxico should keep on hold its overnight rate to 7%. We remember that Banxico changed in 2015 the agenda of its meeting to carefully follow Fed meetings.
This year the central bank has increased four times its overnight rate triggering the strengthening of the MXN. But now, we see things are slowing down. When looking towards the Fed, we believe the US private institution will have more difficulties to deliver further rate hike before 2018 and that the promised shrinking of the balance sheet could provoke further turmoil. This is why we see Banxico cooling down its aggressive hawkish monetary policy and lower its interest rates before year-end.
However, Banxico has definitely some time to do it. Indeed, for example Mexican exports have largely increased in 2017 despite the MXN strengthening which went from 22MXN to almost 17MXN in 7 months against the greenback. This is mostly due to the oil prices jump this year but also to the uncertainties regarding the free trade agreement between US and Mexico that should be renegotiated – Trump estimates that the deal favours low-wage countries.
Other than that, the fundamentals of Mexico are still on the soft side and renewed lower oil prices could very easily reveal all underlying difficulties of the countries. We are turning bearish on the MXN as we believe that Banxico will likely not let the currency appreciate forever knowing that the US giant recovery may take some more time.
NZD/USD tumbles as RBNZ talks the Kiwi down
The New Zealand dollar already started the week on the back foot on the heel of a disappointing second quarter’s inflation figures. It was only the beginning. On Thursday, the Kiwi took another hit but from the central bank this time. Following its monetary policy meeting, the Reserve Bank of New Zealand decided unsurprisingly to hold the official cash rate at 1.75%. However, the monetary institution made a dramatic shift in its language as it made clear it is not happy, at all, with the current strength of the Kiwi.
Assistant Governor McDermott suggested for a second that the bank could move back to intervention should the circumstances require so. However, he added as he tried to allay an overreaction of markets that it was just a little nudge, rather than “a slap across the face”.
NZD/USD was off 0.70% after the release of the statement and the press conference of Governor Wheeler. McDermott’s comments were the final in the coffin, sending the local dollar down another 0.60% to 0.7267. We maintain our bearish view on the pair with the 0.72 level as next target in the short-term.
Investors Looking For Havens On North Korea Tensions
After Spiking On North Korea Tensions CHF Eases Slightly. The Swiss franc eased versus the dollar on Thursday, but still held on to the bulk of hefty gains made the previous day as heightened tensions between the United States and North Korea sent investors looking for havens. The Swiss franc eased against dollar about 0.1 percent to 0.9645 per dollar, having surged about 1.1 percent on Wednesday.
Gold Inches Down From Near Two Month High. Gold prices edged lower early Thursday after reaching near two-month highs hit in the previous session as safe haven demand triggered by rising tensions between the United States and North Korea. We still believe that gold will break $1,300 in this particular rally coming up.
The RBNZ Kept OCR Unchanged. The RBNZ left rates unchanged at record lows of 1.75 percent and maintained its “on hold” guidance for monetary policy. Markets were primed for something slightly more dovish, so the NZD rose a third of a cent and the two-year swap rate rose two basis points.
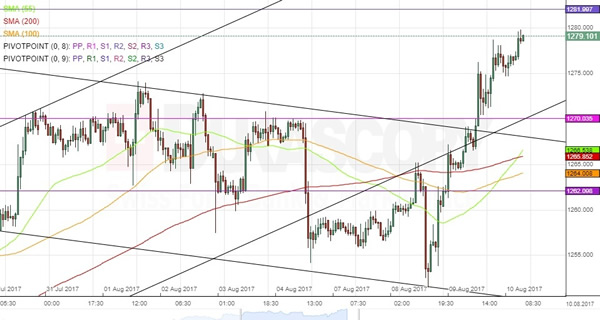
XAU/USD Analysis: Set For More Gains
It can be observed on the hourly chart for the yellow metal that the bullion broke out of the descending channel pattern to the upside. Due to that reason it can be assumed that more gains are to be scored, as on Thursday morning the commodity price fluctuated just below the 1,280 mark. The 1,280 mark seemed to pose some sort of rather weak but still notable resistance. This recent breakout, which was initially not expected, occurred due to fundamental reasons. The recent quarrels between the United States and North Korea have created a sort of run to safety. Moreover, it reversed the recent fundamental strengthening of the US Dollar after the JOLTS Jobs Openings release.
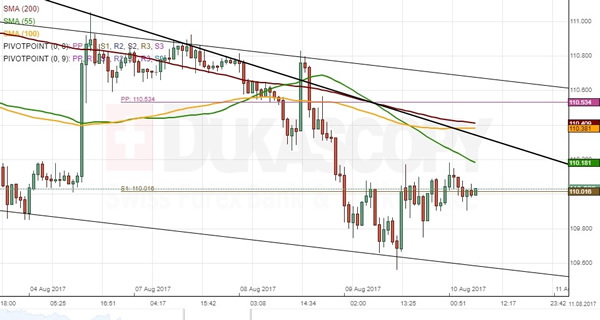
USD/JPY Analysis: Returns Near Weekly S1
The US Dollar appreciated slightly against the Yen on Wednesday, thus returning near the 110 mark. The rate fluctuated around the given line, but failed to form a distinctive wave north. The expected move upwards may be realised in this session, as the Greenback should approach the upper boundary of either a senior or a junior channel down. Given the relatively stable move sideways, the former is likely to be breached this week. Along the way, the pair faces a resistance set by the 55-hour SMA and a cluster of the 100– and 200-hour SMAs circa 110.30 and 110.50, respectively. In case the 55-hour SMA is breached, the latter should halt the pair for the following 24 hours, leaving it in the 110.20/40 area. Traders should keep in mind that three sets of important data are released today.