Sample Category Title
Trade Idea: GBP/USD – Sell at 1.3055
GBP/USD – 1.2960
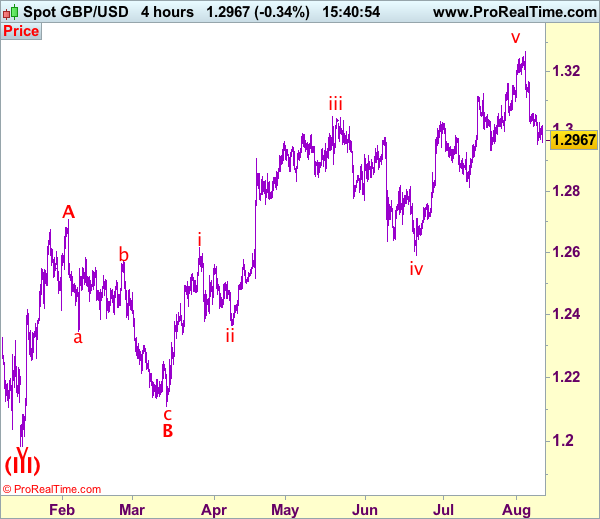
Recent wave: Wave V of larger degree wave (III) has ended at 1.1986 and major correction has commenced from there for gain to 1.3000 and 1.3140-50
Trend: Near term up
Original strategy :
Sell at 1.3090, Target: 1.2890, Stop: 1.3150
Position: -
Target: -
Stop: -
New strategy :
Sell at 1.3055, Target: 1.2860, Stop: 1.3115
Position: -
Target: -
Stop:-
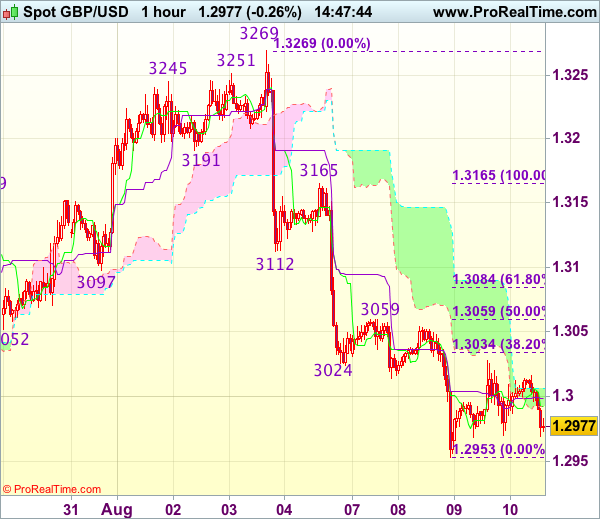
As cable has fallen again after brief recovery, adding credence to our bearish view and suggesting the fall from 1.3269 top is still in progress for retracement of recent upmove, hence further weakness to previous support at 1.2933 would be seen, break there would extend decline to 1.2890-00 and possibly towards 1.2850-60, however, previous support at 1.2812 would hold from here, bring another rebound later.
In view of this, would be prudent to sell cable on subsequent recovery as resistance at 1.3059 should limit upside and bring another decline. Only above previous support at 1.3112 (now resistance) would abort and signal the fall from 1.3269 has ended instead, bring a stronger rebound to indicated resistance at 1.3165 first.
Our preferred count on the daily chart is that cable's rebound from 1.3500 (wave (A) trough) is unfolding as a wave (B) with A ended at 1.7043, followed by triangle wave B and wave C as well as wave (B) has ended at 1.7192, the subsequent selloff is the larger degree wave (C) which is still unfolding with minor wave (III) of larger degree wave 3 ended at 1.1986, hence wave (IV) correction is in progress which could either be a triangle wave (IV) of a complex formation but upside should be limited to 1.3500 and price should falter well below 1.4000, bring another decline in wave (V) of 3 for weakness to 1.1500, then 1.1200.
Euro Forming Major Top At 131.40 Vs Japanese Yen
Key Highlights
- The Euro is carving a major top near 131.40 against the Japanese Yen.
- There was a break below two important bullish trend lines at 130.50 on the daily chart of EUR/JPY.
- Japan’s Machinery New orders in June 2017 declined by 1.9% (MoM) compared with the +3.7% forecast.
- The US Initial Jobless Claims for the week ending Aug 5 2017 will be released today. The forecast is of no change from the last 240K.
EURJPY Technical Analysis
The Euro surged higher in June and July 2017 against the Japanese Yen above 131.00. August 2017 seems to be a bearish month for EUR/JPY, as the pair is carving a top near 131.40.
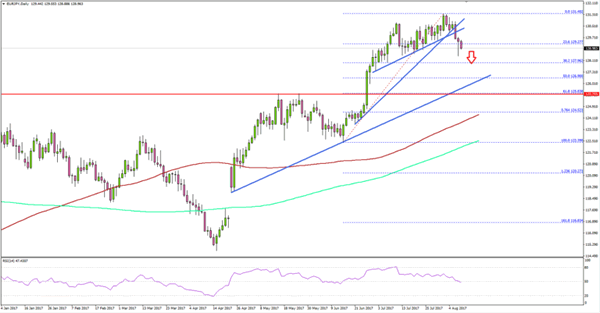
Looking at the daily chart of EUR/JPY, there are clear bearish candles near 131.00-131.40. There was also a break below two important bullish trend lines at 130.50.
The pair has moved below the 23.6% Fib retracement level of the last wave from the 122.39 low to 131.40 high. So, there are high chances of EUR/JPY trading further lower towards 127.00.
The next major support sits at 50% Fib retracement level of the last wave from the 122.39 low to 131.40 high. There is a bullish trend line at 127.00 positioned, which might act as a support on the downside.
On the upside, the broken trend line support at 130.50 can act as a hurdle if the pair attempts a recovery in the short term.
Japan’s Machinery New Orders
Recently in Japan, the Machinery New orders for June 2017 was released by the Cabinet Office. The market was aligned for an increase of 3.7% compared with the previous month.
However, the actual result was completely opposite, as there was a decline of 1.9% in the orders. The yearly change reading was even worse, as there was a decline of 5.2% in the orders. The market forecast was 1% decline and the last reading was +0.6%.
The report added that:
Private-sector machinery orders, excluding volatile ones for ships and those from electric power companies, decreased a seasonally adjusted by 1.9% in June, and showed fell by 4.7% in April-June period.
The EUR/JPY pair remains under bearish pressure and likely to extend declines towards 128.00 or even 127.00 in the near term.
Economic Releases to Watch Today
- US Initial Jobless Claims – Forecast 240K, versus 240K previous.
- US Producer Price Index July 2017 (MoM) – Forecast +0.1%, versus +0.1% previous.
- Producer Price Index July 2017 (YoY) – Forecast +2.2%, versus +2.0% previous.
Trade Idea: EUR/JPY – Hold short entered at 129.50
EUR/JPY - 128.95
Recent wave: wave v of (C) ended at 94.12 and major correction in wave A has ended at 149.79
Trend: Near term up
Original strategy:
Sold at 129.50, Target: 127.50, Stop: 130.10
Position: - Short at 129.50
Target: - 127.50
Stop: - 130.10
New strategy :
Hold short entered at 129.50, Target: 127.50, Stop: 129.50
Position: - Short at 129.50
Target: - 127.50
Stop:- 129.50
Although the single currency rebounded after falling to 128.43 yesterday, reckon upside would be limited and bring another decline later, below said support at 128.43 would extend the fall from 131.40 top for retracement of early upmove to 128.00, then towards previous support at 127.44, however, near term oversold condition should limit downside to 127.00.
In view of this, we are holding on to our short position entered at 129.50. Only break of indicated previous support at 130.09 would abort and suggest low is formed instead, bring a stronger rebound to 130.50-60 but price should falter below resistance at 131.12 and bring another decline later.
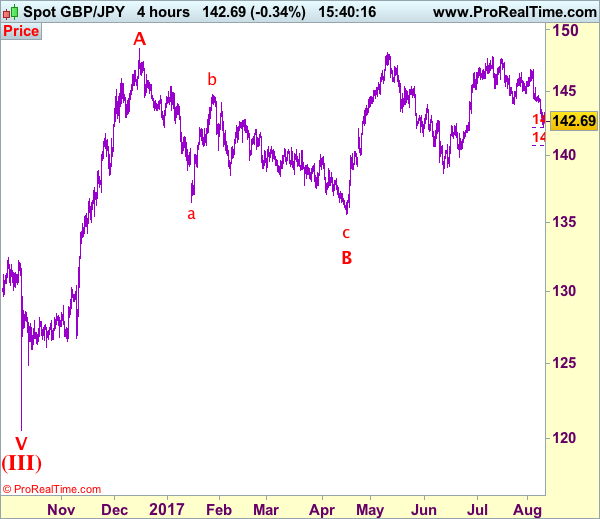
Our latest preferred count is that wave (ii) is ABC-X-ABC which ended at 123.33 and wave (iii) is unfolding with wave iii ended at 100.77, followed by wave iv at 111.57 and wave v as well as the wave (iii) has ended at 97.04, followed by wave (iv) at 111.43 and wave (v) has ended at 94.12 which is also the end of the larger degree v, this also implied the major wave (C) has also ended there, hence major correction has commenced from there with (A) leg unfolding in its lower degree wave c which has possibly ended at 145.69. Under this count, A-B-C wave (B) has commenced with A leg ended at 136.23, wave B at 143.79 and wave C has possibly ended at 149.79.
Our larger degree count is that the decline from 139.26 is wave (C) and is sub-divided into a diagonal triangle i-ii-iii-iv-v with wave i - 105.44, wave ii- 123.33, wave iii - 97.03, wave iv - 111.43, followed by the final wave v as well as the end of wave (C) at 94.12, this also mark the bottom of larger degree wave B. Under this count, major rise in wave C has commenced as an impulsive wave with minor wave III ended at 145.69, wave V is still in progress for further gain to 150.00. Having said that, this so-called wave V could well be the first leg of larger degree 5-waver wave C and this wave C should bring at least a retest of wave A top at 169.97 (July 2008).
Trade Idea: AUD/USD – Stand aside
AUD/USD – 0.7875
Recent wave: Wave 5 ended at 1.1081 and major correction has commenced for fall to 0.7000 and then towards 0.6500-10
Trend: Near term up
New strategy :
Stand aside
Position: -
Target: -
Stop:-
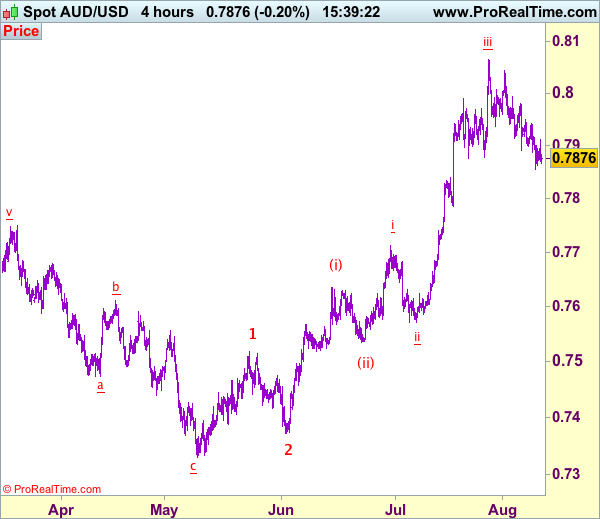
As aussie has remained under near term pressure after recent anticipated retreat, adding credence to our bearishness and further consolidation below recent high of 0.8066 would be seen, hence mild downside bias remains for this move to bring retracement of recent rise in wave iv to 0.7839 (previous resistance tuned support), however, downside should be limited to 0.7786 and price should stay well above wave i top at 0.7712.
In view of this, would not chase this fall here and would be prudent to stand aside for now. On the upside, expect recovery to be limited to 0.7940-45 and bring another decline later. Only break of indicated resistance at 0.7980 would suggest low is formed, bring a stronger rebound to 0.8000, then towards 0.8043 resistance, break there would signal the pullback from 0.8066 top has ended instead, bring retest of this level first. We are keeping our latest bullish count that recent impulsive waves is unfolding as (1 2, (i)(ii), i ii) and may extend headway towards 0.8150.
On the 4-hour chart, the move from 0.8066 is the wave 5 with i: 0.8860, ii: 0.8315, wave iii is an extended move ended at 1.0183, iv: 0.9706 and wave v has ended at 1.1081 (also the top of entire wave 5). The subsequent selloff is the major correction which is unfolding as ABC-X-ABC and 2nd A leg has ended at 0.8848, followed by a-b-c wave B which ended at 0.9758, hence, 2nd C wave is now in progress and indicated downside target at 0.7000 and 0.6950 had been met, so further fall to 0.6710-20 cannot be ruled out.
EUR/GBP Candlesticks and Ichimoku Analysis
Weekly
• Last Candlesticks pattern: N/A
• ime of formation: N/A
• Trend bias: Near term up
Daily
• Last Candlesticks pattern: Doji
• Time of formation: 21 Jul 2017
• Trend bias: Up
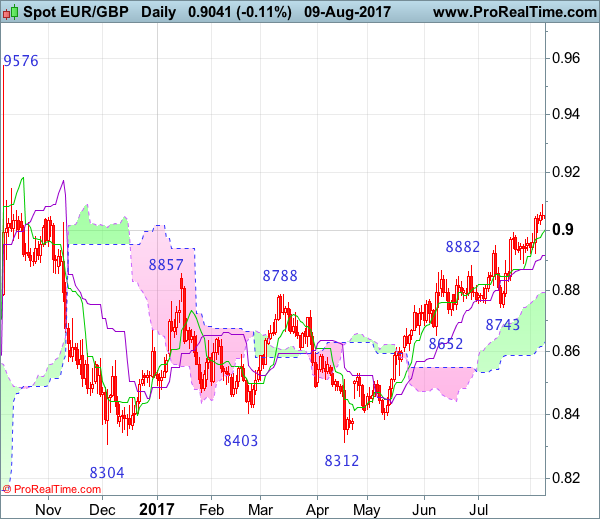
EURGBP – 0.9045
Although the single currency edged higher again this week, the quick retreat from 0.9088 formed a doji star on the daily chart (with relatively long upper shadow), suggesting 1-2 weeks of consolidation below this level would be seen and mild downside bias is for test of support at 0.8923, however, a daily close below the Kijun-Sen (now at 0.8916) is needed to signal a temporary top is formed, bring retracement of recent upmove to 0.8875-80, then 0.8830-35, having said that, renewed buying interest should emerge around 0.8795-00, bring another rise later.
On the upside, above said resistance at 0.9088 would extend recent erratic rise from 0.8304 low to 0.9150-60, however, loss of momentum should prevent sharp move beyond 0.9140-45 and reckon upside would be limited to 0.9200-10, price should falter below 0.9290-00, risk from there has increased for another retreat later.
Recommendation: Buy again at 0.8795 for 0.8995 with stop below 0.8695.
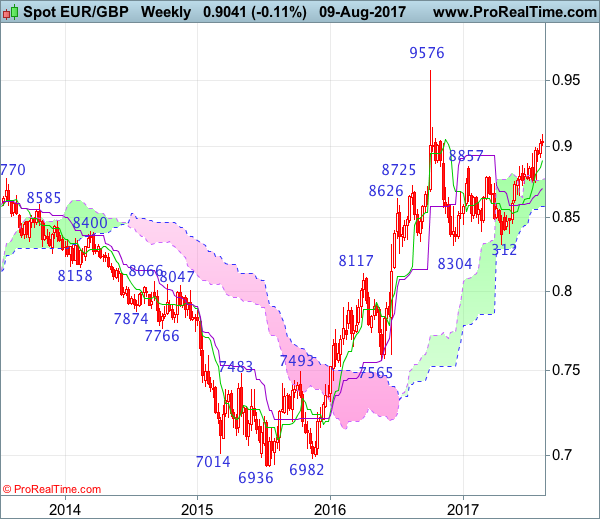
On the weekly chart, as the single currency has eased after rising to 0.9088 this week, suggesting minor consolidation would be seen and initial downside bias is seen for pullback to 0.8950-60, then towards the Tenkan-Sen (now at 0.8904), break there would bring minor correction to 0.8891 support and later 0.8840-50, however, reckon 0.8795-00 would limit downside and bring another rise later. Above said resistance at 0.9088 would add credence to our bullish view that the rise from 0.8304 is still in progress and extend gain to minor resistance at 0.9142. Looking ahead, break there is needed to retain bullishness and signal the entire correction from 0.9576 top has ended at 0.8304 and encourage for further subsequent gain to 0.9200-10.
On the downside, although pullback to the Tenkan-Sen (now at 0.8904) cannot be ruled out, reckon downside would be limited to 0.8795-00 and bring another rise later. Below support at 0.8743 support would defer and risk correction to the Kijun-Sen (now at 0.8700) but reckon downside would be limited to 0.8650-55 and the lower Kumo (now at 0.8571) should remain intact, bring another rally later.
EUR/CHF Candlesticks and Ichimoku Analysis
Weekly
• Last Candlesticks pattern: Long white candlestick
• Time of formation: 24 Jul 2017
• Trend bias: Up
Daily
• Last Candlesticks pattern: Morning doji
• Time of formation: 25 Jul 2017
• Trend bias: Up
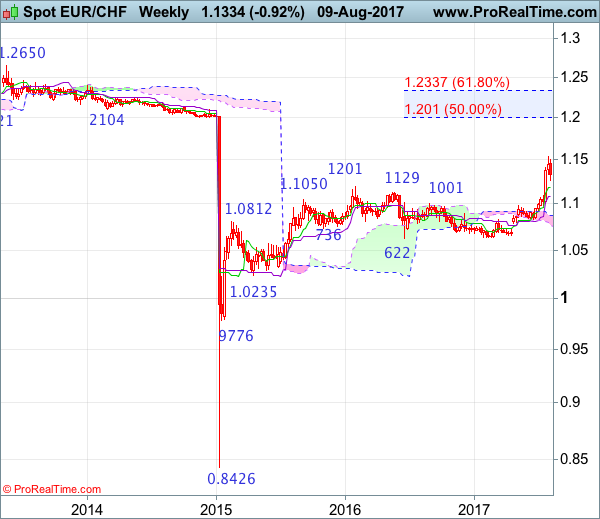
EUR/CHF – 1.1335
Despite rising to 1.1538 late last week, the subsequent sharp retreat suggests a temporary top has possibly been formed there and consolidation with mild downside bias is seen for test of the Kijun-Sen (now at 1.1238), however, a daily close below there is needed to add credence to this view, bring retracement of recent upmove to 1.1185 (50% Fibonacci retracement of 1.0833-1.1538), however, near term oversold condition should limit downside and reckon 1.1100-05 (61.8% Fibonacci retracement) would hold, bring rebound later.
On the upside, whilst initial recovery back towards the Tenkan-Sen (now at 1.1400) cannot be ruled out, reckon upside would be limited to 1.1440 and price should falter below 1.1500, bring another retreat later. Only a break of said last week’s high at 1.1538 would confirm recent upmove has resumed and extend headway to 1.1600-10, however, further sharp move beyond 1.1700 should not be repeated and price should falter below 1.1770-80, bring retreat later this month.
Recommendation: Exit long entered at 1.1335 and stand aside for this week.

On the weekly chart, although the single currency extended recent upmove to as high as 1.1538 late last week, the subsequent retreat looks set to form a black candlestick this week, suggesting consolidation below this level would be seen and pullback to 1.1250-60, then towards the Tenkan-Sen (now at 1.1186) cannot be ruled out, however, a weekly close below the Tenkan-Sen is needed to signal a temporary top is formed, bring retracement of recent upmove to 1.1100-05 (61.8% Fibonacci retracement of 1.0833-1.1538) then test of the Kijun-Sen (now at 1.1085) but reckon support at 1.0987 would remain intact.
On the upside, although initial recovery to 1.1400-10 cannot be ruled out, reckon upside would be limited to 1.1440-50 and price should falter below 1.1500, bring another retreat later. Only a break of said last week’s high at 1.1538 would revive bullishness and extend the major rise from 0.8426 low for headway to 1.1590-00, then towards 1.1700-10, however, near term overbought condition should prevent sharp move beyond 1.1800 and reckon 1.1900-10 would hold from here, risk from there has increased for a retreat to take place later this month.
USDJPY Sees Increasing Risk Of Shifting From Neutral To Bearish Phase
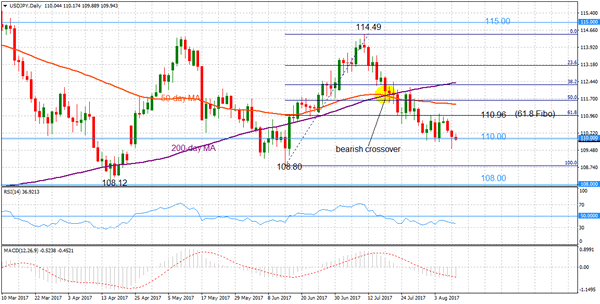
USDJPY maintains risk to the downside as momentum indicators are bearish and not yet oversold, giving scope for further declines. The market has been neutral in the past two months and has not closed below the key 110.00 level since June 14.
After dipping to 109.55 yesterday, prices bounced back but a daily close below the critical 110.00 level would increase downside pressure for a move towards the June 14 low of 108.80, bringing a shift to a bearish phase, with scope to target the April 17 low of 108.12.
Only a move back above 110.96 would weaken downside pressure. It would be a challenge to break this level which has acted as strong resistance in the past week. It is the 61.8% Fibonacci retracement level of the rise from 108.80 to 114.49. The next target resistance would be the 50% Fibonacci at 111.60, which is close to the 50-day moving average. A break above the 200-day moving average and a move into the 113.00 handle would improve the odds for a re-test of the June 11 high of 114.49 and bring a resumption of the June to July uptrend.
The bearishly aligned moving averages after the crossover of the 50-day below the 200-day MA on July 17, along with the bearish momentum signals, increase the risk of a shift to a bearish phase from the current neutral one.
Trade Idea : USD/CHF – Sell at 0.9725
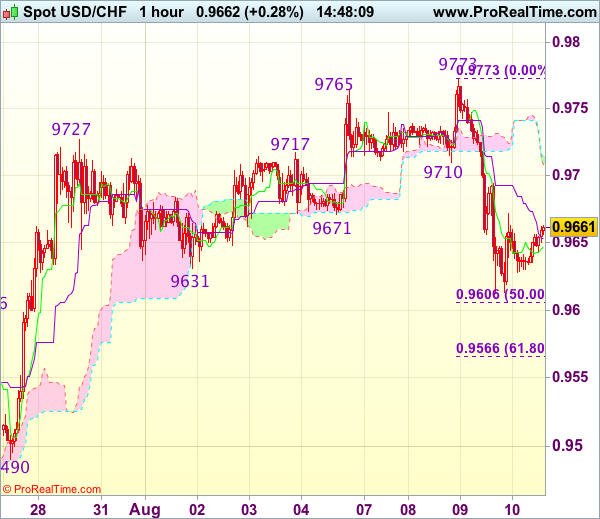
USD/CHF - 0.9663
Most recent candlesticks pattern : N/A
Trend : Near term up
Tenkan-Sen level : 0.9652
Kijun-Sen level : 0.9693
Ichimoku cloud top : 0.9715
Ichimoku cloud bottom : 0.9708
Original strategy :
Sell at 0.9725, Target: 0.9625, Stop: 0.9760
Position : -
Target : -
Stop : -
New strategy :
Sell at 0.9725, Target: 0.9625, Stop: 0.9760
Position : -
Target : -
Stop : -
As the greenback recovered after yesterday’s selloff to 0.9612, suggesting consolidation above this level would be seen and gain to 0.9700 cannot be ruled out, however, as top has been formed at 0.9773, reckon upside would be limited to 0.9720-25 and bring another decline, below said support at 0.9612 would add credence to this view and extend the fall from 0.9773 top for retracement of recent upmove to 0.9605-10 (50% Fibonacci retracement of 0.9438-0.9773), then 0.9580 but reckon 0.9665 (61.8% Fibonacci retracement) would hold from here.
In view of this, we are looking to sell dollar on subsequent recovery as 0.9725-30 should limit upside. Only a break of this week’s high at 0.9773 would abort and revive bullishness for the rise from 0.9438 to extend gain to 0.9800-10.
Gold Continue To Shine On North Korean Tension
Fundamental Analysis
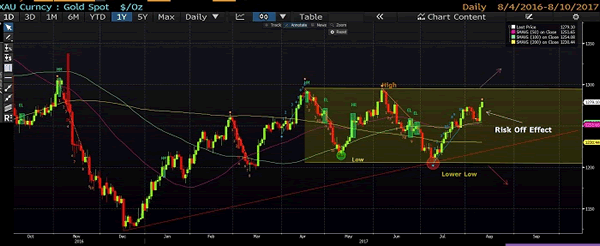
- The war of words between the two countries US and North Korea is helping the yellow metal to score more gains.
- The momentum would remain strong as long as the rhetorical brinkmanship between President Trump and North Korea does not come to end
Technical Analysis
- The Price above the 100 and 200-day moving average confirms that the uptrend is in intact
- The Price has broken the Augst resistance and this explains that the bull trend is strong
- Candle session (which marks the end/start of new trend at 8,10 & 13) is at 10 which means caution
Levels To Watch
- Next Resistance is at 1295
- Next support is at 1243
Trade Idea : GBP/USD – Hold long entered at 1.3000
GBP/USD - 1.2980
Most recent candlesticks pattern : N/A
Trend : Near term down
Tenkan-Sen level : 1.2993
Kijun-Sen level : 1.2999
Ichimoku cloud top : 1.3006
Ichimoku cloud bottom : 1.2992
Original strategy :
Bought at 1.3000, Target: 1.3100, Stop: 1.2965
Position : - Long at 1.3000
Target : - 1.3100
Stop : - 1.2965
New strategy :
Hold long entered at 1.3000, Target: 1.3100, Stop: 1.2965
Position : - Long at 1.3000
Target : - 1.3100
Stop : - 1.2965
Although cable has retreated again today, as long as 1.2965-70 holds, further consolidation above yesterday’s low at 1.2953 would be seen and prospect of another rebound remains and gain to 1.3059 resistance is likely, however, break there is needed to signal low is possibly formed at 1.2953, bring test of 1.3080-85 (61.8% Fibonacci retracement of 1.3165-1.2953), break there would add credence to this view, bring a stronger rebound to 1.3110-20 but resistance at 1.3165 should remain intact.
In view of this, we are holding on to our long position entered at 1.3000. Below 1.2965-70 would signal decline has resumed and extend the fall from 1.3269 top towards previous chart support at 1.2933 but reckon 1.2900 would hold from here, risk from there has increased for a rebound to take place later.