Sample Category Title
Market Morning Briefing: Better Than Expected US NFP Data
STOCKS
Dow (22092.81, +0.30%) has moved up in line with our expectation and could move face slight rejection near 22200 before again moving up towards 22500.
Dax (12297.72, +1.18%) has bounced sharply from support near 12100 and while that holds, a test of 12400-12500 seems possible.
Shanghai (3260.96, -0.03%) has been coming off from resistance near 3300 as expected and is headed towards our 3240 in the coming sessions.
Nikkei (20078.12, +0.63%) remains stable and could bounce back from levels near 19900 towards 20100 in the next few sessions.
Nifty (10066.40, +0.53%) could test 9940/30 before again heading towards 10200. Overall immediate trade is seen within 10200-9930 levels.
COMMODITIES
Failure to rise above the resistance of 1270-75 has dragged Gold (1258) down as it test the immediate support of 1258 below which comes 1245. As discussed last week, in case the Support at 1245 breaks, there will be a further dip to 1230 and 1210 levels respectively.
Silver (16.2540) has broken the support of 16.50 and achieved the initial target of 16.20 already with the next target 15.90 not too far away. Immediate resistance comes at 16.50 and trading below that, Silver may decline to 15.60-30 levels.
Copper (2.88) is consolidating at the higher levels in the narrow range of 2.85-92 but it may soon resume the larger uptrend for the higher levels of 3.00-12. Immediate support comes at 2.78.
Brent (52.36) and WTI (49.57) are testing the upper ends of their respective ranges of 48-53 and 47.60-50.50 respectively. The bullish stance remains unchanged as long as they are trading above 48.70 and 45.50 levels on a weekly closing basis.
FOREX
Better than expected US NFP data triggered short covering in Dollar Index (93.49) from 92.50, short of our downside target of 92.00 but unless a weekly closing above 94.10-40 is seen, the downside risks remain open. Euro (1.1794) has entered a corrective phase after hitting a high near 1.19 but if the correction remains limited to 1.1600 levels, then the larger uptrend may resume after a few sessions.
Dollar-Yen (110.71) is oscillating in the range of 109.30-111.10 as expected and it make continue to do so for another couple of sessions before attempting a breakout for a trending move.
Pound (1.3052) has confirmed the August high of 1.3266 as the near term high and may decline further towards 1.2950-30 in the next few sessions.
Aussie (0.7942) shows no change as it trades horizontally in the range of 0.7875-0.8050 which may continue for a few more sessions. Repeat - the larger trend remains up and the higher targets of 0.8100-70 remain unchanged.
Dollar Rupee (63.58) is trading at 63.74 in the NDF following the better than expected US NFP data but any corrective bounce may be expected to face selling pressure in the region of 63.90-64.10. Immediate resistance comes around 63.76.
INTEREST RATES
The UK yields are headed to lower levels and could move down in the near term. The 5YR (0.56%), 10Yr (1.18%) and the 20YR (1.71%) may test 0.50%, 1.12% and 1.65% respectively in the coming sessions.
The Japan yields look bullish for the near term. The 10Yr (0.07%) could move up towards 0.08% in the next few sessions.
The US yields are almost stable and could move up slightly. The 10Yr (2.27%) may test 2.32% while the 5YR (1.82%) could come up to 1.89%.
The German-US 10YR (-1.80%) could come off towards -1.85% bring down Euro with itself by this week. While the yield spread moves lower Euro could see some dip towards 1.16. (Refer to FOREX section above)
GOLD – Vulnerable, Faces Further Weakness
GOLD - With the commodity backing off higher prices to close lower the past week, further decline is likely. On the downside, support comes in at the 1,250.00 level where a break will turn attention to the 1,240.00 level. Further down, a cut through here will open the door for a move lower towards the 1,230.00 level. Below here if seen could trigger further downside pressure targeting the 1,220.00 level. Conversely, resistance resides at the 1,270.00 level where a break will aim at the 1,280.00 level. A turn above there will expose the 1,290.00 level. Further out, resistance stands at the 1,300.00 level. All in all, GOLD looks to pullback further.
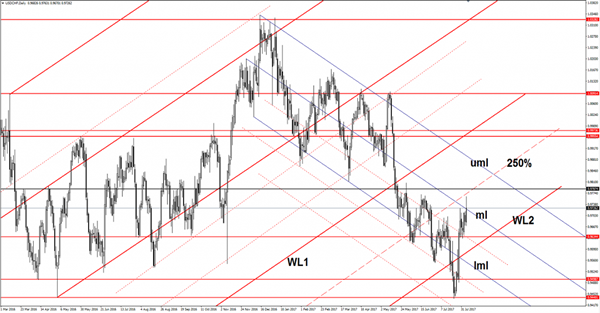
USD/CHF Breakout In Play
USD/CHF is strongly bullish on the Daily chart and now is trying to take out the dynamic resistance from the median line (ml) of the descending pitchfork. A valid breakout will confirm a further increase towards the next upside targets from 0.9787 static resistance and from the upper median line (uml) of the descending pitchfork.
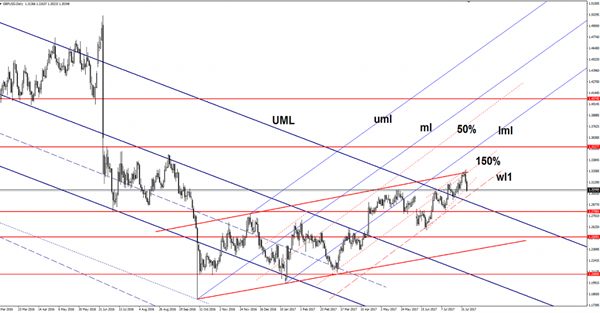
GBP/USD Turned To The Downside
Price drops like a rock as the USD received support from the United States economic data on Friday, remains how long this corrective phase will be. Now is pressuring the 1.3046 static support and could approach and retest the warning line (wl1) of the minor ascending pitchfork.
The warning line represents a critical support because a valid breakdown will open the door for more declines in the upcoming period.
Support can be found at the upper median line (UML) as well, price goes down after the false breakout above the upside line of the ascending channel. Only a valid breakdown below the UML will validate a major drop.
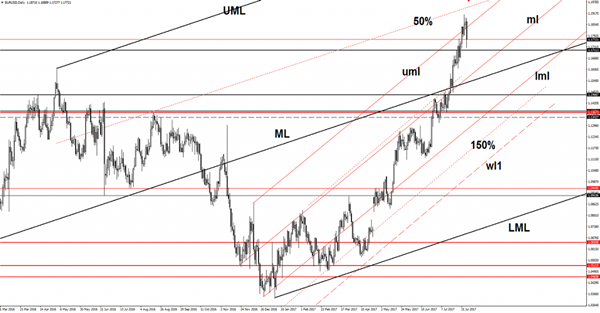
EUR/USD Plunged Aggressively
Price edged lower on Friday and touched new lows, could decrease further in the start of the week as the USDX could climb much higher on the short term. USD managed to recover as the United States data have finally come in better.
USDX is trading right below the 93.50 psychological level and could jump above this obstacle again in the upcoming hours. The greenback could dominate the currency market if the USDX will have enough energy to resume the Friday's throwback.
I've said in the previous analysis that we may have a bounce back on the dollar index if the 92.49 static support will hold, the index failed to reach and retest this level, signaling that the bulls are in the game.
Price dropped much below the upper median line (uml) of the minor ascending pitchfork after the failure to stabilize above this obstacle. Was almost to reach and retest the 1.1711 static support on Friday, but the bears weren't so strong.
EUR/USD could still retest the mentioned support level and could move in range above it. Only a valid breakdown below this level will confirm a further drop. Could be attracted by the median line (ml) of the minor ascending pitchfork, where he could find support as well.
The perspective remains bullish on the Daily chart as long as the rate is trading above the mentioned support levels. The current drop is natural after the impressive rally and after the failure to reach and retest the 50% Fibonacci line (ascending dotted line) of the major ascending pitchfork.
A reversal sign will appear if will make a valid breakdown below the median line (ML) of the major ascending pitchfork, this scenario will take shape only if the USDX will climb towards the 95.00 psychological level.
EURUSD – Rejects Higher Prices, Remains Vulnerable
EURUSD - The pair closed slightly higher on a rejection candle the past week leaving risk lower in the new week. Resistance comes in at 1.1800 level with a cut through here opening the door for more upside towards the 1.1850 level. Further up, resistance lies at the 1.1900 level where a break will expose the 1.1950 level. Its weekly RSI is pointing higher suggesting more strength. Conversely, support lies at the 1.1700 level where a violation will aim at the 1.1650 level. A break of here will aim at the 1.1600 level. All in all, EURUSD faces further corrective downside pressure on price rejection.
EURGBP – Remains Bullish, Resumes Broader Uptrend
EURGBP - The cross faces further upside pressure after resuming its short term uptrend the past week. Support lies at the 0.9000 level where a violation will turn focus to the 0.8950 level. A break will expose the 0.8900 level. Resistance resides at the 0.9050 level where a violation if seen will turn risk towards the 0.9100 level. Further up, resistance resides at 0.9150 level followed by the 0.9200 level. Its weekly RSI is bullish and pointing higher suggesting further strength. All in all, EURGBP remains biased to the upside further bullishness.
Repatriation ?
The Dollar rally had a bit to do with the July Jobs report, but it was more about repatriation pledged from White House Economic Advisor Cohn. The July jobs report was sound across all headlines, and while wage growth came in just above expectation, it remains sombre.Despite the rally, the USD dollar is by no means out of the woods, but a return to US fiscal policy headlines or a more aggressive Fed balance sheet initiative will present some serious headwinds to the weaker US dollar narrative.
Just as the market had predictably begun to fade the post NFP headline inspired dollar rally, National Economic Council director Gary Cohn repatriation comment caught the market oversold dollars, and while the correction may be temporary, it does suggest traders are taking a more balanced view of US dollar risk given the latest US fiscal headline.
Repatriation flow is nothing to sneeze at, and despite the lowest hanging fruit on the Trump economic plan, U.S. corporations have been squirrelling profits and cash abroad to avoid paying the 35 % tax stamp at home for decades.Undoubtedly multiple billions will be held in foreign currency that will need to be converted to USD. While difficult to put an exact figure on this amount it's thought to be somewhere between 250-500 billion in foreign currency. Regardless of the exact size those are some hefty numbers and will prove USD positive not only from a money inflow perspective but will also reduce the US current account deficit making US assets that more appealing to foreign investors.
However, we've been down this road before as traders adopt a case of once bitten twice shy at this morning open while desperately searching for reliable details on the Homeland Investment Acts tax repatriation
Much of this year's dollar sell off has been on the back of Fed rate hike uncertainty and President Trump's pro growth initiatives which have struggled to get government support. With the CME Group's FedWatch tool barely budging on the NFP, the repatriation comments were by all accounts the primary catalyst for the short dollar unwind
The focus will shift to Fed speak as Dudley, Brainard, and Kaplan all hit the wires this week. With the market turning to Fed on hold for 2017, dealers will be looking for any change to a more aggressive balance sheet reduction narrative which could spark an extension of last weeks dollar rally
Given typical August liquidity conditions, we could be in for a bumpy week as the market irons our if we're in a short term USD correction or a trend reversal.
Examples of Evolving Head and Shoulders Pattern
In the past couple of articles, we looked at some ways on how traders can get an early start into trading an evolving head and shoulders pattern as well as some tips in how to set more achievable targets when trading this commonly found and one of the simplest chart patterns.
In this final series, we take a look some examples on how you can trade the head and shoulders pattern in real time.
Example 1 (A near textbook example)
Evolving Head and Shoulders pattern (Example 1)
The above example shows how you could have traded this pattern. After the neckline support had been formed with prices testing support near the left shoulder, price rallied to make a higher peak (head) and bouncing off to form the right shoulder.
Using, the Fib tool, we first measure the neckline to the head's high and watch for potential reversal near 61.8% - 78.6% Fib level. When prices reverse here, sell at the market with stops at the high of the head, targeting the neckline, 161.8% Fibonacci extension from the head to the neckline and finally the full measured move (200% level).
Stops are moved to break even after the first target is reached.
Example 2 (A near textbook example)
Evolving Head and Shoulders pattern (Example 2)
The second example above shows a smaller version of the head and shoulders pattern. Here the trick is in catching the retracement that formed the right shoulder rather quickly. Price action has been choppy at the 618% - 78.6% reversal level.
Price quickly continued lower on a breakout from the neckline, reaching the first target followed by 1618% and 200% of the Fibonacci extension from the head to the neckline support level.
Example 3 (Missed opportunity)
Evolving Head and Shoulders pattern - Missed opportunity (Example 3)
The above example shows price respecting the structure of the head and shoulders pattern without meeting the guidelines.
This is a missed opportunity, but it shows that the pattern can at times continue to respect the head and shoulders measured move approach without having to meet the guidelines. A trader should exhibit discipline to take the trades that only fulfill the criteria.
Example 4 (Structure is respected)
Not a textbook Head and Shoulders pattern, but structure is still respected
The next example here shows a head and shoulders pattern that is not quite a neat head and shoulders pattern. At the right shoulder, the reversal is missed as price falls short of rallying to the 61.8% - 78.6% Fibonacci level. Still, despite the breakout from the neckline, price rallies back to the reversal zone before pushing lower. This pattern is a bit tricky to trade, but illustrates how price action can at time respect the structure and the rules. Another interesting bit about this example is the price reversal near 161.8% without reaching the final target.
Example 5 (Patience is key)
Head and shoulders pattern, patience is the key to this setup
In this example, you can see the rather delayed period in the formation of the right shoulder. You will also see that this is not your clean head and shoulders pattern, but the structure is respected well enough to offer a profitable trade set up here. Again, you will see prices bouncing off the 161.8% (target 2) in this setup.
Example 6 (An evolving pattern that was invalidated)
Evolving Inverse Head and Shoulders pattern (Neckline resistance is formed)
In this example, we have a pattern that is still evolving. We can see the neckline resistance formed with the left shoulder and the head formed. Currently, we wait for the price to fall towards the 61.8% - 78.6% reversal zone (1.3002 - 1.2977) for long positions with targets set to 1.3901, 1.3180 and 1.3235 with stops at 1.2947.
Trading the head and shoulders pattern - Conclusion
In conclusion, the above examples illustrate how traders can simply focus on the head and shoulders pattern and try to catch the setups early on. With proper focus on risk management, this approach to trading can yield significant profits over time. The only downside being that the trader will have to constantly monitor the various securities or assets on an almost daily basis and across different time frames in order to catch the set up while it is still evolving.
EUR/USD Weekly Outlook
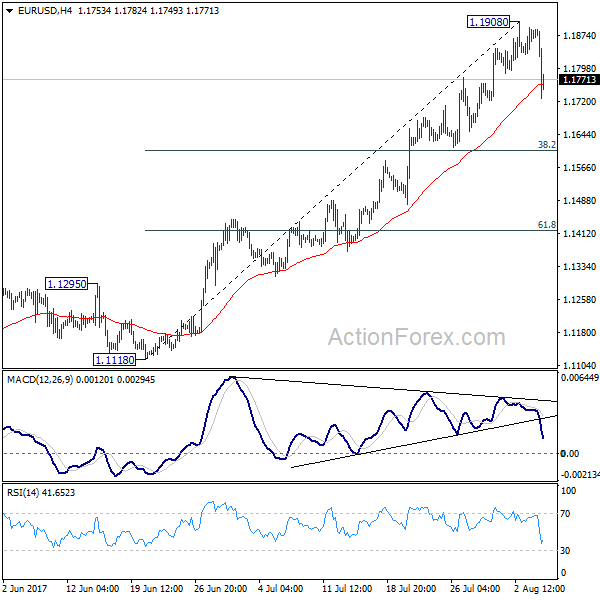
EUR/USD surged to as high as 1.1908 last week but retreated sharply. The development suggests short term topping with bearish divergence condition in 4 hour MACD. Initial bias is mildly on the downside this week for 38.2% retracement of 1.1119 to 1.1908 at 1.1606 to bring rebound. On the upside, break of 1.1908 is needed to confirm rally resumption. Otherwise, we'd now expect more corrective trading with risk of another fall.
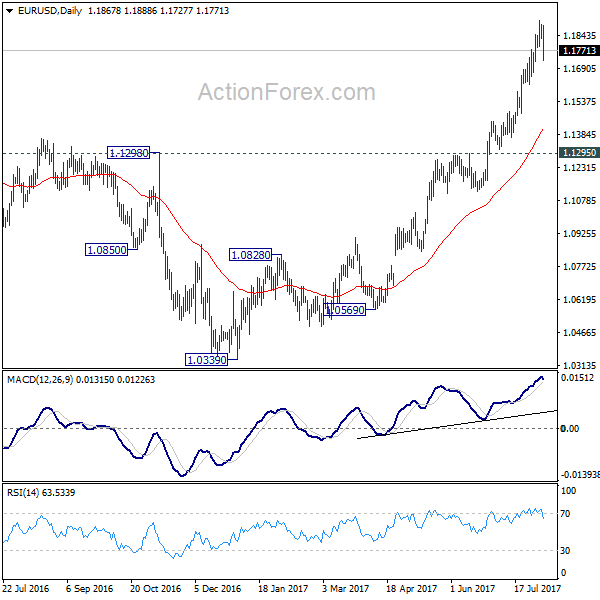
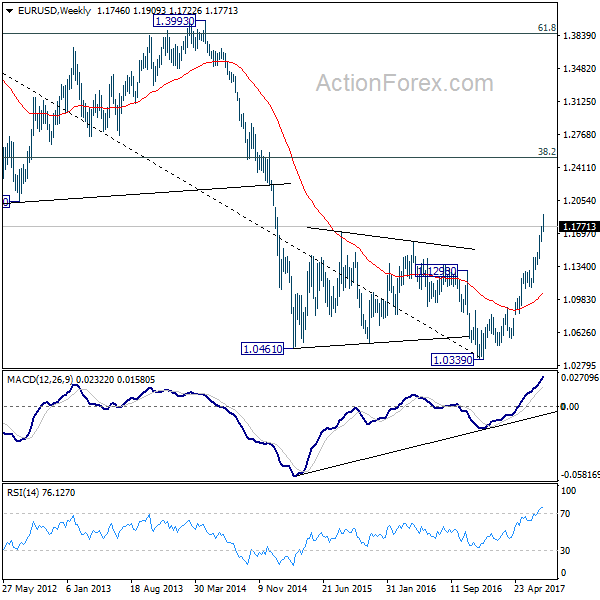
In the bigger picture, an important bottom was formed at 1.0339 on bullish convergence condition in weekly MACD. Sustained break of 55 month EMA (now at 1.1760) will pave the way to key fibonacci level at 38.2% retracement of 1.6039 (2008 high) to 1.0339 (2017 low) at 1.2516. While rise from 1.0339 is strong, there is no confirmation that it's developing into a long term up trend yet. Hence, we'll be cautious on strong resistance from 1.2516 to limit upside. But for now, medium term outlook will remain bullish as long as 1.1295 support holds, in case of pull back.
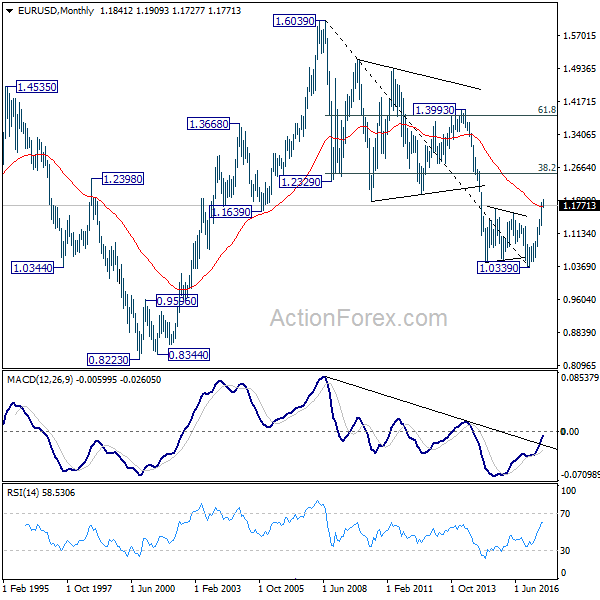
In the long term picture, 1.0339 is now seen as an important bottom as the down trend from 1.6039 (2008 high) could have completed. It's still early to decide whether price action form 1.0339 is developing into a corrective or impulsive move. But in either case, further rally would be seen to 38.2% retracement of 1.6039 to 1.0339 at 1.2516