

Sample Category Title
More Upside in Dollar With Short Term Bottom Formed, Euro Rally Looks Tired
Dollar staged a strong rebound towards the end of the week as boosted by an overall set of solid job data. While the greenback still ended lower against Euro for the week, it's now looking likely that the greenback has found a short term bottom already. It's still early to confirm a trend reversal for Dollar yet. And we believe the key lies in the yet to be confirmed fiscal policy of US President Donald Trump. But for now, Dollar will probably gyrate higher in the early part of this week until CPI release on Friday. On the other hand, while Euro ended the week as the strongest currency, its rallies against Dollar, Yen and even Swiss Franc are starting to look tired. Sterling ended the week generally lower after markets perceived the BoE Super Thursday as a dovish one. But commodity currencies were even weaker with Canadian Dollar starting to pare back the strong gains in the past two months.
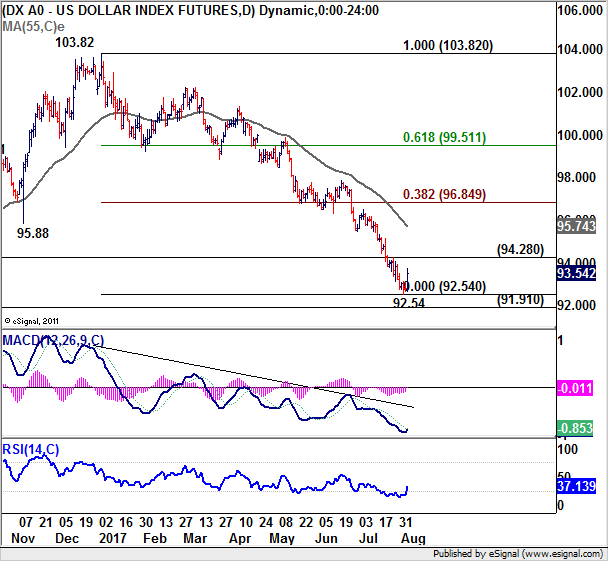
Dollar index starting to feel the support from 91.91/3 key cluster
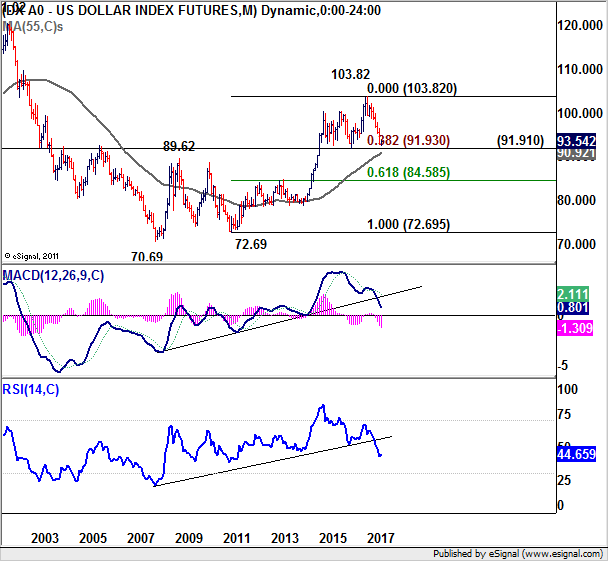
Recapping the outlook of Dollar index, the fall from 103.82 is seen as a move corrective long term up trend from 72.69 (2011 low) to 103.82 (2017 high). It's now close to key cluster support level at 91.91/93 (38.2% retracement of 72.69 to 103.82 at 91.93), which is reasonably close to 55 month EMA (now at 90.92). While Friday's post NFP rebound doesn't confirm trend reversal yet, we'll start to look for more signals of bottoming. 94.28 resistance will be the first hurdle for the index. Break there will bring stronger rise back to 55 day EMA (now at 95.74). In case of another fall, we'll still expect strong support from 91.91/93 to contain downside and bring sustainable rebound.
Treasury not confirming Dollar strength yet
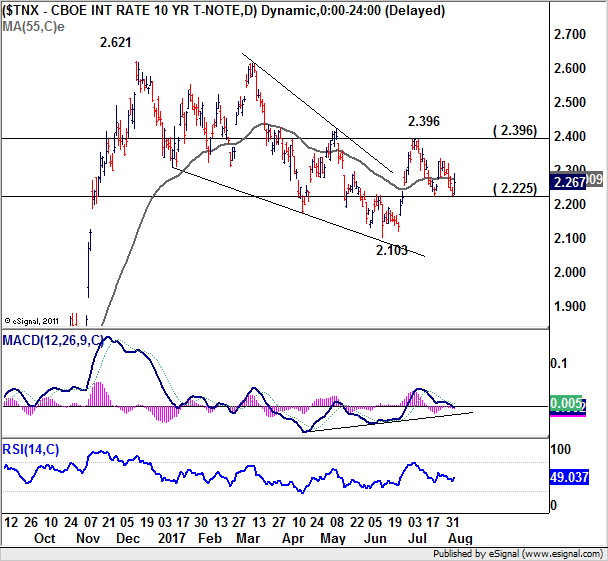
In our view, the rebound in dollar has to be accompanied by rally in treasury yields to confirm the underlying inflationary force in the economy and growth momentum, and thus, a continuous tightening path of the Fed. While DOW made record high at 22092.81, strength in stocks could either be interpreted as optimism on the economy or expectation for Fed to slow down tightening. Indeed, Fed fund futures are still pricing in less than 50% chance of a rate hike by Fed by the end of the year. That suggests investors are not yet convinced that Fed policy makers are overjoyed by the NFP report.
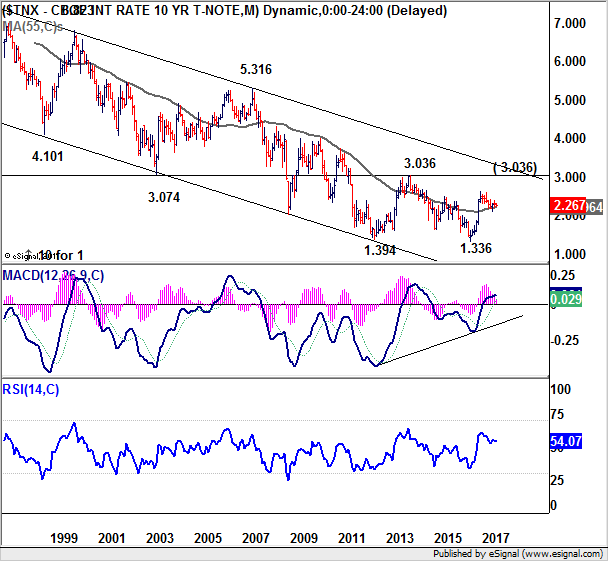
For now 10 year yield is being supported by 2.225 level and it would extend range trading between 2.225/2.396 this year. But break of 2.396 is needed to confirm resumption of rebound from 2.103 and completion of correction from 2.621. Otherwise the choppy fall from 2.621 could still extend through 2.103 after breaking 2.225. And as long as 2.396 holds, we'll look at dollar index's rebound cautiously and see that as a correction. And in the longer term picture, TNX is still far off the key structure resistance at 3.036, which defines and long term down trend.
Euro rally looks tired
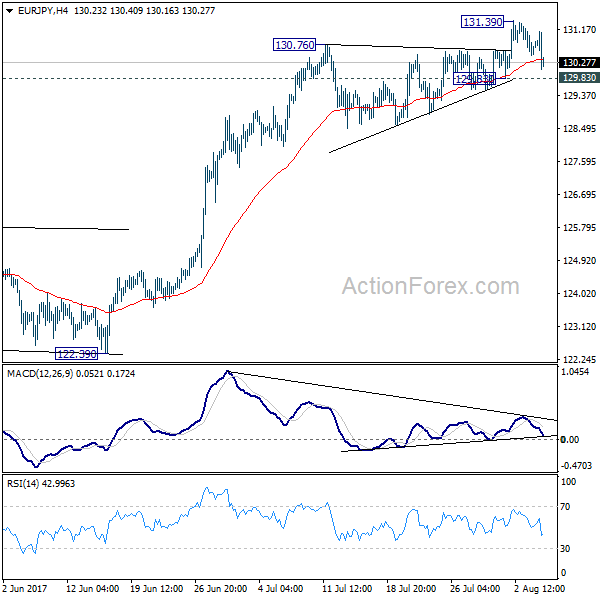
But after all, as the rally Euro is starting to look tired, favor is mildly on the Dollar's side in near term. For example, EUR/JPY retreated sharply after initial breakout to 131.39. There is bearish divergence see in 4 hour MACD. The brief spike after triangle breakout is a typical wave five, with the triangle as wave four. EUR/JPY will likely head back to 129.83 and break will confirm short term topping. In that case, deeper decline would be seen back to 55 day EMA (now at 127.35).
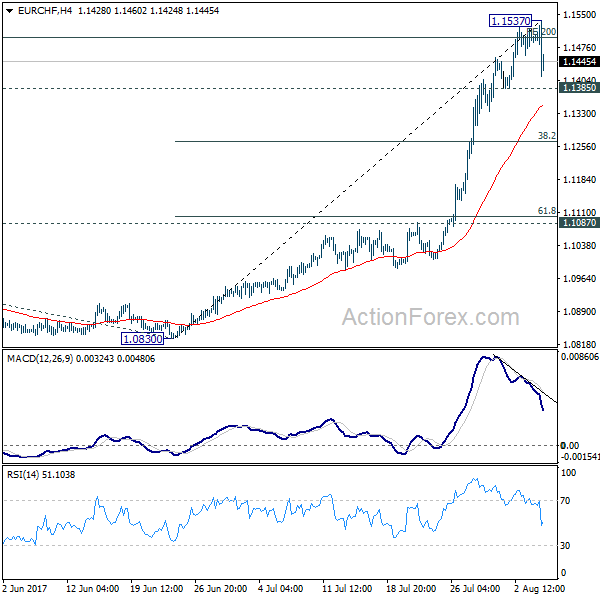
EUR/CHF also lost much momentum after extending recent high to 1.1537. Bearish divergence condition is seen in 4 hour MACD after the cross hit 200% projection of 1.0652 to 1.0986 from 1.0830 at 1.1498. Considering that it it's also high in overbought position in daily RSI, the cross should be turning into a corrective phase. Break of 1.1385 this week will bring pull back to 38.2% retracement of 1.0830 to 1.1537 at 1.1267. Short to medium term Euro position traders could consider to lighten up their Euro long for now, and prepare to buy again later.
Trading strategy: Sell GBP/USD for a near term trade
Regarding trading strategy, we'll look at opportunities to buy Dollar for a near term trade. Considering the above analysis, even though there is no confirmation of trend reversal yet, the greenback is in favor to move higher in near term, with help of pull back in Euro too. Sterling is considered to be the better candidate to sell against Dollar. BoE announcement last week firstly indicates that Kristin Forbes' replacement Silvana Tenreyro is not a hawk. Growth projections for 2017 and 2018 were both revised down. And more importantly, inflation forecast for 2018 and 2019 were kept unchanged suggesting that policy makers have calmed down from the inflation surge earlier in the year. That is, the chance of an earlier hike is gone and the base case is back. BoE will hand their hands until the picture of Brexit becomes clear.
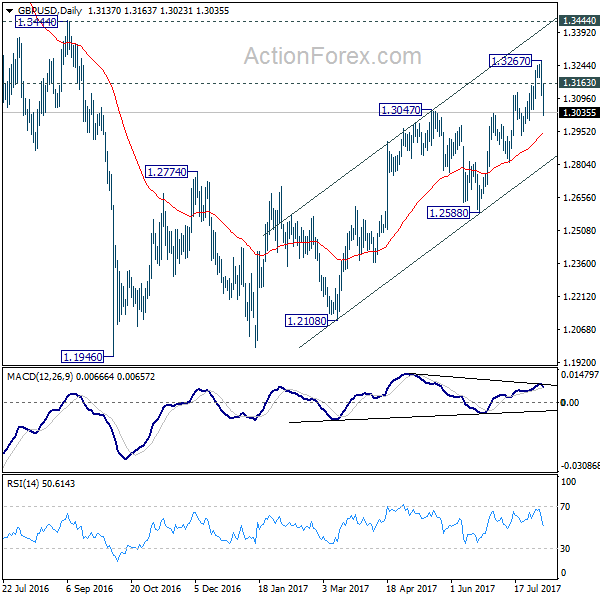
Technically, bearish divergence condition in both daily and 4 hour MACD suggests short term topping at 1.3267. And deeper fall would likely be seen back to 55 days EMA (now at 1.2938) or further to channel support (now at 1.2803). As we're viewing price actions from 1.1946 as a correction, there is prospect of a retest of this low down the road (but it's too early to confirm completion of the correction yet). So we'll sell GBP/USD at market at the start of the week, with a stop at 1.3165. We'll see how it goes when GBP/USD approaches channel support.
USD/CAD Weekly Outlook
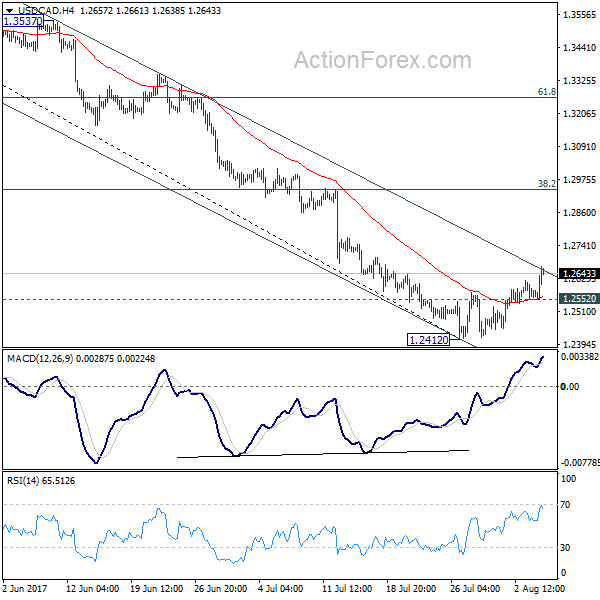
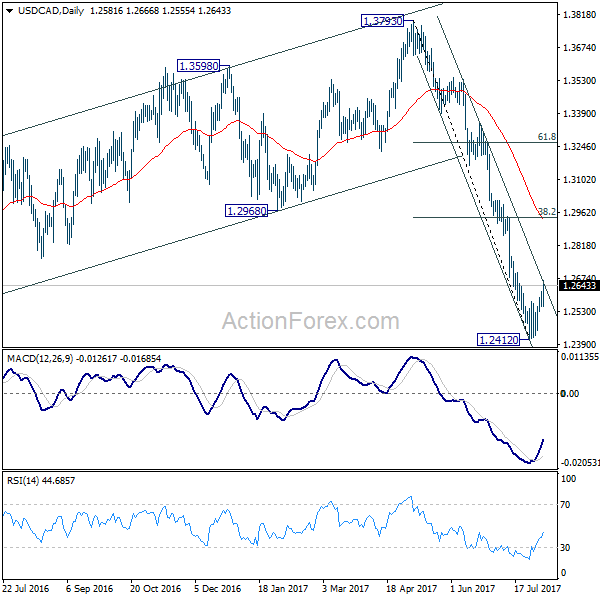
USD/CAD's rebound last week confirmed short term bottoming at 1.2412. Initial bias stays on the upside this week. Current rebound could be corrective whole decline from 1.3793 and might target 38.2% retracement of 1.3793 to 1.2412 at 1.2940. On the downside, break of 1.2552 minor support will indicate completion of the rebound. In such case, intraday bias will be turned back to the downside for 1.2412 low.
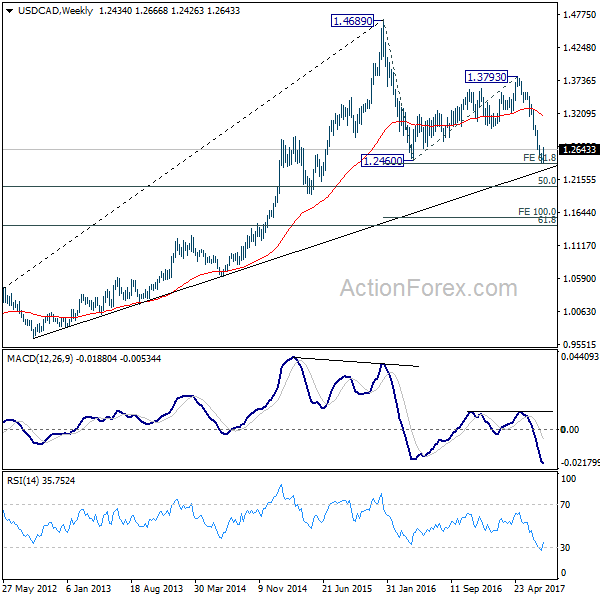
In the bigger picture, price actions from 1.4689 medium term top are seen as a correction pattern. A short term bottom is formed at 1.2412 after hitting 61.8% projection of 1.4689 to 1.2460 from 1.3793 at 1.2415. But there is no sign of completion of the correction yet. Break of 1.2412 will target 50% retracement of 0.9406 to 1.4869 at 1.2048. At this point, we'd look for strong support from there to contain downside and bring rebound. Meanwhile, sustained break of 1.2968, 38.2% retracement of 1.3793 to 1.2412 at 1.2940 will be the first sign of completion of the correction and will turn focus back to 1.3793 key resistance.
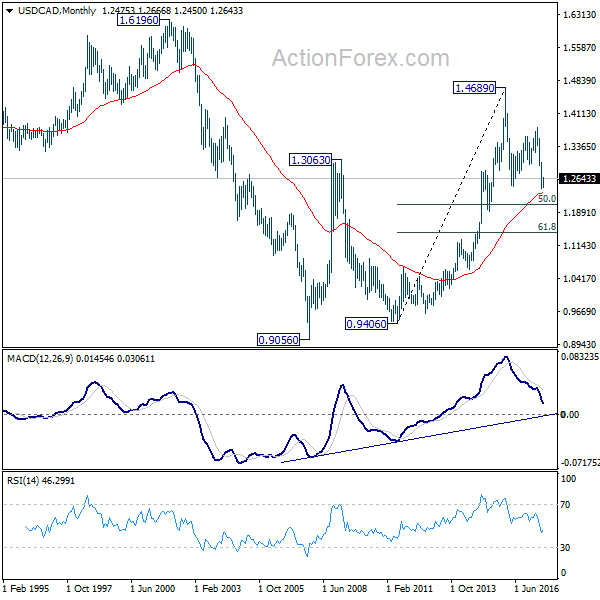
In the longer term picture, rise from 0.9056 (2007 low) is viewed as a long term up trend. It's taking a breath after hitting 1.4689. But such rise is expected to resume later to test 1.6196 down the road. But firm break of 50% retracement of 0.9406 to 1.4869 at 1.2048 will raise doubt over this view.
Eco Data 8/11/17
[php_everywhere] [/php_everywhere]
Eco Data 8/9/17
[php_everywhere] [/php_everywhere]
Eco Data 8/8/17
[php_everywhere] [/php_everywhere]
Eco Data 8/7/17
[php_everywhere] [/php_everywhere]
Eco Data 8/10/17
[php_everywhere] [/php_everywhere]
Summary 8/7 – 8/11
Monday, Aug 7, 2017
[php_everywhere] [/php_everywhere]
Tuesday, Aug 8, 2017
[php_everywhere] [/php_everywhere]
Wednesday, Aug 9, 2017
[php_everywhere] [/php_everywhere]
Thursday, Aug 10, 2017
[php_everywhere] [/php_everywhere]
Friday, Aug 11, 2017
[php_everywhere] [/php_everywhere].
Weekly Economic and Financial Commentary
U.S. Review
Labor Market Dodges Summer Slowdown
- Flat June readings for real spending and headline PCE inflation capped a ho-hum first half for the consumer and price growth.
- Both of the ISM surveys pulled back in July, with a particularly sharp slowdown in the non-manufacturing index. Despite the softer numbers, the indices remain at a level consistent with economic growth of 2.0-2.5 percent.
- The labor market exhibited continued strength in this morning's employment report. Nonfarm payrolls rose by 209,000 in July, the unemployment rate dropped a tick and wage growth improved over the month.
Labor Market Dodges Summer Slowdown
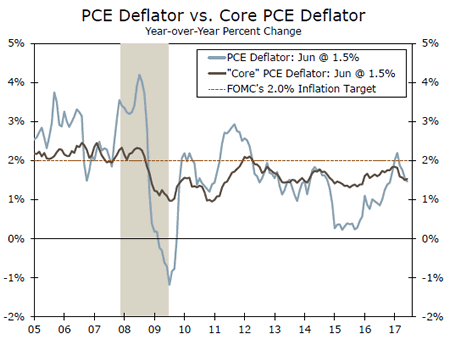
Personal income and spending kicked off the week with a somewhat underwhelming print. Personal income was flat in July despite expectations for a 0.4 percent gain. The headline miss masked a quirk in the details, however, as much of the decline was due to a sharp fall in farm income. Wages and salaries increased a solid 0.4 percent. Real spending rose 0.1 percent on the month and at a 2.6 percent annualized rate in all of Q2, an acceleration from the 1.9 percent pace registered in Q1. Soft price growth in Q2 helped boost the inflation-adjusted numbers. In nominal dollars, the three-month annualized rate was just 3.1 percent in June, the lowest since March 2016. Headline and core inflation, as measured by the PCE deflator, are now half a percentage point below the Fed's target (top chart).
The total value of construction put-in-place unexpectedly fell to a seasonally adjusted annual rate of $1,205.8 billion in June. Private construction spending registered its third straight monthly decline, and public spending also tumbled in June, slipping 5.4 percent. Rising construction labor and material costs may be creating some headwinds in the industry. The producer price index (PPI) showed nonresidential input prices increasing 2.3 percent in June, and the three-month annualized rate was up a robust 13.2 percent, suggesting more upward momentum in input prices.
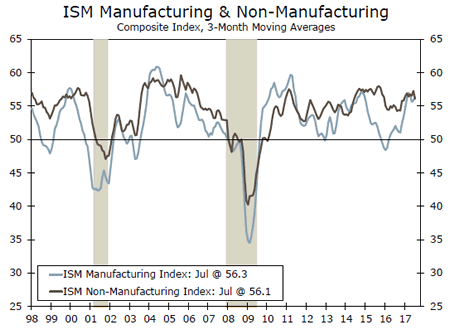
The ISM indices signaled a somewhat slower pace of growth in July than they had in recent months. On the manufacturing side, the pullback was modest, as the index slowed 1.5 points from June's level. Of the 18 manufacturing industries, 15 reported growth, and the survey respondents' comments were generally upbeat. Looking through the month-to-month volatility, our outlook for the factory sector has largely remained unchanged: slow but steady improvement in industrial production compared to last year.
On the services side, the slowing in the ISM index was a more precipitous 3.5 point drop t0 53.9. The decline was broad-based, with the steepest drop coming from the forward-looking new orders index. Respondent comments were mixed, with some purchasing managers citing a summer slowdown that they expect to fade in the coming months. On a three-month moving average basis, both indices are hovering just above 56, a level consistent with the 2.0-2.5 percent growth we have penciled in for the second half of the year (middle chart).
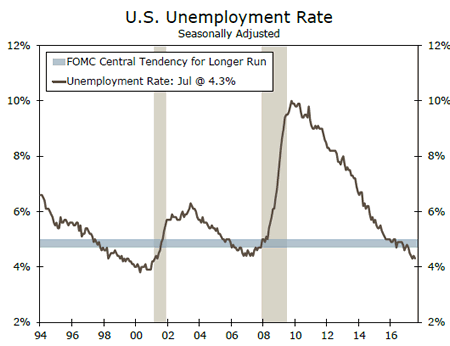
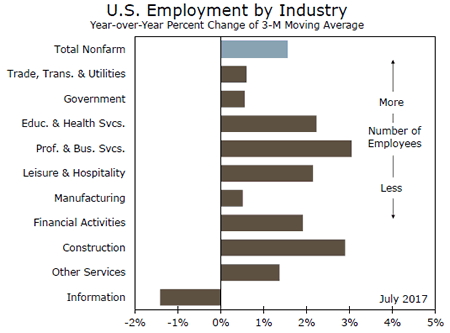
Employers added 209,000 net new jobs in July, above the consensus expectation for a 180,000 gain. The details of the report were just as strong as the headline number suggests. Manufacturers added a solid 16,000 new jobs, and education & health and professional & business services remained the drivers of job growth. Average hourly earnings rose 0.3 percent over the month and 2.5 percent over the year. In addition, the labor force participation rate rose a tick to 62.9 percent while the unemployment rate fell an equal amount. If wages accelerate a bit more in the coming months, the Fed will be well positioned to resume hiking the fed funds rate in December.
U.S. Outlook
Consumer Credit • Monday
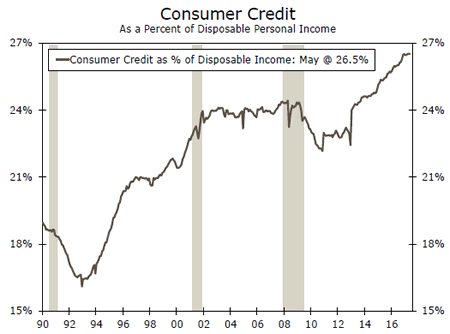
Consumer credit rose $18.4 billion in May which was the largest increase seen so far in 2017. Revolving credit, which includes credit cards, led the acceleration in May, while the increase in nonrevolving loans, which mostly consists of motor vehicle and education loans, held steady. Interest rates also continued to drift higher in May for credit card and auto loans.
Consumer credit as a share of disposable income held steady at 26.5 percent in May, as disposable income rose 0.4 percent that month. Disposable personal income was flat in June, however, which suggests that measure could jump if credit continues to rise. Spending was also soft in June, which raises the possibility that consumer credit growth also may have slowed, although it would not take much of an increase to push the ratio of credit to income to an all-time high.
Previous: $18.4B Consensus: $16.0B
JOLTS • Tuesday
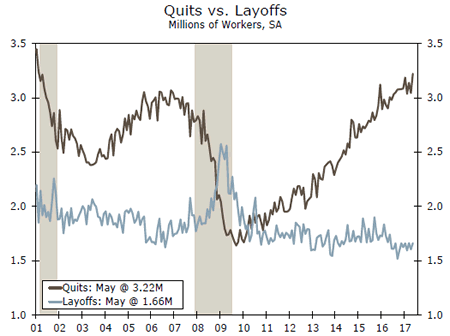
Details underlying June's strong job gain of 231,000 jobs should shed some light on the outlook for stronger wage gains in coming months. The JOLTS report in May showed a large increase in hiring while the number of openings fell; while that runs slightly counter to the softer jobs report in May, it is useful to note that hiring and openings in the JOLTS report are measured at the last day of the month. The faster pace of hiring was picked up in the June jobs report.
There was also a large increase in the number of quits in May, which may translate into stronger wage gains if sustained in coming months. Wage growth has been stubbornly subdued this year considering how low the unemployment rate has fallen. As more experienced workers quit their jobs for new opportunities, it should put upward pressure on wages.
Previous: 5666K
Consumer Price Index • Friday
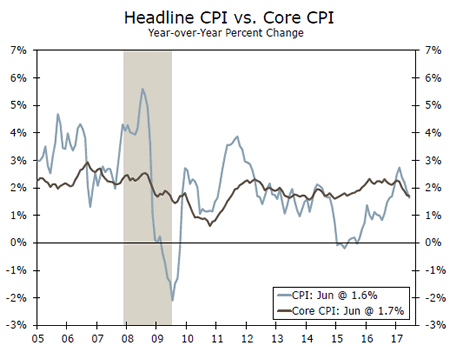
Consumer prices were flat in June, extending the soft patch for inflation indicators. The consumer price data have shown that consumers paid less on a range of products and services in recent months, from home furnishings to cell phone plans. Lower gasoline prices have also been a boon to consumer wallets. However, the extra spending power appears to have had little effect on consumption decisions. Personal spending growth slowed in Q2 relative to Q1, and was flat on an inflation-adjusted basis in June.
Headline and core CPI are slipping farther from the Fed's 2 percent year-over-year growth target. Inflation and wages have put the Fed in a tough position, and the continued miss on price growth indicators caused us to push back our call for the third rate hike this year to December.
Previous: 0.0% Wells Fargo: 0.2% Consensus: 0.2% (Month-over-Month)
Global Review
Solid Global Growth in Q2
- The year-over-year rate of real GDP growth in the Eurozone rose to a six-year high of 2.1 percent in Q2, while Mexico posted another solid quarter of growth on a sequential basis. It appears that the Japanese economy also had a good quarter in Q2.
Q3 Looks to Be Off to a Good Start in Many Economies
- Recent indicators suggest that the German economy entered Q3 with a fair amount of momentum, while PMIs in the United Kingdom and China remained well above the demarcation line separating expansion from contraction in July.
Solid Global Growth in Q2
There was more evidence this week that global economic growth was solid in Q2. For starters, real GDP in the Eurozone grew at an annualized rate of 0.6 percent in Q2, which lifted the year-overyear growth rate to a six-year high of 2.1 percent (see chart on front page). In Mexico, real GDP jumped 0.6 percent (not annualized) in Q2, which followed the 0.7 percent gain registered in Q1.
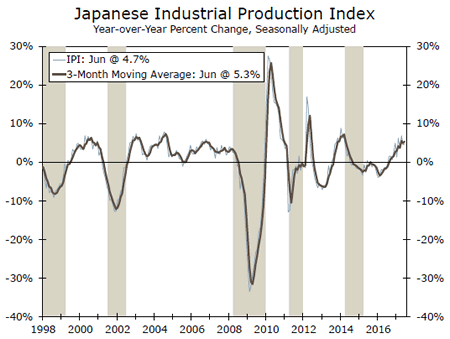
We will not have Q2 GDP data from Japan until Aug. 14, but industrial production (IP) rose 1.6 percent in June relative to the previous month. Looking at Q2 in its entirety, IP grew at an annualized rate of 7.7 percent on a sequential basis. The strong IP data (top chart) give us more confidence that our projection of 1.7 percent annualized growth in Japanese GDP in Q2 is realistic.
Q3 Looks to Be Off to a Good Start in Many Economies
There are not many data releases from Q3 yet, but the data that we do have suggest that Q3 has gotten off to a good start in many foreign economies. In Germany, retail sales rose 1.1 percent on a sequential basis in June, which follows on the heels of the 0.5 percent gain registered during May. Although these data points are from Q2, they indicate that retail spending came into Q3 with a fair amount of momentum. Factory orders rose 0.8 percent in Q2 relative to Q1, pointing to strong growth in manufacturing production in Q3.
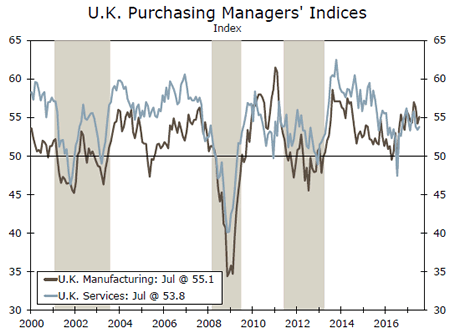
If the purchasing managers' indices are a good indication, then the British economy also got off to a decent start in Q3. The manufacturing PMI rose to 55.1 in July from 54.2 in June, while the service sector PMI edged up to 53.8 (middle chart). Despite the continued solid readings in the PMIs, the Monetary Policy Committee (MPC) at the Bank of England kept its main policy rate unchanged at 0.25 percent, where it has been maintained since last August. The decision was widely expected.
Real GDP in the United Kingdom was up only 1.7 percent on a year-ago basis in Q2 2017, and the MPC said that it expects growth will remain "sluggish in the near term as the squeeze on households' real incomes continues to weigh on consumption." Although the MPC expects that inflation will remain above its 2 percent target for the foreseeable future, the MPC appears to have a relaxed attitude to the overshoot. Most members of the MPC reason that a rate hike now would lead to even slower economic growth. As we detailed in our recent report, we expect that the MPC will keep policy unchanged until well into 2018. (See "U.K. Mid-Year Economic Outlook", which is posted on our website.)
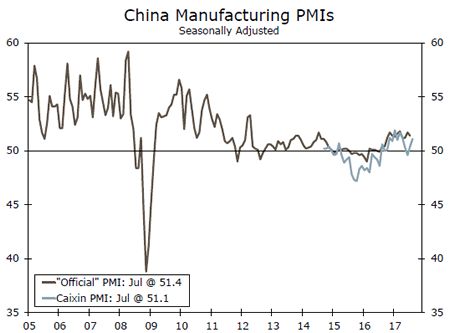
Real GDP in China was up 6.9 percent on a year-ago basis in Q2, and the PMIs for July suggest that growth remains solid in the current quarter. The Caixin manufacturing PMI rose to 51.1 (bottom chart). Although the "official" PMI edged down last month, it generally remains well within expansion territory. See "China Mid-Year Economic Outlook" for more details on our China forecast through the end of 2018.
Global Outlook
Germany Industrial Production • Monday
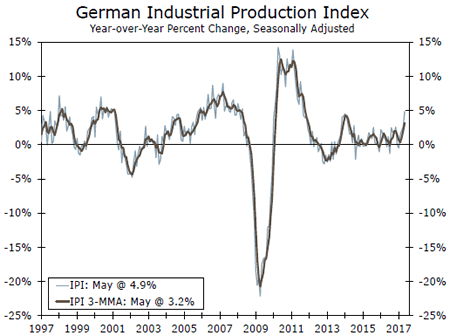
After hitting a series' high of 59.6 in June of this year, Germany's Markit/BME Manufacturing PMI slowed down marginally in July, to 58.1, and reversed a seven-month upward trend for the index. However, the index remained strong and continued to point to a relatively strong German economy.
On Monday, markets will have an opportunity to validate the strength in industrial production reflected by the already released PMI index for June when the industrial production index for June is released.
On docket for release on Tuesday will be the trade and current account balances for June. Clearly, one of the reasons for the improved economy has been an improved export market for German production so the international trade numbers will also help validate the improvement in economic activity.
Previous: 1.2% Consensus: 0.2% (Month-over-Month)
U.K. Industrial Production • Thursday
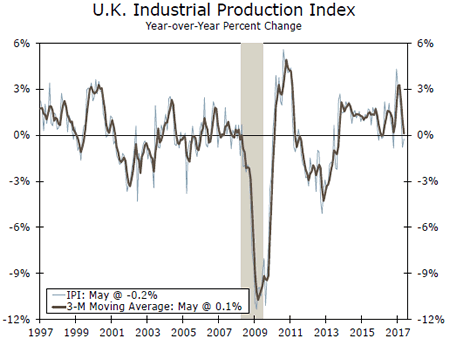
The U.K. economy has weakened a bit recently even though we are not expecting a downturn any time soon (See "U.K. Mid-Year Economic Outlook", which is available on our website). On Thursday, we will take a look at the industrial production index which declined 0.1 percent in May and consensus is expecting to come in flat for June. On a year-earlier basis the index dropped 0.2 percent in May and the expectation is for the index to continue its decline at a rate of 0.1 percent. Meanwhile, consensus expects manufacturing production to rise 0.1 percent in June, compared to a decline in May by 0.1 percent. On a year-earlier basis however, consensus expects the manufacturing industry to have slightly improved to 0.6 percent in June from a growth rate of 0.4 percent in May.
We will also get the NIESR monthly GDP proxy for July on Thursday. The index increased 0.3 percent in June after a 0.2 percent print in May.
Previous: -0.1% Consensus: 0.1% (Month-over-Month)
Mexico Industrial Production • Friday
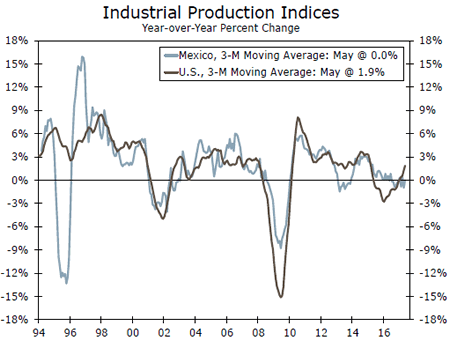
Mexican economic growth has surprised this year as some of the worse predictions regarding U.S. policy changes toward Mexico have not materialized. However, growth remains subpar for the growth needs of the country.
On Friday, markets will have a chance to take a look at industrial and manufacturing production for June, perhaps the first month in 2017 that we could say that the number will be devoid of any important "calendar" factor.
What markets will be looking for is an improvement in manufacturing production of automobiles, which has been lagging the rest of the manufacturing and industrial sector. This will also be a good indicator of the direction of automobile demand north of the border, which has eyebrows rising lately in the U.S. consumer market.
Previous: 1.0% (Year-over-Year)
Point of View
Interest Rate Watch
Inflation Dynamics at the Micro Level.
The pattern in this economic expansion is one of lower unemployment rates from 2010 to late 2015 and yet the inflation rate slowed over that same period. Only in the last year has inflation, the CPI, risen while the unemployment rate continued to decline and yet the pace of inflation remains modestly below the FOMC's 2 percent target. The traditional thinking about a tradeoff hypothesis of these two series has not played out. Why?
An Alternative Model
Our approach is to follow the path of micro foundations of the inflation process. In this case, inflation drives wage negotiations, or more precisely, changes in inflation are the driver for changes in wages. In addition, wages must reflect the value of the marginal product of workers—that is, this value depends upon the marginal product of the worker and the value of the output as measured by the price of that output.
Wages have tracked the path of inflation and productivity since 1982. This pattern reflects the underlying micro foundation that wages track the combination of productivity and inflation gains. A firm cannot pay their workers a salary in excess of their productivity and the value (price) of the output they produce. Public discussion often starts by arguing for higher wages but there is little discussion of the underlying drivers of inflation and productivity.
An Alternative View of Monetary Policy
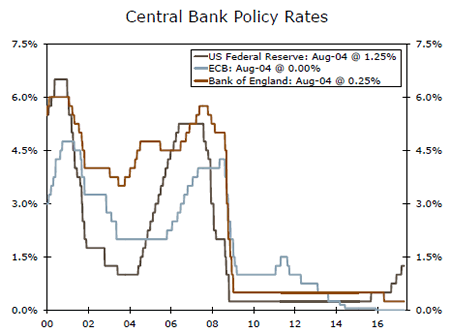
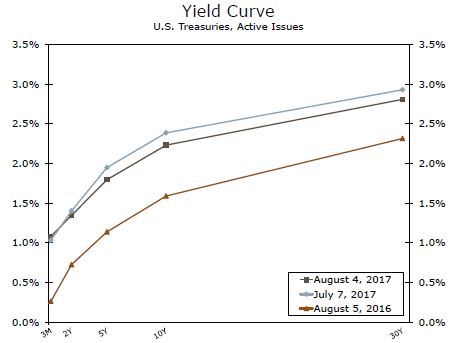
For investors, the challenge is that interest rate expectations based upon Fed policy take into account a policy expectation that a lower unemployment rate will generate higher inflation. To date, the rise in inflation is less than what would be expected based upon a traditional model of the inflation process and thereby the extent of the increase in interest rates remains above what would be the result of our alternative model. Our alternative approach continues to indicate interest rate increases on the low side of consensus and that has been the right forecast for the past four years.
Credit Market Insights
Auto Loan Market in Distress?
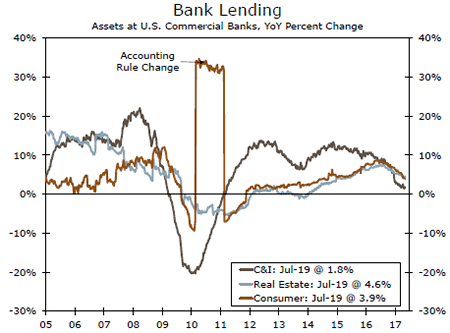
The rate of new seriously delinquent auto loans has climbed for 13 consecutive quarters and reached 2.3 percent in Q1. The rate of these new seriously delinquent loans is still below its recession peak of 3.5 percent. The total value of the loans stands at $8.3 billion, just below the recession peak.
Low rates and an improving economy since 2008 fueled a vehicle sales boom, financed with increasingly more debt. Furthermore, rising auto prices, stagnant real incomes and yield-hungry investors contributed to loan quality deterioration. The average auto loan maturity climbed sharply to 67.4 months in May from 59.5 months in 2009. In addition, outstanding subprime loan balances have ballooned to an all-time high of $280 billion, and the pronounced worsening in subprime loan performance has been responsible for much of the overall rise in auto loan delinquencies.
How much of a threat is the auto loan market to households and to the broader financial system? Auto loans are only 9.2 percent of household debt, and pale in comparison to the size and level of securitization of the mortgage market, the origin of the last financial crisis.
Furthermore, the July Senior Loan Officer Opinion Survey reported a fall in auto loan demand and an increase in the percentage of banks tightening standards for auto loans. As the economic recovery continues to grind along, the auto loan market is certainly worth monitoring.
Topic of the Week
Three Hurdles to 3 Percent Growth
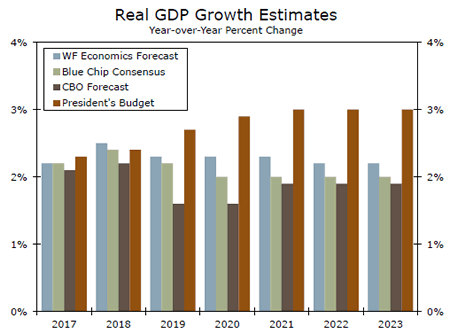
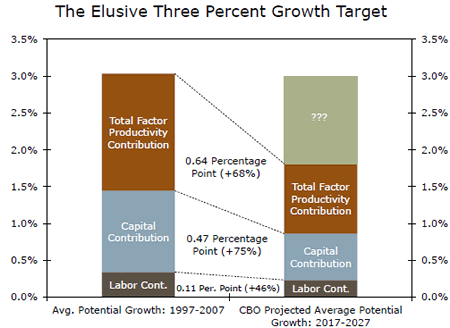
President Trump's 2018 budget assumes uninterrupted increases in the pace of economic growth during each of the next three years before real GDP growth levels out at 3 percent for every year thereafter. Our own forecast is less sanguine, as are those of the Congressional Budget Office and the Blue Chip consensus (top chart).
While it is true that real GDP growth has averaged 3.2 percent per year since 1950, that average is skewed by much higher growth rates in the early part of that period. For more than a generation, 3 percent real GDP growth has been much tougher to achieve on a sustained basis. Since 1970, average annual GDP growth has been 2.7 percent. Since 2000, it is just 1.9 percent.
The economy's long-run sustainable rate of economic growth is driven by three factors: labor, capital and total factor productivity (TFP). Relying on just one of these inputs to achieve 3 percent growth over the next decade would require unrealistically rosy assumptions. For example, reaching three percent potential growth through labor alone would require potential labor hours growth in the neighborhood of the rates achieved during the period when mass inflows into the labor force occurred from baby boomers and women.
Getting all three inputs moving in the right direction at once is challenging, but the bottom chart illustrates what it might look like by comparing current projections with the most recent decade over which potential growth averaged 3 percent. As the chart shows, replicating the 1997-2007 period would be a difficult task, as this past period included a major technological revolution and boomers in their prime working years.
None of this is to say that the economy could never grow at such a strong pace again, but history has shown that all three of these factors tend to change at a slow pace, which suggests long lead times before new policies could achieve the fleeting objective of 3 percent growth.
The Weekly Bottom Line
U.S. Highlights
- U.S. stock indices remained supported by the continued flow of favorable earnings releases. Bond yields and the U.S. dollar moved lower through Thursday but that dynamic reversed course with the robust payrolls report.
- The American economy continued to churn out jobs at a robust pace in July with payrolls rising by 209k. At the same time, the unemployment rate fell to a cycle low of 4.3%. Average wages rose a solid 0.3% m/m.
- Improvements in ISM manufacturing and non-manufacturing prices sub-indices, together with a slightly firmer core PCE price index suggest that a turnaround in inflation may be underway.
Canadian Highlights
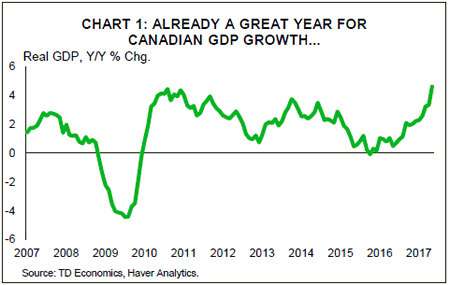
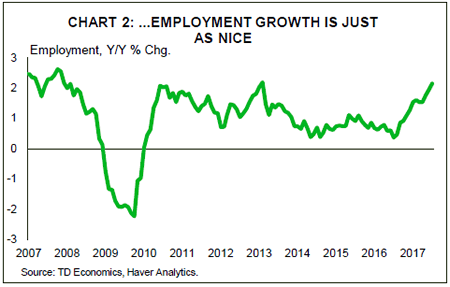
- Whatever happens over the remainder of the year, 2017 will go down as a very good year for the Canadian economy. In July, the economy created 10.9k jobs and the unemployment rate fell to 6.3%, its lowest level since 2008.
- Even if economic growth is flat and no more jobs are created over the remainder of the year, real GDP will have grown by 2.5% (annual average) in 2017 and the economy will have created 290k jobs - the highest in a decade.
- With household debt levels at record highs, interest rates going up and home prices looking to decelerate further, economic growth is likely to return to a less exciting pace around 1.5% to 2.0% in 2018. This is still close to a trend rate for an economy with an aging population and limited productivity growth.
U.S. - Job Numbers Impress, But Still Waiting on Inflation
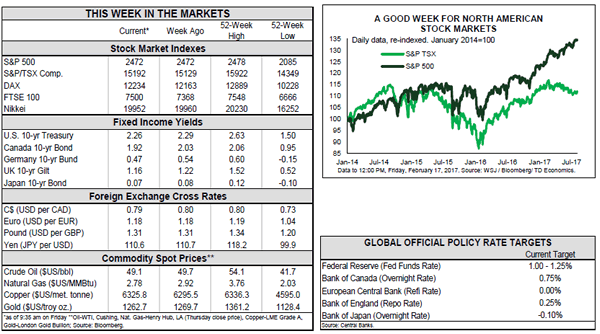
It was another good week across most markets. U.S. stock markets remained supported by continued flow of favorable earnings releases, with the DJIA breaching the 22,000 threshold by mid-week. A string of softer data releases through Thursday also led bond yields and the U.S. dollar lower. But that ended Friday morning, when a solid employment report boosted the dollar and inspired a bit of a sell-off in the bond market.
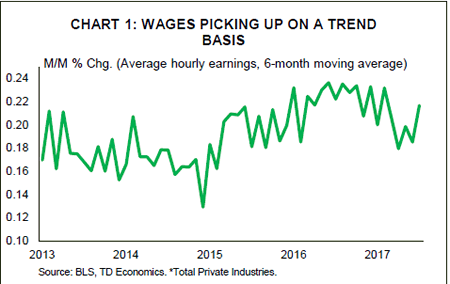
The report was indeed a beauty as the American economy continued to churn out jobs at a robust pace in July, with payrolls rising by 209k, beating market expectations for a 180k print. But there was more. The jobless rate dropped to a cycle low of 4.3%, while broader measures of labor underutilization remained near their pre-recession lows. More workers joined the labor force, with the participation rate recording a small uptick to 62.9%. While average wages failed to accelerate on a year-over-year basis, given the weakness at the beginning of the year, the monthly gain of 0.3% was very strong and marks the fastest pace in ten months. (Chart 1)
Going forward, we expect job gains to slow somewhat. However, the trend should also be accompanied by stronger wage gains. While the relationship between labor market slack and inflation has become more muted in recent years, and is taking longer to materialize, we believe the link still holds. As such, we believe that a pick-up in inflation should materialize before the end of the year, with the stronger data motivating the Fed to take interest rates higher.
A string of other data releases helped provide additional context as far as far as economic momentum heading into the third quarter. Personal spending rose by a meagre 0.1% in June, with the softness providing somewhat of a weak handoff to consumer spending into the third quarter, while personal income was essentially flat on the month. However, much of the slowdown in personal income was related to decreases in personal dividend and interest income, factors that are likely to prove temporary. On the other hand, growth in wages and salaries was a solid 0.4% m/m and looks to be strong in July also given the average hourly wage data. The strengthening in income growth, together with the relatively healthy auto sales figures for July, suggests that consumer will continue driving economic growth in the third quarter, with consumption expected to rise by 2.6%, supporting real GDP growth of 2.8% during the quarter.
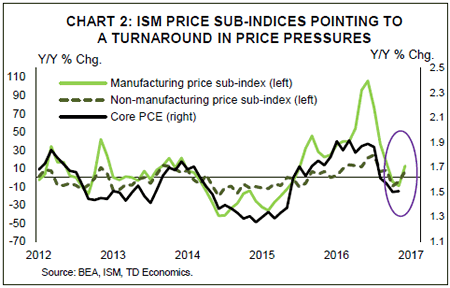
The ISM surveys provided mixed signals of the economy. The manufacturing index suggested that the sector continued to expand at a healthy, but slightly slower pace, supported by a rebounding global economy and the lower U.S. dollar. The non-manufacturing index also telegraphed a deceleration in activity, but remained in expansionary territory while most industries continued to report growth. Importantly, both ISM surveys indicated significant increases in their prices sub-indices. Together with a slightly firmer core PCE price index, which was revised up to 1.5% y/y in June this suggests that a turnaround in price pressures could be underway (Chart 2). Should this in fact be the case, we expect further tightening to take place later this year, with the Fed likely to slip in a December hike. Lack of such evidence, on the other hand, will likely stay the Fed's hand as far as the hike, but is unlikely to prevent the Fed from starting the balance sheet unwinding process in the fall.
Canada - 2017 Belongs to Canada
Whatever happens over the remainder of the year, 2017 will go down as a very good year for the Canadian economy. Even if economic growth is flat and no more jobs are created, real GDP will have grown by 2.5% (annual average) and the economy will have created 290 thousand jobs - the highest in a decade.
Two phenomena explain the buoyant pace of Canadian growth over the first half of the year. First, a bounce back in energy production after setbacks over the past two years explains about a quarter of the growth. This far exceeds its share in overall economic activity (of around 6.5%).
Second, consumer spending growth has been absolutely gangbusters. Given our tracking for the second quarter, consumer spending over the first half of the year looks to have advanced by over 4%, its fastest pace since 2007. Spending on durable goods - especially autos - led the way, but there was little weakness to point to anywhere.
The Canadian economy may not slow to a halt over the remainder of the year, but is likely to cool some from its fiery pace over the first half. The best metaphor for the rebound in the energy sector is a spring that had been pushed down by the fall in prices and then pushed a bit harder by the Alberta wildfires. It has now bounced back. With the outlook for oil prices relatively stable over the next year, activity is likely see a much steadier pace of growth.
Meanwhile, consumer spending, which has been supported in part by wealth gains from outsized advances in home prices and steady gains in equities through 2016, will not get the same support going forward. The TSX composite index peaked in the first quarter of this year and has lost ground since. And, no surprise to anyone, home price growth has slowed considerably, especially since new regulations have come online in Ontario.
With debt levels at record highs, interest rates going up and home prices looking to decelerate further, there is good reason to expect consumers to rein in spending over the remainder of the year. Reining in spending doesn't have to mean a pullback, as strong job gains have also boosted aggregate incomes, but the days of 4% consumer spending growth are likely behind us.
This likely slowdown in Canadian economic activity has important implications for the Bank of Canada. It raised rates in July largely on the pace of growth observed over the first half of the year. But, with 2017 now halfway to the finish line, the story is the outlook for 2018.
In all likelihood, economic growth will return to a less exciting pace around 1.5% to 2.0%. This is still close to a trend rate for an economy with an aging population and scant productivity growth, but not a rate that is likely to put much upward pressure on inflation. With a smaller growth potential comes a smaller margin of error. Given the continued downside risks to the Canadian economy, any disappointment on this front may be enough to put the Bank of Canada back on the sidelines.
U.S.: Upcoming Key Economic Releases
U.S. Consumer Price Index - July
Release Date: August 11, 2017
Previous Result: 0.0% m/m; core 0.1% m/m
TD Forecast: 0.1% m/m,; core 0.1% m/m
Consensus: 0.2% m/m; core 0.2% m/m
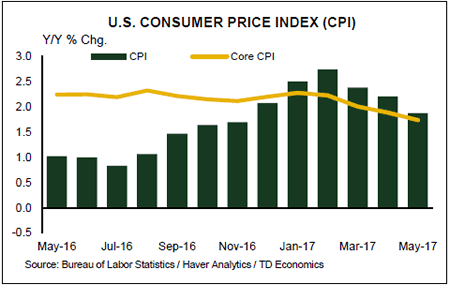
Headline CPI inflation is expected to pick up to 1.7% y/y in July, with prices up 0.1% m/m. Energy prices were likely a small drag on lower gasoline prices while we look for food prices to offset. Outside of food and energy, we expect yet another subpar 0.1% gain in the core, keeping the core inflation rate stable at 1.7% y/y. Risk for a continued drag from wireless services, vehicles and apparel prices suggest that a 0.2% print may be hard to reach this month. If realized, our core inflation projection suggests that transitory factors continue to weigh, offering limited signs that price pressures are regaining steam and potentially spurring greater caution at the Fed with respect to rate normalization.
Canada: Upcoming Key Economic Releases
Canadian Housing Starts - July
Release Date: August 8, 2017
Previous Result: 213k
TD Forecast: 205k
Consensus: N/A
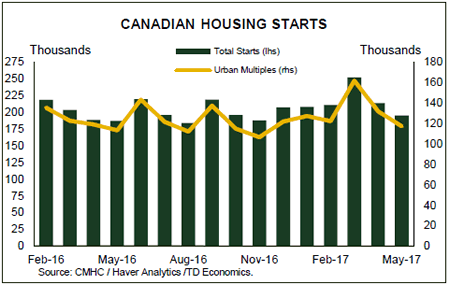
Housing starts are forecast to slow to a 205k pace in July, reversing some of the pickup from the prior month. While we have less conviction without building permits for June, the magnitude of last month's rebound in construction activity seems unwarranted given languishing resale activity. As usual, we expect the more volatile multi-unit component to drive the headline result while single family housing starts should remain stable around 65k. Our forecast for 205k reflects a modest deceleration from the six-month moving average, currently 215k.
Week ahead – US CPI; RBNZ Meeting; OPEC/Non-OPEC to Monitor Cuts
Next week will be calmer in terms of data releases relative to this one, though certain figures from major economies will definitely grab the markets participants' attention. In terms of central bank meetings, the Reserve Bank of New Zealand will meet to set monetary policy, while oil prices may experience added volatility given that a meeting to monitor compliance with output cuts will be taking place in Abu Dhabi.
RBNZ decision on monetary policy
The Reserve Bank of New Zealand will be announcing its latest decision on monetary policy next week. The Bank's official cash rate currently stands at the record low of 1.75%. During this past week, the country has been on the receiving end of weaker-than-expected employment figures. These contributed to the kiwi's fall from the more than two-year highs it experienced last week relative to the greenback as kiwi/dollar rose climbed the 0.75 handle. It would be interesting to see whether those figures will push any policy normalization plans further down the road.
Out of Asian markets, potentially of most interest would be July trade data out of China given that the world's second largest economy traditionally relies on exports to boost growth. Imports are also of significance given the growing importance of consumer demand as the nation is attempting to rebalance its growth model to one that's more heavily dependent on domestic demand. Beyond this, July inflation and producer prices would also be of interest to investors. Moving to Japan, it will, among others, see the release of current account numbers and machinery orders for June.
Europe in broadly quiet mode
Next week looks like it will not be particularly exciting in terms of European releases. The Sentix index gauging investor confidence in the eurozone for the month of August could attract some attention by forex market participants. Beyond that, of most interest in Germany, Europe's largest economy, would be June industrial output and trade data, as well as final inflation numbers for the month of July.
Sterling received a blow this week as markets interpreted the Bank of England's monetary policy decision, meeting minutes and quarterly inflation report as being on the dovish side overall. Consequently, sterling tumbled relative to majors including the dollar and the euro - more notably versus the latter one as euro/pound rose to a nine-month high above the 0.90 handle. Next week will see the release of Halifax house prices for July, as well as industrial and manufacturing output figures for the month of June. It remains to be seen whether any positive surprises have the capacity to reverse the negative backdrop that seems to have set in for the pound.
JOLTS report and inflation numbers out of the US
Earlier in the week, June consumer credit and the JOLTS report on jobs openings for the same month will be gathering most attention. On Wednesday, preliminary labor costs and productivity numbers for the second quarter of the year will dominate investors' focus. Finally, producer prices and CPI data will be closely watched on Thursday and Friday respectively. It remains to be seen whether the weaker dollar in recent weeks will spur inflationary pressures and bring the Federal Reserve closer to delivering a rate hike during its December meeting. Expectations are for inflation to rise to 1.8% year-on-year in July, up from 1.6% during the previous month.
Diverting from forex markets, officials from OPEC and non-OPEC countries participating in the deal to reduce production by about 1.8 million barrels per month will be meeting in Abu Dhabi on August 7 and 8 to discuss ways to boost compliance with their supply cut agreement. Similar discussions during a meeting in the Russian city of St. Petersburg in late July led to oil prices rallying.