
Sample Category Title
Canada’s Economy Continued to Create Jobs in July
Highlights:
- Employment growth met expectations with an 11k gain July following an impressive 100k increase over the previous two months.
- July's increase entirely reflected higher full-time employment while part-time jobs fell. Of the 388k jobs added over the last year, more than 90% have been full-time positions.
- Manufacturing jobs rose 14k with employment in the industry now up 3% from a year ago, the best pace since 2012. Gains in the service sector were led by wholesale and retail employment
- Ontario led the provinces with employment up 26k in July.
- The unemployment rate fell 0.2 percentage points to a cycle-low of 6.3%. Broader measure of unemployment that include discouraged workers also declined.
- Wage growth remained weak but edged up to 1.2% from 1.0% in the previous month. Wage measures from other surveys are showing year-over-year growth above 2%.
Canadian employment rose consistently over the first half of the year and last month was no different with 11k jobs added in July. The average monthly increase of 28k year-to-date is well above the pace needed to absorb new entrants into the labour force, pushing the unemployment rate down to 6.3% in July from 6.9% at the end of last year. Strong job gains are consistent with above-trend growth in the economy. We are monitoring a 3.7% increase in Q2 GDP, which would match the previous quarter's gain and make Canada the growth leader among its G7 peers. And low unemployment at the national level supports the Bank of Canada's expectation that slack in the economy will be absorbed later this year. That should keep the central bank in tightening mode. We expect they will follow up on July's rate increase with another hike in October. Inflation developments will be important in dictating the pace of rate increases thereafter. Today's employment report showed that wage growth remains subdued despite tight labour market conditions. Lack of inflationary pressure will likely prevent the BoC from acting aggressively to remove accommodation.
U.S. Labour Markets Continue to Record Solid Gains in July
Highlights:
- Payroll employment rose 209k in July. That was above an expected increase of 180k and built further onto June's solid 231k gain.
- The increase in July payrolls was less reliant on government employment which rose only 4k after the 37k surge in June which resulted in private employment strengthening to 205k from June's rise of 194k.
- The household survey indicated an even greater employment gain of 345k which contributed to the unemployment rate dropping to 4.3% from 4.4% in June.
- The annual increase in average hourly earnings remained unchanged at June's rate of 2.5%.
The robust 209k increase in July payrolls is indicative of firms experiencing sufficiently strong demand to remain confident about taking on new workers. This in turn is helping to send the unemployment rate lower to 4.3% in July. Tightening labour markets had been putting upward pressure on wage inflation through 2015 and 2016. However, data so far this year, including today's data for July, show wage gains flattening out at around 2 1/2% which matches the 2016 increase and compares to increases of 2.3% and 2.1% in 2015 and 2014, respectively. Confirmation that labour markets are approaching full employment is expected to warrant the Fed continuing to withdraw current stimulative monetary conditions. Though tightening labour markets will eventually return wage inflation to an upward trend, in the interim, the absence of wage pressure will keep the pace of tightening gradual. Our forecast assumes one further 25 basis point hike in fed funds this year with similar hikes in each of the four quarters of 2018. This modest rise in official rates is expected to be paired with the Fed starting to gradually shrink its balance sheet starting in October.
Export Strength Leads Trade Deficit to Narrow to the Smallest Level Since US Election
The U.S. international trade deficit narrowed in May by $1.1 billion (bn) to $46.5 bn from the April figure of $47.6 bn (revisions to April were negligible). Consensus expectation was for the trade balance to narrow a bit more to -$46.2 billion.
Goods exports rose 0.2% m/m in May, driven higher by a surge in consumer goods (+5.6%) and automotive vehicles and parts (+4.9%). Although there were large declines recorded in foods, feed and beverage exports (-6%), and smaller declines in capital goods and industrial supplies, they were not material enough to offset strong gains in consumer and automotive exports. Exports of services rose 1.0% m/m in the month, the fastest pace yet for 2017.
Imports declined 0.1%m/m in May, driven down by declines in consumer goods (-2.9%) and automotive vehicles and parts (-2.4%). These declines were largely offset by gains in capital goods (+2.4%) and industrial supplies (+0.2%).
Adjusting for price changes, merchandise exports rose 1.0% m/m in May, ending the streak of consecutive monthly declines at three. Import volumes rose 0.1% m/m, similar in magnitude but the opposite direction of the nominal change.
As the headline figure suggests, the U.S. trade balance with its major trading partners narrowed on net in May. The trade deficit with the European Union widened a touch in May, as did deficits with China and Mexico. However, given the monthly volatility of trade data, more telling is the year-to-date balance relative to last year. This metric suggests that trade deficits with NAFTA members Canada and Mexico have widened considerably thus far in 2017; the trade deficit with Canada has widened by $7.7 bn, and by $3.8 bn with Mexico. Similarly the trade deficit with Europe widened by $2.9 bn, and with China by $6.9 bn. Lastly, the trade deficit with OPEC nations widened by $15.3 bn YTD compared with last year, consistent with much stronger oil imports.
Key Implications
The gain in export volumes was a welcome surprise after months of decline, but net-trade is unlikely to be a major source of growth for the U.S. economy. The weaker trade-weighted dollar and improved foreign demand environment should act to support U.S. exporters for the remainder of this year, but strong domestic demand should boost imports further, resulting in net trade exerting a small drag on 2017 economic activity.
Looking ahead, the uncertain global environment could still exert a material headwind to U.S. exporters. From domestic and global policy uncertainty to geopolitical events, risks to net trade will remain skewed toward the downside for some time.
Canada’s Trade Deficit Widens Further in June
Canada's trade deficit widened to $3.6 billion in June (from $1.4 billion in April), as exports fell 4.3%. Meanwhile imports edged up 0.3%.
The drop in exports comes after three months of consecutive record gains. Declines were fairly broad based, with shipments down in 9 of 11 sectors. Declines in unwrought gold and energy products were the biggest culprits. Year-on-year, exports are still up 12.4%.
The disappointment in June exports was partly due to lower prices for many commodities, but it wasn't the whole story in June. Export volumes were also down 1.7%. June.
On the import side, lower prices also depressed the headline, with import volumes up 0.8% in June. In nominal terms import gains were led by gold bullion, with imports of metal ores and non-metallic minerals up 39% on the month. Like exports, imports have also accelerated over the past year in line with generally better growth in the Canadian economy, and are up 10.4% year-on-year.
Canada's trade surplus with the U.S. narrowed further to $2.2 billion from $3.5 billion in May, registering the smallest surplus in a year. That came as a result of lower crude oil exports outweighing a drop in crude oil imports.
Key Implications
Despite the softness in exports in June, net trade is still expected to make a positive contribution to economic growth in Q2. The second quarter in Canada is likely to have seen a very healthy 3.5% annualized pace of GDP growth. However, growth is on track to slow to a much more sustainable pace in Q3 of below 2%, and a soft hand off on the export side from June is part of the story.
Looking ahead, the recent appreciation in the Canadian dollar has weakened Canada's competitive position slightly. But, healthy U.S. demand should continue to be supportive of exports.
With several sectors of the Canadian economy showing strength, and consistent with the change in tone ahead of their June rate increase, the Bank of Canada is likely to take rates another 25 basis points higher in the fall.
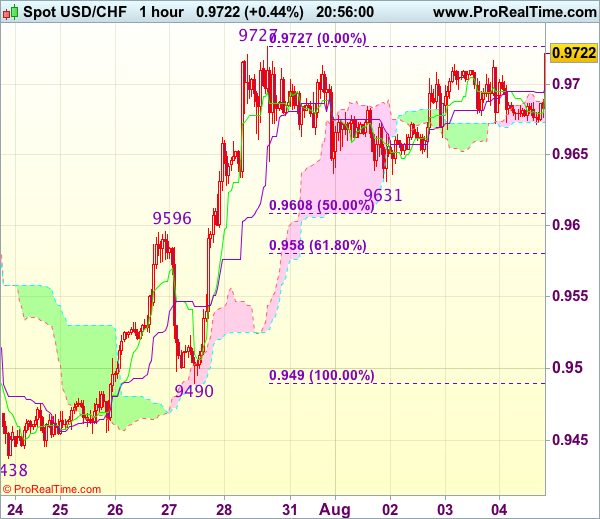
Trade Idea Update: USD/CHF – Buy at 0.9700
USD/CHF - 0.9734
Original strategy :
Buy at 0.9600, Target: 0.9700, Stop: 0.9565
Position : -
Target : -
Stop : -
New strategy :
Buy at 0.9700, Target: 0.9800, Stop: 0.9665
Position : -
Target : -
Stop : -
As the greenback has surged again in NY morning and broke above indicated resistance at 0.9727, adding credence to our bullish view that recent upmove is still in progress and upside bias remains for further gain to 0.9775 (50% projection of 0.9438-0.9727 measuring from 0.9631), however, near term overbought condition should limit upside to 0.9800-10 (61.8% projection) and reckon 0.9830-40 would hold from here, bring retreat later.
In view of this, would not chase this rise here and would be prudent to buy dollar on pullback as 0.9700 should limit downside. Below 0.9670-75 would defer and suggest top is possibly formed, risk test of support at 0.9631 but break there is needed to add credence to this view, bring retracement of recent rise to 0.9596 (previous resistance turned support).
US: The Job Market Beats Expectations Again
July was yet another solid month for the U.S. job market, with a healthy 209K net new jobs adding to an upwardly revised 231K gain in June. Revisions to the previous two months of payrolls added 2k positions.
Private payrolls rose by 205k, led by gains in food services and drinking places (+53K), professional and business services (+49K) and health care (+39K). Overall services sector hiring (+183K) accelerated in July, while the goods sector downshifted slightly (+22K), on slower gains in construction (+6k).
In the household survey, July job growth (+345K) outpaced a 349K gain in the labor force, taking the unemployment rate down slightly to 4.3%. More encouraging was an uptick in the participation rate to 62.9% from 62.8% in June. Broader measures of underemployment, such as the U-6 rate remained unchanged.
Wages perked up a bit in July, with a solid 0.3% gain in average hourly earnings. That left year-on-year wage inflation steady at 2.5% in July.
Key Implications
Once again job gains beat expectations. Job growth moderated only slightly from June to July, and the average over the past six months held steady around 180K. At this stage of the business cycle we would have expected job growth to have slowed further, so the durability of employment gains is impressive. That said, we still to expect monthly job gains to moderate in the coming months, as tight labor markets make new hires tougher to find (see our recent quarterly forecast). Unemployment is at a cycle low of 4.3%, and alternative measures of labor underutilization are also approaching pre-recession lows. That suggests that American workers are likely to get healthier raises in the months ahead.
As far as its full-employment mandate is concerned, the Fed is well justified in gradually removing monetary stimulus. It is the recent softness in inflation that has caused some consternation by FOMC members (see FOMC commentary). While the relationship between labor market tightness and inflation has weakened in recent years (see Dollars & Sense) it still exists, and inflation should pick up in the coming months, providing reassurance for the Fed.
The wild card now is Washington. By the end of September Congress needs to raise both the debt ceiling and pass stopgap funding legislation to prevent a government shutdown in October. If this process proves messy, it could roil financial markets, and potentially stay the Fed's hand from shrinking its balance sheet next month.
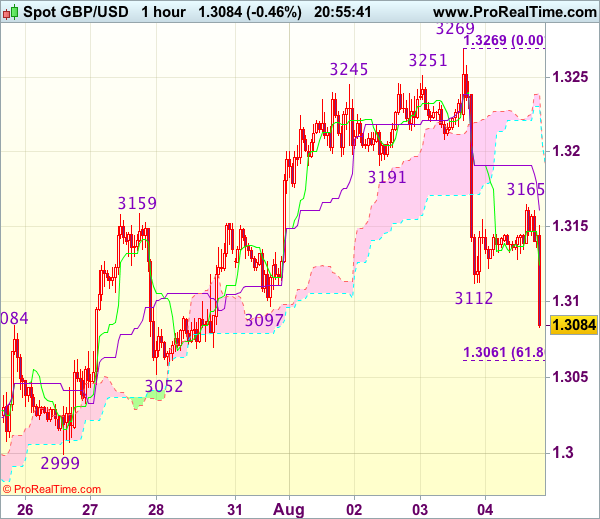
Trade Idea Update: GBP/USD – Sell at 1.3130
GBP/USD - 1.3078
New strategy :
Sell at 1.3130, Target: 1.3030, Stop: 1.3165
Position : -
Target : -
Stop : -
As cable met renewed selling interest at 1.3165 and has dropped sharply on dollar’s broad-based rebound, suggesting the selloff from 1.3269 top is still in progress and may extend weakness to 1.3062-61 (previous support and 61.8% Fibonacci retracement of 1.2933-1.3269), below there would bring further fall to 1.3025-30 but price should stay above support at 1.2999, bring rebound later.
In view of this, we are looking to sell cable on recovery as 1.3130-40 should limit upside. Only break of 1.3165 is needed to signal low is formed instead, bring a stronger rebound to 1.3200 but upside should be limited to 1.3240-50 and price should falter below said resistance at 1.3269.
Canadian Employment Gains Modestly in July
Canada added 10.9k net jobs in July. The unemployment rate ticked down to 6.3% (from 6.5%), a level last seen in 2008, as fewer Canadians were engaged in the labour market.
July marked a third straight month of full time job gains (+35.1k), while part-time work pulled back slightly (-24.3k). Gains were entirely among self-employed individuals (+13.2k), as 2.4k net employees were shed. Both public (+0.8k) and private sector (-3.2k) employment were largely unchanged.
Large swings were observed across industries. Among goods producers (+1.9k), agriculture (-10.0k) and construction (-9.1k) saw declines, while manufacturing (+13.7k) and natural resources (+8.0k) were up. On the services side (+9.0k), trade (+21.9k) and information (18.3k) were among the gainers, while educational services (-32.0k) and public administration (-10.3k) saw notable declines.
Regionally, it was Ontario that led the gain, adding 25.5k net positions, while Alberta (-14.4k) saw the largest pull-back in employment.
Hours worked were encouraging, up 1.9% year-on-year, the strongest gain in nearly 2 years. Growth in the hourly wage rate ticked up slightly, to 1.2% year-on-year.
Key Implications
Canada notched up an eighth straight month of job gains, but the details of the report were somewhat mixed. Notably, job gains were entirely attributable to self-employment, and although hourly wage growth ticked up again, it remains stubbornly weak. Even the drop in the unemployment rate was led by fewer Canadians looking for work, although some solace can be taken in that the decline appeared to be led by younger and older individuals, as 'core' working age participation remained solid.
On the plus side, the healthy gain in hours worked is encouraging, particularly in light of the weak gains that have characterized 2017 to date.
The Bank of Canada has clearly signaled a desire to further increase its monetary policy rate from its current, emergency level, and today's data will provide more justification to do so. We remain of the view that a further 25bp hike is likely at their October meeting, with a more gradual pace of hikes expected thereafter.
July: Non-farm Payroll (NFP) and CAD Employment Result
- US Jul Non-farm Payrolls +209k vs. +175ke
- US Unemployment falls to +4.3%, 16-Year Low
- US Jun Payrolls Revised to +231k; May Revised to +145k
- US Jul Labor-Force Participation Rate 62.9%
The U.S unemployment rate fell by a tenth to +4.3%, matching May as the lowest level of unemployment in 16 years. It declined despite an expansion in the labor force.
This suggests the growing labor market is slowly drawing more Americans off the sidelines and into the job search, and that employers are hiring many of them.
The number of Americans holding jobs or actively looking for work rose a tenth to +62.9%.
The more important average hourly earnings rose +0.3% m/m or +2.5% y/y – not stellar, but heading in the Fed's direction.
The drop in unemployment and wage gains brings the Fed back in play to hike rates again in December.
Treasury's prices are trading lower while the USD is starting off better bid.
Canada adds +10.9k jobs in July; unemployment rate falls to 9-year low
The Canadian economy added a net +10.9k jobs in July, in line with market expectations.
For the May-to-July period, Canada has added an average +36.9k jobs per month. On a year-over-year basis, Canadian employment has increased +387k, or +2.1%.
Note: Over 90% of the new jobs created over the past 12 months were full-time positions.
Canada's unemployment rate dropped to +6.3% in July.
Note: When using the U.S Labor Department methodology, Canada's jobless rate in July was +5.3%.
The Loonie is under pressure vs. the dollar, but performing better on the crosses.
Pound Slide Continues as US Nonfarm Payrolls Beats Expectations
GBP/USD has posted losses in the Friday session, continuing the downward trend seen on Thursday. In the North American session, the pair is trading at the 1.31 line, down 0.24% on the day. On the release front, there are no British events on the schedule. In the US, employment numbers were solid. Nonfarm payrolls slowed to 209 thousand, but easily beat the estimate of 182 thousand. Wage growth remained steady at 0.3% and the unemployment rate was unchanged at 4.3%.
The British pound reacted negatively on Thursday as the BoE cut its growth forecasts for 2017, from 1.9% in May to 1.7%, and for 2018, from 1.7% to 1.6%. As well, the bank sharply cut lowered its wage growth forecast for 2018, from 3.5% to 3.0%. The BoE held rates at 0.25%, but the minutes from the policy meeting were dovish, with MPC members warning that "GDP growth had been sluggish and was expected to remain so in the near term." The BoE's pessimistic message has dashed hopes of a rate hike before the end of the year, although the bank suggested that a slight improvement in growth could lead to a rate hike in 2018. BoE policymakers have publicly argued about monetary policy, and the vote at Thursday's meeting, 6 members favored holding rates, while only 2 members voted to raise rates. The British economy has slowed down, but the bank is reluctant to raise rates when inflation is running at 2.6%, well above the bank's target of 2%. To complicate matters, the Brexit talks have made little progress, raising fears of a messy exit from the EU, which could take a serious toll on the British economy. The City of London, a key European financial center, stands to lose thousands of financial jobs due to Brexit. Deutsche Bank announced that it will move at least 2,000 jobs from its London office to Frankfurt, and RBS has announced that it will relocate its London office to Amsterdam.
Federal Reserve policymakers continue to talk about the possibility of a December rate hike, but with the odds for a December increase pegged at just 42%, it's clear that the markets are skeptical about a third rate hike in 2017. Investor attention has shifted to the Fed's balance sheet, which stands at $4.2 trillion. Fed policymakers have broadly hinted at reducing purchases of bonds and securities starting in September, but San Francisco Fed President John Williams was more forthcoming about the Fed's plans this week, in a clear message that was likely aimed at giving notice to the markets. In a speech on Wednesday, Williams said that the economy had "fully recovered" from the 2008 financial crisis and called on the Fed to start trimming the balance sheet "this fall". Williams added that the process would be gradual and would take four years to reduce the balance sheet to a "reasonable size". On Wednesday, two other FOMC members also came out in support of starting to taper the balance sheet – St. Louis Fed President James Bullard and Cleveland Fed President Loretta Mester.
With the Federal Reserve widely expected to begin trimming its balance sheet next month, how will this affect the US dollar? The Fed is expected to initiate the wind-down by not replacing maturing bonds, which will reduce the balance sheet by $200 billion in 2017, according to the Institute of International Finance (IFF). The IFF estimates that this would be equivalent to three normal interest hikes, so the greenback should head upwards once the Fed starts winding down its bloated balance sheet.