
Sample Category Title
GBPJPY Remains Neutral Despite Big Drop
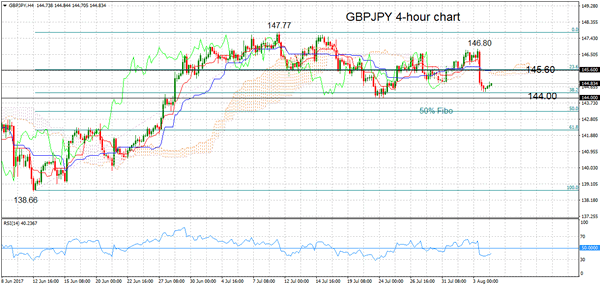
GBPJPY fell sharply yesterday from a high of 146.80 to a low of 144.37 before steadying. Despite the big drop, the technical picture on the 4-hour time frame remains neutral, with prices trading in a broad range between 144.00 and 147.00 since mid-July.
Downside pressure remains since the market has fallen below the Ichimoku cloud and the RSI is now in bearish territory below 50. Prices would need to bounce back above 145.60 to weaken the risk of further declines. A move above strong resistance at 147.77 would see a resumption in the recent uptrend.
Immediate support was found at 144.36, which happens to be the 38.2% Fibonacci retracement level of the rise from 138.66 to 147.77 (June 12 to July 11). From here, strong support is expected at the key level of 144.00 which was tested on July 24. If support at this level fails to hold, then the short-term bias would shift from neutral to bearish. The next level to focus on would be the June 28 low of 143.26. Reaching this point would result in a 50% retracement of the 138.66 to 147.77 upleg, which would confirm a shift in trend.
For now, there are no clear signs of a reversal in the current trend, which remains neutral in the short-term, as long as the market remains above 144.00. In the bigger picture, the uptrend from 138.66 to 147.77 (June 12 to July 11) remains intact and the fall from 147.77 is seen as a corrective move.
NFPs In Focus, USD Slides
USD consolidates ahead of jobs report
Yesterday I argued that the dollar may have reached a bottom and that further weakness is not justified. Looking at the FX market this morning, it seems that the dollar’s bounce back is not for today as the greenback consolidated against most of its peers, unable to extend the modest gains of the last few days. There are several reasons for that. Beside expectations that the Fed will have to back-pedal on tightening and balance sheet unwinding amid stalling economic growth and the arrival of the ECB on the tightening side, the biggest strain on the dollar these days is Donald Trump.
The US President has had quite a negative effect on the dollar since he took office. Its inability to carry out reforms and the political uncertainty, both at the international and national levels, generated by its management style have made investors doubtful its presidency will support the US economy and, by extension, the greenback.
The July jobs report will be the main attraction of the day. Non-farm payrolls are expected to increase 180,000 in July, down from 222,000 in the previous month. Economists surveyed anticipate the unemployment rate to have edged down from 4.4% to 4.3%. Finally, wage growth is expected to have slowdown, with average hourly earnings growing 2.4%y/y versus 2.5% a month ago. However, on a month-over-month basis, wages should have grew 0.3% compared to 0.2% in July.
Overall, investors seem to have become less sensitive to news from the job market. Therefore, there is little chance it’ll move the substantially the US dollar today. However, given the overall negative dollar environment, disappointing data will likely affect more the USD than good ones.
Status quo for the Bank of England
That was not a surprise yesterday, the BoE held rates unchanged at 0.25% and the asset purchase target will be kept at £435 billion. 10 billion of corporate bonds will also be purchased but this does not change from what was previously decided.
However, the British central bank slashed its growth forecasts expectations to 1.7% for this year from 1.9%. Policymakers underlined concerns about consumer spending growth which is too slow to drive growth higher. On top of that, Brexit negotiations outcome remain uncertain and the investment levels should likely diminish on those fears.
We still consider that the Brexit vote has had, for the time being a good consequence by lowering the pound value which is why we should see inflation heading towards, probably in October. It is definitely clear that it is clear that the sterling decline accounts for the growing inflation. By the way, forecasts for 2018 have been raised to 2.5% from 2.4%. After 2019, inflation forecasts are expected to hold higher than the BoE target. This should likely trigger at some point a rate hikes – Two are saying BoE policymakers. We remain bullish on the pound as in our view, markets are still overestimating the Brexit effect.
US Dollar Looking Vulnerable Ahead Of Jobs Data
- US earnings the key component of today’s jobs report;
- US dollar index languishing at 15 month lows, testing major support;
- GBPUSD recovering after BoE induced selling.
Financial markets are trading very flat early on Friday as traders eagerly await the July jobs data from the US.
Traders are yet to buy into the Fed’s plans for another interest rate hike this year – December being the most likely date – which is hardly surprising given the data seen in the first half, particularly on the inflation front. With that in mind, while the unemployment number is likely to write the headlines and the jobs number will be the initial focus, earnings growth is key to today’s report, as well as those for the rest of the year.
Despite a number of metrics suggesting the slack in the US labour market has been significantly reduced, wage growth continues to elude the workforce, to the annoyance of the Federal Reserve. With higher wages being crucial to further progress both on the economy and its inflation target, the central bank will be hoping that the numbers start to improve, having actually softened since the start of the year.
Should we continue to see soft wage growth and inflation running well below target as a result, the Fed may be forced to delay plans on future rate hikes and instead focus on reducing its balance sheet. Given the clear desire to get interest rates closer to 3%, this is obviously a very undesirable situation, although it should be noted that the US is well ahead of others on this.
The US dollar is continuing to languish at 15 month lows as a result of the belief that future rate increases will have to now be much slower, especially as Donald Trump has so far done little to boost the economy, as was expected. This is, of course, also a reflection of traders becoming more bullish on some of its peers as central banks elsewhere start to pivot towards a tightening position. Still the dollar index currently resides in a major support zone and a break below 92 could trigger much sharper losses.
Yesterday’s Bank of England meeting aided the greenback against the pound, with the pair falling back close to 1.31 as traders took the view that any rate increases are once again not a near-term concern. Even still, the pound continues to look bullish against the dollar for now, unless we see a break below 1.30, at which point we could see a dollar resurgence. This would make sense if we are going to see another strong rebound off the dollar index support zone.
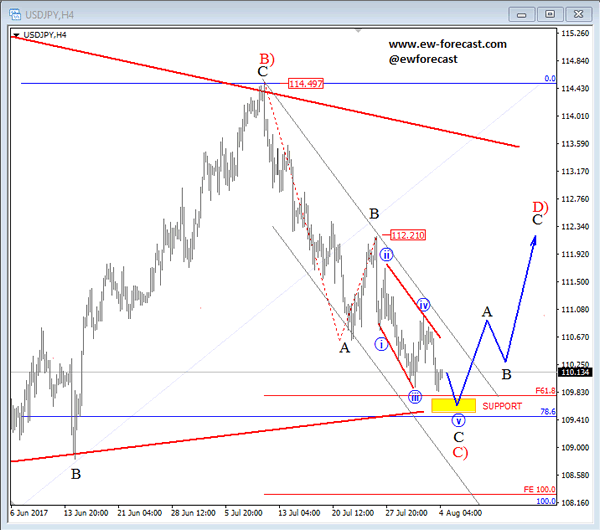
Elliott Wave Analysis: Triangle On USDJPY Points Higher
4H count on USDJPY is showing us a bigger degree red wave C) as part of a big triangle pattern in the making. Aperrantly yesterday's bounce was a fake one, and resulted as only a temporary sub-wave iv within black wave C of C). That said, ideally wave C is now trading in final stages of a bigger three wave bearish move and can search for a base near the Fibonacci ratios of 61.8/78.6 in sessions ahead. A minor five wave bounce would later signal a change in trend.
USDJPY, 4H
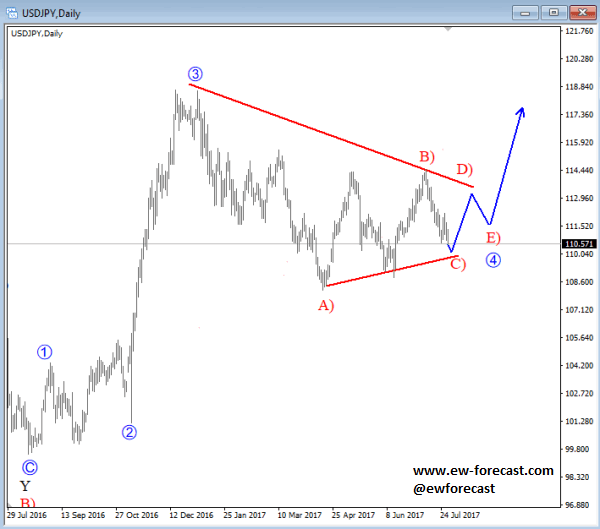
Below we have a bigger picture of the USDJPY, which points towards more gains.
USDJPY, Daily
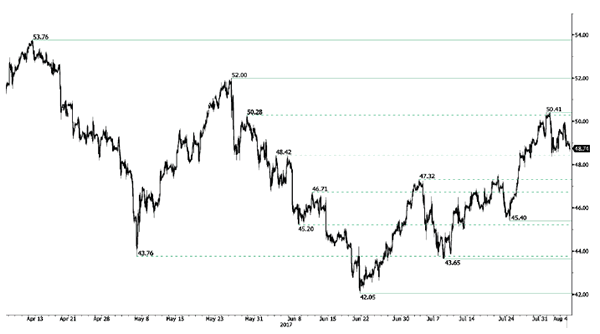
Crude Oil Consolidating Below 50
Crude oil is consolidating lower on profit taking. Hourly support is given at 45.40 (24/07/2017 low). Strong resistance can be found at 50.41 (31/07/2017). Expected to show further consolidation before another leg higher.
In the long-term, crude oil has recovered after its sharp decline last year. However, we consider that further weakness are very likely. Strong support lies at 35.24 (05/04/2016) while resistance can now be found at 55.24 (03/01/2017 high).
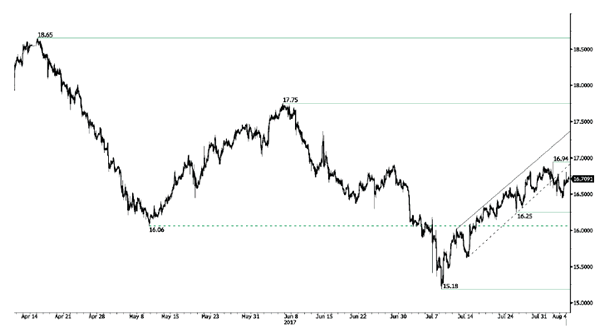
Silver Profit-Taking
Silver's bullish pressures are fading after the bounce from hourly support given at 15.18 (10/07/2017 low). Hourly resistance is given at 16.94 (02/08/2017 high). The commodity is set to further consolidate.
In the long-term, the death cross indicates that further downsides are very likely. Resistance is located at 25.11 (28/08/2013 high). Strong support can be found at 11.75 (20/04/2009).
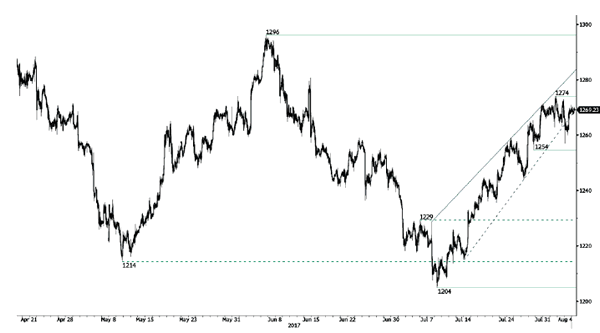
Gold Consolidating
Gold is consolidating lower. Strong support is given at 1204 10/07/2017 high). Hourly resistance is given at 1274 (01/08/2017 high). Expected to show continued another leg higher.
In the long-term, the technical structure suggests that there is a growing upside momentum. A break of 1392 (17/03/2014) is necessary ton confirm it, A major support can be found at 1045 (05/02/2010 low)
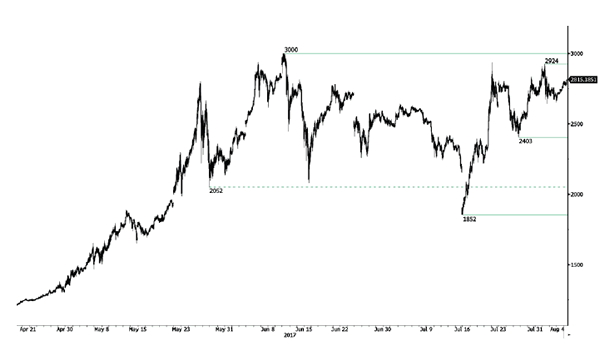
BITCOIN Pushing Higher
Bitcoin's volatility is increasing. Strong resistance can be found around 3000 (12/06/2017 high) and hourly support lies at 2403 (26/07/2017 low). Short-term bullish move is expected.
In the long-term, the digital currency has had an exponential growth. There are decent likelihood that the asset will consolidate above $1500. Long-term support is given at $1464 (04/05/2017 low).
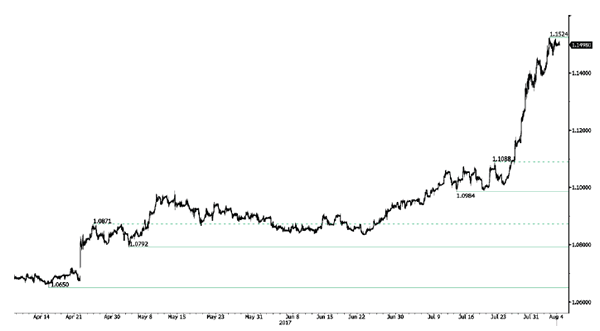
EUR/CHF Consolidating Around 1.1500
EUR/CHF's buying pressures are very important and is trading below 1.15. Hourly support is located at a distance at 1.0984 (13/07/2017 low). Road is wide-open for further strengthening.
In the longer term, the technical structure has reversed. Resistance at 1.1200 (04/02/2015 high) has been broken. Yet,the ECB's QE programme is likely to cause persistent selling pressures on the euro, which should weigh on EUR/CHF. Supports can be found at 1.0184 (28/01/2015 low) and 1.0082 (27/01/2015 low).
EUR/GBP Strong Bullish Pressures
EUR/GBP is trading around its highest levels of the year. The pair is consolidating. Hourly support is given at a distance at 0.8742 (16/06/2017 low). Downside risks are nonetheless important.
In the long-term, the pair has largely recovered from recent lows in 2015. The technical structure suggests a growing upside momentum. The pair is trading above from its 200 DMA. Strong resistance can be found at 0.9500 psychological level.
