Sample Category Title
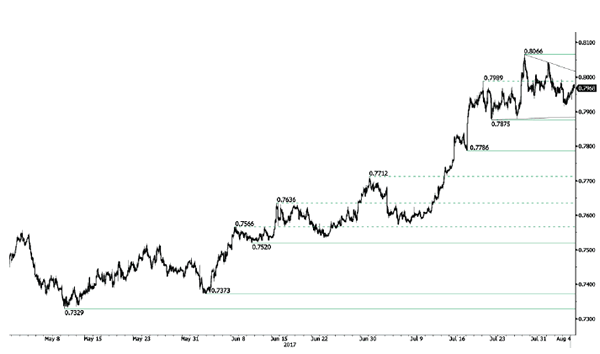
AUD/USD Selling Pressures Increase Slighltly
AUD/USD's technical structure has finally not reversed. Hourly resistance is given at 0.8066 (27/07/2017 high). Hourly support given at 0.7875 (21/07/2017 low). Expected to show further consolidation.
In the long-term, we are waiting for further signs that the current downtrend is ending. Key supports stand at 0.6009 (31/10/2008 low) . A break of the key resistance at 0.8295 (15/01/2015 high) is needed to invalidate our long-term bearish view.
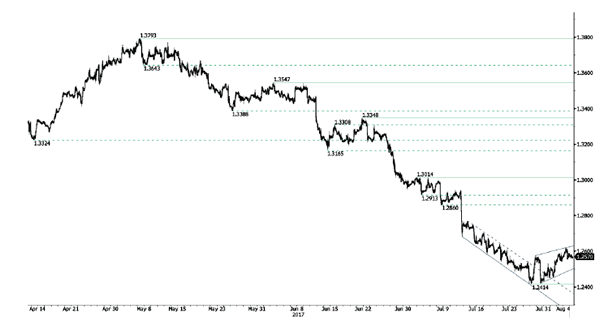
USD/CAD Short-Term Bullish
USD/CAD's bearish momentum is showing ending signals. Hourly resistance is given at 1.2619 (03/08/2017). Expected to show continued consolidation above 1.2400.
In the longer term, the pair has broken longterm support that can be found at 1.2461 (16/03/2015 low) before bouncing back. Strong resistance is given at 1.4690 (22/01/2016 high). The pair should head further lower.
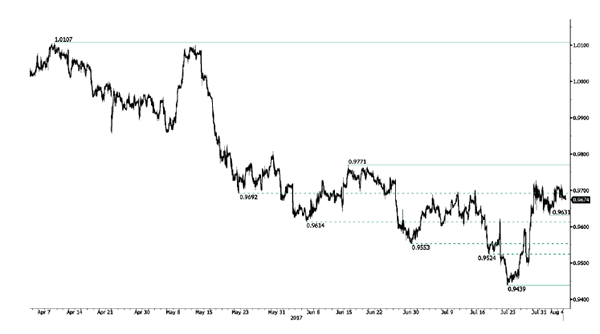
USD/CHF Stalling Around 0.9700
USD/CHF's bullish momentum is fading. Hourly support can be found at 0.9631 (01/08/2017 low). Strong resistance is given at 0.9778 (15/06/2017 high) is on target. Expected to to show further strengthening.
In the long-term, the pair is still trading in range since 2011 despite some turmoil when the SNB unpegged the CHF. Key support can be found 0.8986 (30/01/2015 low). The technical structure favours nonetheless a long term bullish bias since the unpeg in January 2015.
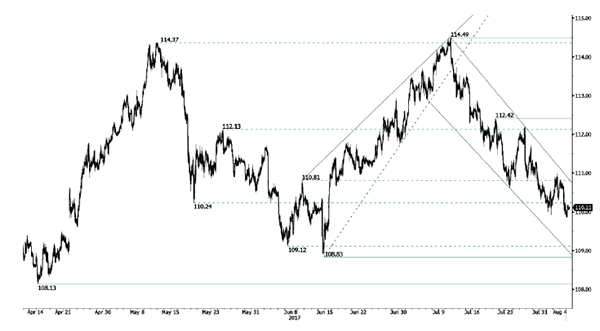
USD/JPY Continued Decline
USD/JPY's bearish momentum continues. Hourly support is given at 109.85 (intraday low). Stronger support is located at a distance at 108.83 (17/04/2017 low). Expected to show further downside pressures.
We favor a long-term bearish bias. Support is now given at 96.57 (10/08/2013 low). A gradual rise towards the major resistance at 135.15 (01/02/2002 high) seems absolutely unlikely. Expected to decline further support at 93.79 (13/06/2013 low).
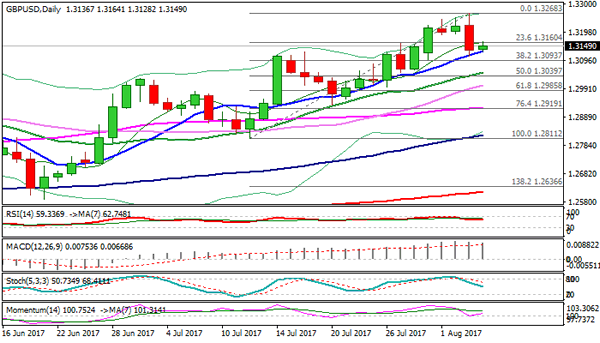
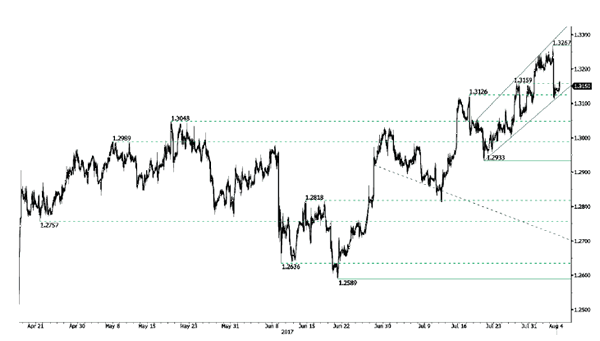
GBP/USD Strong Consolidation Within Bullish Momentum
GBPUSD still lies within a bullish trend despite ongoing consolidation. Hourly resistance is now given at 1.3267 (03/08/2017 high). Hourly support is given at 1.2933 (20/07/2017 low). Expected to show further upside pressures.
The long-term technical pattern is even more negative since the Brexit vote has paved the way for further decline. Long-term support given at 1.0520 (01/03/85) represents a decent target. Long-term resistance is given at 1.5018 (24/06/2015) and would indicate a long-term reversal in the negative trend. Yet, it is very unlikely at the moment.
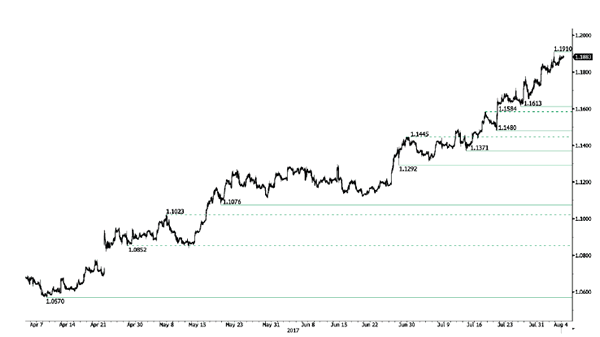
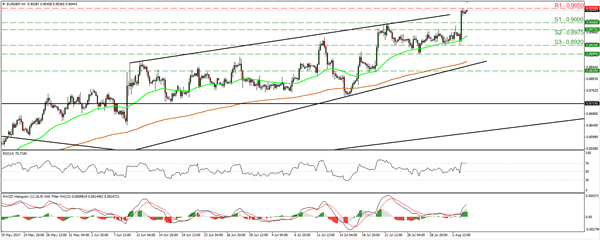
EUR/USD Strong Bullish Moment
EUR/USD bullish pressures continue. The pair has reached 1.1910 (02/08/2017 high). Hourly support can be found at 1.1785 (01/08/2017 high). Stronger support lies at 1.1613 (26/07/2017 low). Expected to show continued bullish pressures.
In the longer term, the momentum is now turning largely positive. We favour a continued bullish bias. Key resistance holding at 1.1871 (24/08/2015 high) has been broken while strong support lies at 1.0341 (03/01/2017 low).
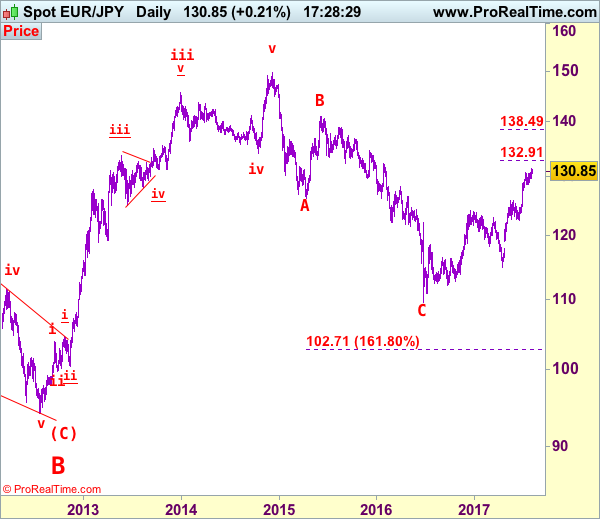
EUR/JPY Elliott Wave Analysis
EUR/JPY - 130.81
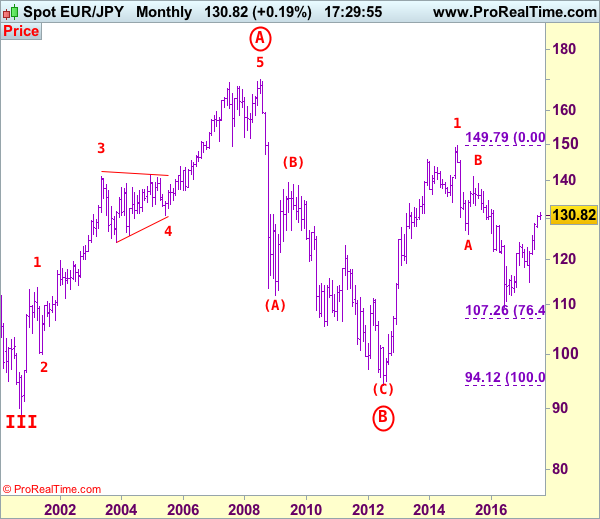
EUR/JPY: Wave v as well as larger degree wave (C) ended at 94.11 and first leg of larger degree wave C upmove ended at 149.79 and wave 2 correction has possibly ended at 109.49.
As the single currency has risen again after brief pullback, the breach of previous resistance at 130.77 adds credence to our bullish count for medium term upmove from 109.49 low (2016 low) to extend further gain to 132.00-10, however, near term overbought condition should prevent sharp move beyond 132.90-00 (1.236 times projection of 109.49-124.10 measuring from 114.85) and price should falter well below previous chart resistance at 134.59, risk from there has increased for a retreat to take place later.
The daily chart is labeled as attached, early selloff from 169.97 (July 2008) to 112.08 is wave (A) of B instead of end of entire wave B and then the rebound from there to 139.26 is wave (B), hence, wave (C) has possibly ended at 94.12 with a diagonal triangle as labeled in the daily chart, hence upside bias is seen for further gain. Recent rally above indicated retracement level at 116.69 (50% Fibonacci retracement of the intermediate fall from 139.26-94.12) adds credence to this view and signal major reversal has commenced but first leg of this wave C has possibly ended at 149.79, hence wave 2 has commenced with wave A ended at 126.09, followed by wave B at 141.06, wave C commenced and could have ended at 109.49, above 126.00 would add credence to this view, then headway to 130.00 would follow.
On the downside, although initial pullback to 130.40-50 cannot be ruled out, reckon 129.50-55 would limit downside and support at 128.49-57 would hold and bring another rise to aforesaid upside targets. A daily close below support at 128.49 would bring test of support at 127.44 but break of latter level is needed to suggest a temporary top is possibly formed, bring retracement of recent upmove to 126.45-50 but price should stay above previous resistance at 125.82 (now support) and euro may head north again from there. Only a sustained breach below this level would signal correction of recent upmove has commenced for further fall to 125.15-20 but previous resistance at 124.65 would hold from here.
Recommendation: Buy at 128.55 for 131.55 with stop below 127.55.
To re-cap the corrective upmove from the record low of 88.93 (18 Oct 2000), the wave A from there is subdivided as: 1:88.93-113.72, 2:99.88 (1 Jun 2001), 3:140.91 (30 May 2003), 4:124.17 (10 Nov 2003) and 5 ended at record high of 169.97 (21 Jul 2008). The brief but sharp selloff to 112.08 is viewed as a-b-c x a-b-c wave (A) of B. The subsequent rebound to 139.26 is (B) of B and (C) of (B) has possibly ended at 94.12 and in any case price should stay well above previous chart support at 88.93, bring rally in larger degree wave C towards 150.00.
USD/CHF Elliott Wave Analysis
USD/CHF – 0.9678
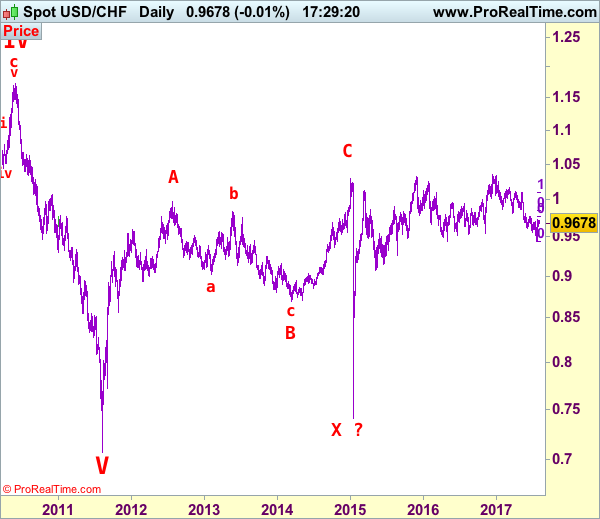
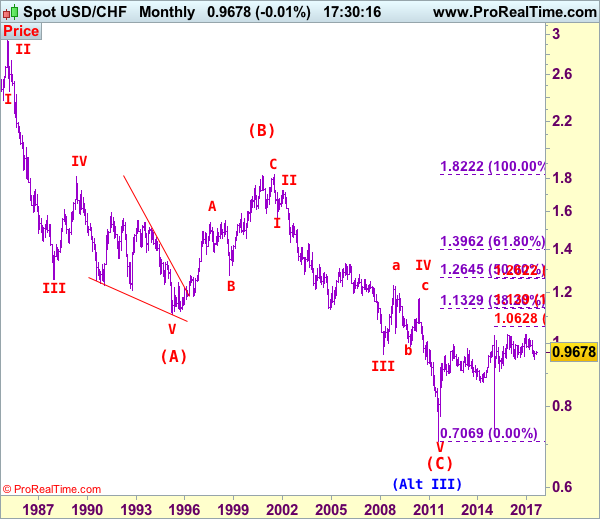
USD/CHF – Wave IV ended at 1.1730 and wave V has possibly ended at 0.7068
As the greenback has rebounded after falling to 0.9438 last month, adding credence to our view that a temporary low is possibly formed there and consolidation with mild upside bias is seen for gain to 0.9771 resistance, however, a daily close above there is needed to add credence to this view, bring retracement of recent decline to resistance at 0.9808 but only a sustained breach above this level would provide confirmation and signal correction of recent selloff has commenced, then headway to 0.9890-00 would follow but upside should be limited to 0.9940-50 and price should falter well below psychological resistance at 1.0000.
Our preferred count on the daily chart is that early selloff to 0.9630 is an end of the larger degree wave III and major correction is unfolding from there with a leg ended at 1.2298 (Nov 2008 with (a): 1.0625, (b):1.0011 and (c):1.2298), wave b ended at 0.9910 with (a): 1.0370, (b): 1.1967, (c): 0.9910. The rise from there to 1.1730 is the wave c which also marked the end of wave IV and wave V has possibly ended at 0.7068.
On the downside, whilst pullback to 0.9600 cannot be ruled out, reckon 0.9550-55 would limit downside and bring another rebound to aforesaid upside targets. Only a drop below said recent low at 0.9438 would revive bearishness and signal the erratic decline from 1.0344 top (formed back in late 2016) is still in progress and downside bias remains for this move to extend weakness to 0.9390-00, however, loss of downward momentum should prevent sharp fall below 0.9300-10, risk from there has increased for a rebound to take place probably later.
Recommendation: Buy at 0.9555 for 0.9755 with stop below 0.9455
Dollar's long-term downtrend started from 2.9343 (Feb 1995) and it was unfolding as a (A)-(B)-(C) with (A): 1.1100, (B): 1.8310 (26 Oct 2000), then followed by another impulsive wave (C) with wave III ended at 0.9630 (Mar 2008). Under this count, correction in wave IV has possibly ended at 1.1730 and wave V already broke below support at 0.9630 and met indicated downside target at 0.7500 and 0.7400. The reversal from 0.7068 suggests the wave V has possibly ended and the breach of resistance at 0.9595 add credence to this view and indicated upside target at 1.0000 had been met, however, the sharp retreat from 1.0296 to 0.7401 suggests choppy trading would be seen but price should stay above said record low at 0.7068.
Can A Solid Employment Report Change The Dollar’s Fortune?
Today, the US employment report for July will take center stage. The forecast is for nonfarm payrolls to have risen by 183k, less than the 222k in June, but still a number consistent with further tightening in the labor market. The unemployment rate is expected to have ticked back down to 4.3%, while average hourly earnings are forecast to have accelerated in monthly terms. Overall, this looks like another strong employment report, which could revive some expectations for another Fed rate hike this year (that probability is currently 45% according to the Fed funds futures) and thereby, help the dollar recover some of its latest losses.
However, we think that the main determinants of whether the Fed will indeed proceed with another hike this year are inflation data. The latest prints showed that headline inflation slowed for the 4th consecutive month, while the core rate remained unchanged after falling for 4 months in a row as well. In our view, a strong rebound in inflation is needed before rate-hike expectations rise materially and help the dollar reverse its latest downtrend.
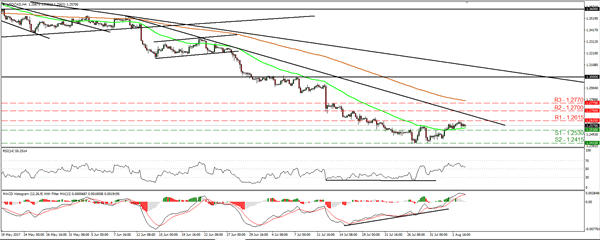
USD/CAD traded in a consolidative manner yesterday, staying between the support of 1.2530 (S1) and the resistance of 1.2615 (R1). Having in mind that the rate is still trading below the short-term downtrend line taken from the peak of the 9th of June, we consider the short-term downtrend to still be intact. However, the rate failed twice to break below 1.2415 (S2) recently, while there are expectations of solid US employment data later in the day, and a neutral Canadian jobs report (see below). All these make us believe that there is a decent probability for the pair to trade higher today, and perhaps break above the aforementioned short-term downtrend line. A break above that line and 1.2615 (R1) may initially aim for our next resistance of 1.2700 (R2).
Switching to the daily chart, although a break above the short-term downtrend line may signal a short-term trend reversal, as long as the rate is trading below the psychological zone of 1.3000, we consider the broader outlook to be cautiously negative. We would treat a possible short-term reversal as a corrective rebound.
BoE signals little urgency for a near-term hike; GBP tumbles
The BoE kept its policy unchanged yesterday via a 6-2 vote, as was anticipated. Even though the Bank reiterated that policy may need to be tightened to a somewhat greater extent over the next 3 years than what is currently implied by market pricing, it signaled little urgency for a hike in the next few months. In addition, it revised lower its inflation and economic growth forecasts. The Bank’s neutral tone, combined with the downgrade in the forecasts, likely disappointed investors looking for hawkish signals that a rate hike is imminent. The fact that the vote was 6-2 may have also been seen as a negative surprise, as some may have expected Haldane to join the hawks and vote for a hike too. The result was a weaker sterling.
As for the pound’s forthcoming direction, in the absence of any Brexit headlines to guide the currency over the next few days, movements in GBP crosses are likely to depend primarily on the pound’s counterparts. Specifically, GBP may continue to gain against the weak USD, but perhaps remain on the back foot versus the almighty EUR.
EUR/GBP surged yesterday on the BoE decision. The rate emerged above the psychological barrier of 0.9000 (S1), to challenge our next hurdle of 0.9050 (R1). Given that yesterday’s rally confirmed a forthcoming higher high, we believe that the outlook remains positive. We would expect a decisive break above 0.9050 (R1) to open the way for our next resistance of 0.9125 (R2). Nevertheless, bearing in mind that the BoE surge appears overextended, we are mindful of a corrective retreat due to some profit taking. Such a retreat may challenge the 0.9000 (S1) territory as a support this time before the bulls decide to shoot again.
As for the rest of today’s highlights:
Besides the US jobs figures, we get employment data for July from Canada as well. The forecast is for the unemployment rate to have remained unchanged, while the net change in employment is expected to have declined, but to remain in positive territory. In such a case, the reaction in CAD may be relatively limited. That said, we should stress that we view the risks surrounding CAD’s forthcoming direction as being asymmetrical. Market pricing currently suggests that another BoC rate hike by year-end is fully priced in. Therefore, if economic data and developments are encouraging over the next months, they would only confirm the current sentiment and may thus have little positive impact on CAD. On the other hand, in case economic indicators deteriorate, expectations for a hike could quickly decline, leading to a significant downside correction in CAD.
As for the speakers, BoE Chief Economist and MPC member Andy Haldane will deliver remarks.
USD/CAD
Support: 1.2530 (S1), 1.2415 (S2), 1.2360 (S3)
Resistance: 1.2615 (R1), 1.2700 (R2), 1.2770 (R3)
EUR/GBP
Support: 0.9000 (S1), 0.8975 (S2), 0.8920 (S3)
Resistance: 0.9050 (R1), 0.9125 (R2), 0.9235 (R3)
Technical Outlook: GBPUSD Consolidates Above Thursday’s Post BoE Low, US Jobs Data In Focus
Cable is holding within narrow range above Thursday's low at 1.3112, which was posted on sharp fall after BoE. Pound was down 0.67% on Thursday (the biggest one-day fall since 07 July) after the bank of England left interest rates unchanged and cut its economic growth for this and next year.
Sterling showed strong hesitation at the levels above 1.3200, where upticks were repeatedly rejected (series of fresh highs between 1.3244 and 1.3268), ahead of pullback.
Another negative signal was generated by formation of bearish Outside Day reversal pattern on Thursday, which may boost near-term bears for deeper correction.
Scenario requires break below rising 10SMA (currently at 1.3128) which so far holds and break below yesterday's low at 1.3112, to resume lower.
South-heading daily indicators are supporting the notion, however, overall bullish picture keeps bias at the upside.
Bounce above 1.3200 barrier is needed to neutralize downside threats and shift focus higher. US jobs data today are expected to give more clues about pair's near-term direction.
Res: 1.3171, 1.3190, 1.3208, 1.3225
Sup: 1.3128, 1.3112, 1.3050, 1.3004