
Sample Category Title
EUR/CHF Eyeing More Gains
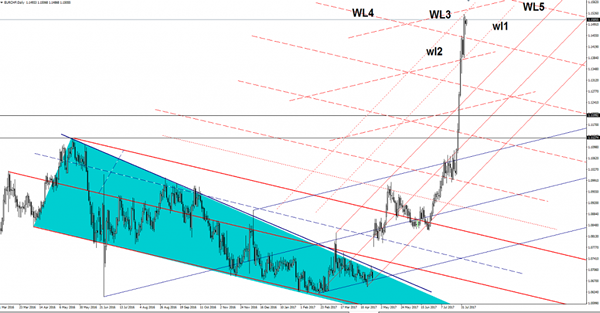
Price tries to extend the latest gains an to hit another upside target. is trading above the 1.1500 psychological level and is very close to delete the yesterday's minor losses. Has found temporary resistance at the second warning line (wl2) of the minor ascending pitchfork. Could be attracted by the confluence area formed between the second warning line (wl2) and the third warning line (WL3).
GOLD Looks To Trade Higher
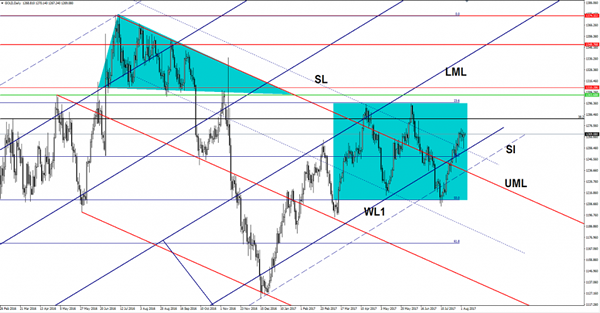
The yellow metal is located in the buyer’s territory and should climb much higher in the upcoming days. Looks undecided right now, but maintains a bullish perspective after the failure to reach and retest some support levels (resistance turned into support).
You can see that has come down in the yesterday’s session, but failed to retest the sliding line (SL) and the warning line (WL1), signaling that the buyers are still in the game and could push it towards the 38.2% retracement level.
EUR/USD Struggling To Hold Ground
EUR/USD is trading in the green, but is showing some exhaustion signs on the Daily chart. Is bullish because is located above some important support levels. Has changed little in the morning and most likely is waiting for the Euro-zone data to bring some action. The Germn Factory Orders rose by 1.0% in June, exceeding the 0.6% estimate.
The Italian Retail Sales may increase by 0.1% in June and could come in the positive territory after two decreasing months, the Euro-zone Retail Sales will be released as well.
You should be careful in the afternoon as the US is to release high impact data. The fundamental factors will take the lead again, a high volatility is expected in the US session.
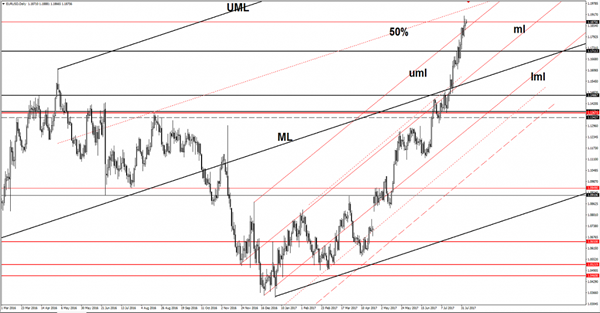
EUR/USD is trading above the upper median line (uml) of the minor ascending pitchfork and is fighting hard to approach and reach the 1.1909 previous high. We have an important upside target at the 50% Fibonacci line (ascending dotted line) as well, will reach this obstacle only if will have enough energy to close above the previous high.
A failure to make new high will signal an overbought and a potential drop below the upper median line (uml). The bias is bullish as long as the rate is trading above the upper median line (uml). The greenback could take the lead on the short term if the US data will impress in the afternoon.
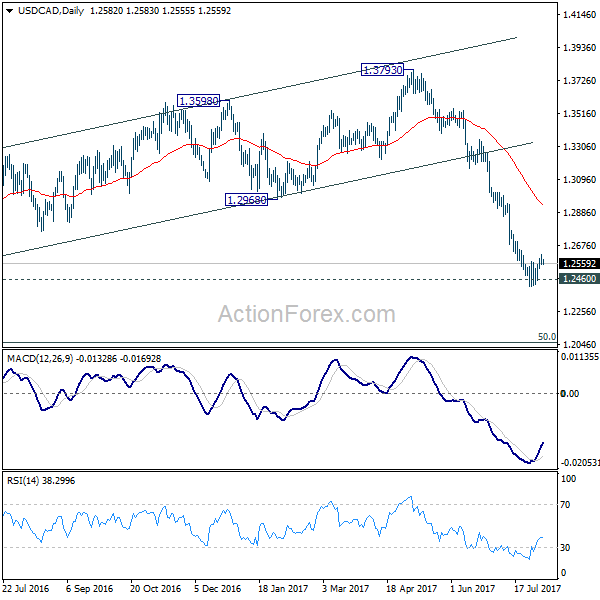
USD/CAD Daily Outlook
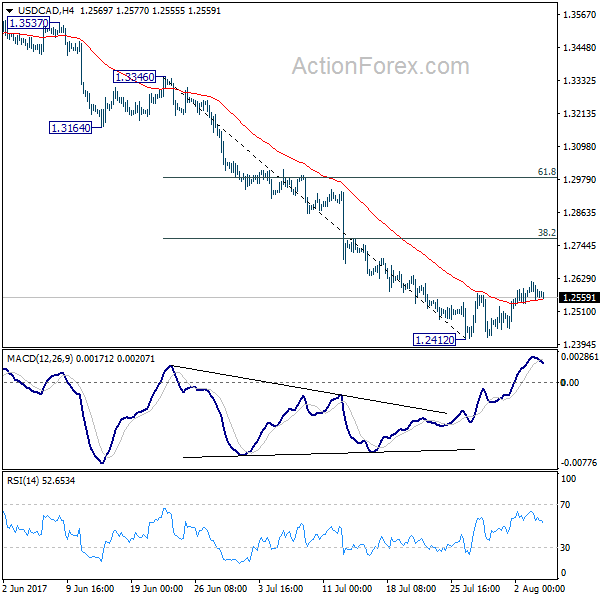
Daily Pivots: (S1) 1.2553; (P) 1.2585; (R1) 1.2619; More....
Intraday bias in USD/CAD is turned neutral with 4 hour MACD crossed below signal line. Consolidation from 1.2412 short term bottom might extend. But in case of another rise, upside should be limited by 38.2% retracement of 1.3346 to 1.2412 at 1.2769 to bring fall resumption. On the downside, break of 1.2412 will extend recent fall from 1.3793 to next key fibonacci level at 1.2048. However, sustained break of 1.2769 will bring stronger rebound back to 55 day EMA (now at 1.2927) before resuming the larger fall.
In the bigger picture, price actions from 1.4689 medium term top are seen as a correction pattern. Fall from 1.3793 is seen as the third leg and should target 50% retracement of 0.9406 to 1.4869 at 1.2048. At this point, we'd look for strong support from there to contain downside and bring rebound. However, firm break there will target 100% projection of 1.4689 to 1.2460 from 1.3793 at 1.1564.
Focus Turns Back to US with Non-Farm Payrolls Watched
Focus of the market will turn back to US economic data today. Economists expect non-farm payroll to show 180k growth in the US job markets in July, down from prior month's 222k. Unemployment rate is expected to drop to 4.3%. Average hourly earnings are expected to grow solidly by 0.3% mom. Looking at other employment related data, ADP private job growth slowed to 178k in the same month, down from 191k. Nonetheless, the three month average of ADP rose 10k from 191k to 201k. Employment component of ISM manufacturing dropped to 55.2, down from 57.2. Employment component of ISM services also dropped to 53.6, down from 57.8. Initial jobless claims were steady though, with four month average improved from 244k to 242k. Conference board consumer confidence also rose from 117.3 to 121.1. Other employment related data were mixed in general. Also from US, trade balance will be released.
After last FOMC meeting, it's clear that Fed policy makers prefer to start balance sheet normalization first in September. They would hold their cards for another rate hike till December. We believe the key for Dollar now is whether Fed will really hike again in December. Based on subdued inflation outlook, the risks are more skewed to the downside. That is, a month of upside surprise in non-farm payroll and wage growth might solidify the case for a December hike a little. But markets could be more aggressively pricing out of a December hike on downside surprises. Currently, Fed funds futures are pricing in only around 45% chance of a hike in December.
Canadian job data also a key focus
Another focus of the day is Canadian job data. Economists expect the Canadian economy to add 19k jobs in July. Unemployment rate is expected to be unchanged at 6.5%. Canada will also release Ivey PMI and trade balance. USD/CAD lost much downside momentum after hitting 1.2412 late last month and turned into consolidation. 1.2460 being a key support level is see as a factor limiting the loonie. WTI crude oil breached 50 handle briefly this week but failed to sustain above that level. This is seen as another factor. But based on BoC's last statement, it's cleared that after the rate hike, the central bank is still open to further tightening. Hence, we'd likely see the Canadian Dollar regain strength if upcoming data from the country are promising.
GBP/USD and GBP/JPY hold on to support after BoE selloff
Sterling dropped sharply against Euro yesterday after dovish BoE statement and inflation report. But the Pound is holding above near term support at 1.3096 against Dollar and 144.01 against Yen so far. With the newcomer Silvana Tenreyo supporting to maintain the status quo, the BOE split changed to 6-2 from 5-3 in June. Ian McCafferty and Michael Saunders continued to believe a 25 bps rate is needed. The members cut the GDP growth outlook to 1.7%, from 1.9% previously, for 2017 and 1.6%, from 1.7% previously, for 2018. Inflation outlook is revised modestly higher to 2.7% (2.6% previously) for this year and unchanged at 2.6% for 2018. The forecast for 2019 also stays unchanged at 2.2%.
Governor Mark Carney warned that Brexit uncertainty is weighing on the country's economic outlook. He suggested that if "households and business look through the flurry of headlines then the economy can be expected to pick up" but the current economic performance is "sluggish". The Governor added that the uncertainty over Brexit negotiation "weighs on the decisions of businesses and households and holds down both demand and supply". Note, however, that the downgraded growth forecast for 2017 was based on a "smooth" Brexit in 2019. This, according to Carney, remains the "most realistic assumption".
More about BoE in
- Bank of England Review - More Dovish But Still Too Optimistic on Growth
- Sterling Tumbles as BoE Keeps Rates on Hold, Cuts Growth Forecasts
- BOE Voted 6-2 to Leave Rate Unchanged, Downgraded Growth Outlook
- Comments on the Sterling, after the Bank of England Leaves Interest Rates at a Record Low
- Markets Shrug Off BoE Interest Rate Warnings
- GBP/USD Slumps as BoE Votes 6-2 to Hold Policy Unchanged
Elsewhere
Japan labor cash earnings dropped -0.4% yoy in June. Australia retail sales rose 0.3% mom in June. German factory orders rose 1.0% mom in June. Eurozone retail PMI will be featured in European session.
USD/CAD Daily Outlook
Daily Pivots: (S1) 1.2553; (P) 1.2585; (R1) 1.2619; More....
Intraday bias in USD/CAD is turned neutral with 4 hour MACD crossed below signal line. Consolidation from 1.2412 short term bottom might extend. But in case of another rise, upside should be limited by 38.2% retracement of 1.3346 to 1.2412 at 1.2769 to bring fall resumption. On the downside, break of 1.2412 will extend recent fall from 1.3793 to next key fibonacci level at 1.2048. However, sustained break of 1.2769 will bring stronger rebound back to 55 day EMA (now at 1.2927) before resuming the larger fall.
In the bigger picture, price actions from 1.4689 medium term top are seen as a correction pattern. Fall from 1.3793 is seen as the third leg and should target 50% retracement of 0.9406 to 1.4869 at 1.2048. At this point, we'd look for strong support from there to contain downside and bring rebound. However, firm break there will target 100% projection of 1.4689 to 1.2460 from 1.3793 at 1.1564.
Economic Indicators Update
| GMT | Ccy | Events | Actual | Forecast | Previous | Revised |
|---|---|---|---|---|---|---|
| 0:00 | JPY | Labor Cash Earnings Y/Y Jun | -0.40% | 0.60% | 0.70% | 0.60% |
| 1:30 | AUD | Retail Sales M/M Jun | 0.30% | 0.20% | 0.60% | |
| 1:30 | AUD | RBA Statement on Monetary Policy | ||||
| 6:00 | EUR | German Factory Orders M/M Jun | 1.00% | 0.50% | 1.00% | 1.10% |
| 8:10 | EUR | Eurozone Retail PMI Jul | 53.2 | |||
| 12:30 | CAD | International Merchandise Trade (CAD) Jun | -0.90B | -1.09B | ||
| 12:30 | CAD | Net Change in Employment Jul | 19.0K | 45.3K | ||
| 12:30 | CAD | Unemployment Rate Jul | 6.50% | 6.50% | ||
| 12:30 | USD | Trade Balance Jun | -45.6B | -46.5B | ||
| 12:30 | USD | Change in Non-farm Payrolls Jul | 180K | 222K | ||
| 12:30 | USD | Unemployment Rate Jul | 4.30% | 4.40% | ||
| 12:30 | USD | Average Hourly Earnings M/M Jul | 0.30% | 0.20% | ||
| 14:00 | CAD | Ivey PMIs Jul | 59.2 | 61.6 |
Forex Technical Analysis: EUR/USD, USD/JPY, GBP/USD
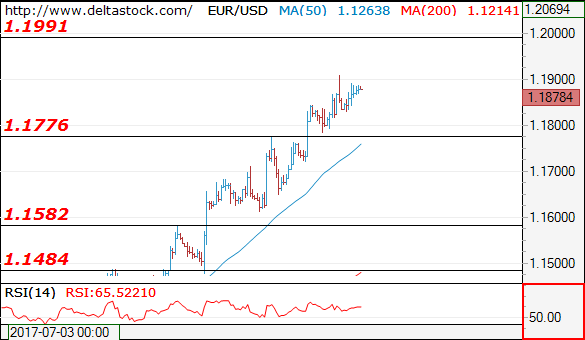
EUR/USD
Current level - 1.1878
The bias remains positive above 1.1775 support, for a rise towards 1.2000 sentiment area.
| Resistance | Support | ||
| intraday | intraweek | intraday | intraweek |
|
1.1910 |
1.2000 |
1.1775 |
1.1580 |
|
1.2000 |
1.2240 |
1.1611 |
1.1480 |
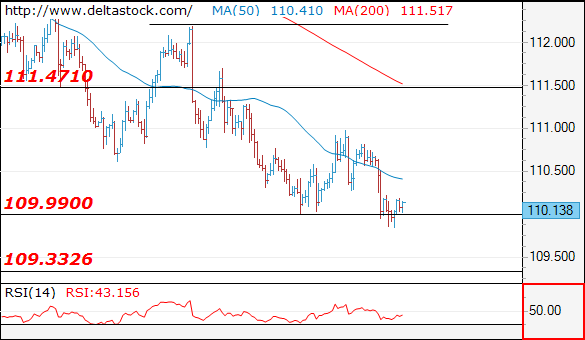
USD/JPY
Current level - 110.13
My outlook is bearish below 110.30 minor resistance, for a slide towards 109.30 support.
| Resistance | Support | ||
| intraday | intraweek | intraday | intraweek |
|
110.30 |
114.50 |
109.30 |
110.30 |
|
111.50 |
115.50 |
109.30 |
108.10 |
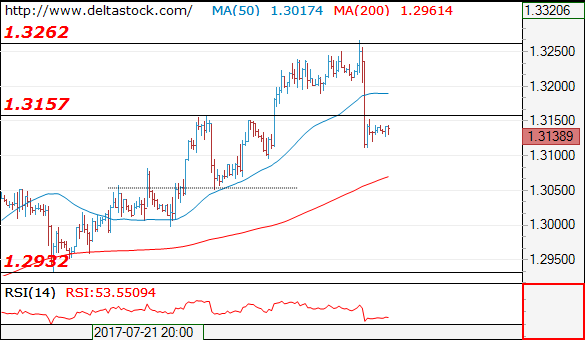
GBP/USD
Current level - 1.3138
Yesterday's failure at 1.3260 led to a fast slide and the violation of 1.3160 support signals a risk of another dip, towards 1.3050 zone. Intraday resistance lies at 1.3170.
| Resistance | Support | ||
| intraday | intraweek | intraday | intraweek |
|
1.3170 |
1.3260 |
1.3050 |
1.2930 |
|
1.3260 |
1.3500 |
1.2930 |
1.2810 |
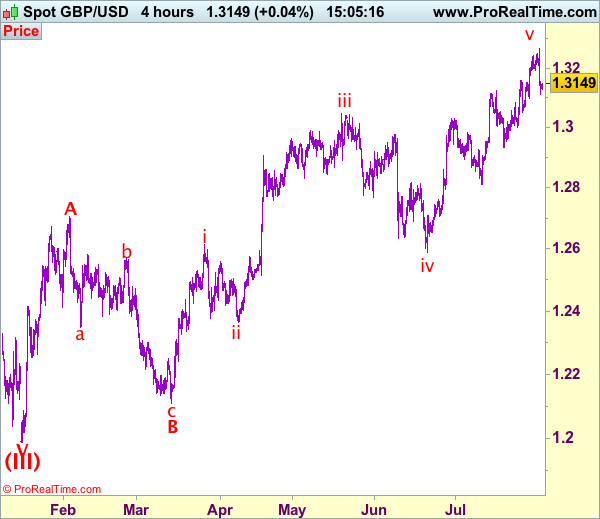
Trade Idea: GBP/USD – Exit long entered at 1.3145
GBP/USD – 1.3160
Recent wave: Wave V of larger degree wave (III) has ended at 1.1986 and major correction has commenced from there for gain to 1.3000 and 1.3140-50
Trend: Near term up
Original strategy :
Bought at 1.3145, Target: 1.3345, Stop: 1.3085
Position: - Long at 1.3145
Target: - 1.3345
Stop: - 1.3085
New strategy :
Exit long entered at 1.3145,
Position: - Long at 1.3145
Target: -
Stop:-
Despite yesterday’s brief rise to 1.3269, the subsequent sharp selloff after BOE signals top has been formed there, hence consolidation below this level would be seen and near term downside risk is for test of 1.3097 support, break there would add credence to this view, bring retracement of recent rise to 1.3070 support, then towards 1.3052, however, near term oversold condition should limit downside and reckon support at 1.2999 would hold.
In view of this, would be prudent to exit long entered at 1.3145 and stand aside for now. Above 1.3190-00 would bring recovery to 1.3220-30, however, said resistance at 1.3269 should remain intact, bring another retreat later. Only a break of 1.3269 would signal recent upmove has once again resumed and extend headway in the final wave v of larger degree wave C to 1.3300-10 but reckon upside would be limited to 1.3340-50 and price should falter below 1.3390-00, then sterling shall retreat sharply from there.
Our preferred count on the daily chart is that cable's rebound from 1.3500 (wave (A) trough) is unfolding as a wave (B) with A ended at 1.7043, followed by triangle wave B and wave C as well as wave (B) has ended at 1.7192, the subsequent selloff is the larger degree wave (C) which is still unfolding with minor wave (III) of larger degree wave 3 ended at 1.1986, hence wave (IV) correction is in progress which could either be a triangle wave (IV) of a complex formation but upside should be limited to 1.3500 and price should falter well below 1.4000, bring another decline in wave (V) of 3 for weakness to 1.1500, then 1.1200.
Will July’s US Jobs Report Rescue The Dollar?
It has been another rough and rocky trading week for the Greenback as heightened political jitters in Washington weighed heavily on the currency.
Friday's potential market-shaker will be the US jobs report for July, which should offer crucial insights into the health of the US labor market. With the challenging combination of stubbornly low inflation and lackluster economic data weighing heavily on the prospects of higher US interest rates, today's NFP report may garner extra attention. Markets expect the US economy to have gained 183k jobs in July, with average earnings up by 0.3%, while the unemployment rate is predicted to drop to 4.3%.
While every element of the US jobs report is of great importance, there will be a very strong focus on wage growth as further signs of wages failing to accelerate may fuel concerns over inflation remaining subdued, ultimately feeding the Fed doves. Optimism over the Federal Reserve raising interest rates again this year is waning and a soft US jobs report that fails to plug the holes is likely to expose the Dollar to further losses.
The distressed Dollar is in need of a lifeline and it may take an extreme upside surprise in both headline job numbers and earnings to bring the bulls back into the game.
From a technical standpoint, the Dollar Index is heavily bearish on the daily charts. The breakdown below 93.00 should encourage a further depreciation towards 92.00.
WTI Crude gripped again by oversupply woes
The bearish cocktail of rising US oil production and high OPEC supplies, has exposed WTI Crude to steep losses, with bears dragging the commodity towards $49.00 during early trading on Friday. It is remarkable how production from OPEC hit a 2017 high in July, despite the cartel's pledge to tackle oversupply woes with other non-OPEC members.
The story of rising production from OPEC and US Shale continues to feel like a battle of attrition, with the victor taking the spoils of war. With oversupply concerns still a dominant theme that fuels the bearish sentiment towards oil, further downside is to be expected. From a technical standpoint, WTI Crude has found strong resistance around the $50 resistance level. A breakdown below $48.50 should encourage a further decline towards $48.00. Bears need to secure a weekly close under $48.00 for WTI Crude to trade back towards $45.50.
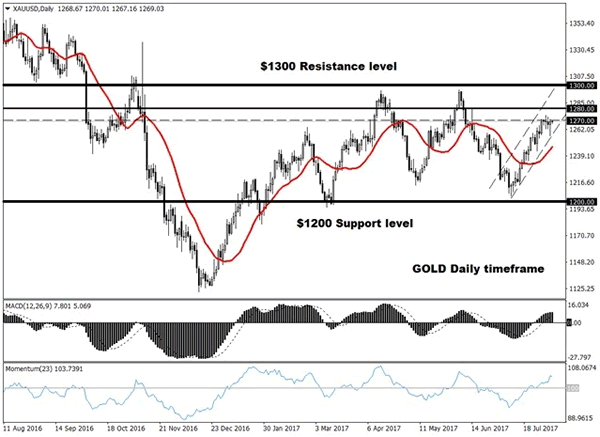
Commodity Spotlight – Gold
Gold staged an incredible rebound from the $1257 region during Thursday's trading session, as political uncertainty in Washington accelerated the flight to safety. A vulnerable US Dollar also complimented the upside, with prices holding steady near a seven-week high at $1269 during early trading on Friday. Investors will be paying very close attention to the NFP report that is released today and is likely to impact rate hike expectations, ultimately affecting Gold's direction. A disappointing US jobs report should weaken the Dollar and inspire Gold bulls to challenge $1280, as rate hike expectations diminish further. From a technical standpoint, the yellow metal remains bullish on the daily charts and a breakout above $1270 should encourage a further appreciation towards $1280.
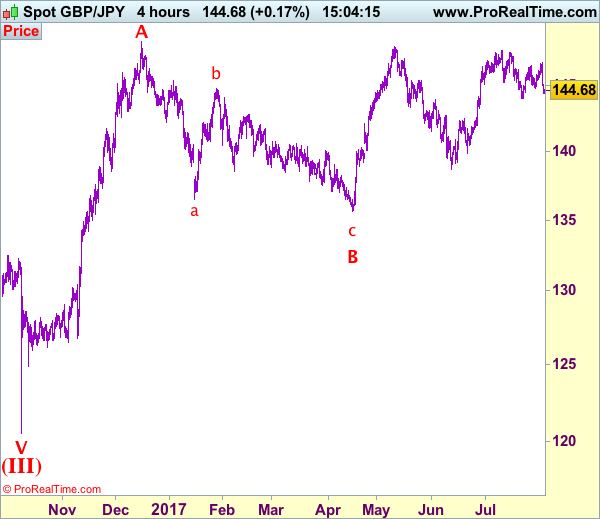
Trade Idea: GBP/JPY – Stand aside
GBP/JPY - 144.75
Recent wave: Medium term low formed at 120.50 and (A)-(B)-(C) major correction has commenced with (A) leg ended at 148.45, hence wave (B) is unfolding for retreat to 131.00-10.
Trend: Near term up
Original strategy:
Bought at 145.55, stopped at 145.35
Position: - Long at 145.55
Target: -
Stop: - 145.35
New strategy :
Stand aside
Position: -
Target: -
Stop:-
Despite yesterday’s marginal rise to 146.80, lack of follow through buying and the subsequent sharp retreat dampened our bullishness and suggest the rebound from 144.05 support has ended there, hence downside risk is seen for weakness towards this support, however, break there is needed to retain near term bearishness and signal another leg of corrective decline from 147.75 top is underway, then further fall to 143.50 and later test of support at 143.30 would follow.
In view of this, would not chase this fall here and would be prudent to stand aside for now. Above 145.40-45 would bring recovery towards 145.90-00, however, as outlook remains consolidative, price should falter below said resistance at 146.80, bring another decline later.
Our preferred count is that larger degree wave V with circle is unfolding from 251.12 with wave (I) 219.34, (II): 241.38 and wave (III) is subdivided into 1: 192.60, 2: 215.89 (23 Jul 2008) and wave 3 ended at 118.87 earlier in 2009. The correction from there to 162.60 is wave 4 which itself is a double three and is labeled as first a-b-c ended at 151.53, followed by wave x at 139.03, 2nd a ended at 162.60, 2nd b at 146.75 and 2nd c leg of wave 4 ended at 163.00. Therefore, the decline from 163.00 to 116.85 is now treated as wave 5 which also marked the end of larger degree wave (III), hence wave (IV) major correction has commenced for retracement of the wave (III) from 241.38 and upside target at 183.95-00 (50% Fibonacci retracement of the wave (II) from 241.38) had been met, a drop below 160.00 would suggest wave (IV) has ended at 195.85, bring decline in wave (V) for initial weakness to 130 (already met) and 120.
BoE Is Still Too Optimistic On Both Wage Growth And GDP Growth
Market movers today
Today all eyes will be on the US employment report. We expect that nonfarm payrolls rose 175,000 in July but markets will focus on the unemployment rate and wage growth. We expect the unemployment rate was unchanged at 4.4%, while the average hourly earnings increase likely declined to 2.4% y/y from 2.5% y/y. The Fed continues to struggle with the combination of low unemployment and low inflation; see also our take on the jobs report for June in Flash Comment US: Fed's dilemma, 7 July 2017.
In Germany, factory orders for June are also released, which should show another monthly increase of 0.8%, in light of the continued strong business confidence and recent increases in the Ifo index.
In Sweden, NIER will publish its new economic forecasts.
Selected market news
The main event in the European market yesterday was the Bank of England meeting. As expected the bank maintained the Bank Rate at 0.25% and kept targets for bond purchases unchanged. However, importantly the vote count was 6-2 compared to 5-3 last time. Hence, one member less voted for a rate hike this time. The BoE decision was the latest evidence that central banks are in no hurry to normalise monetary policy despite the economic recovery as wage growth remains muted. EUR/GBP rose sharply and broke above 0.90 on the announcement given the dovish twist . West ill expect the BoE to remain on hold until the Brexit negotiations are concluded in spring 2019. The main reasons are that we think the BoE is still too optimistic on both wage growth and GDP growth, and political uncertainty remains high due to Brexit. Hence, we look for further sterling weakness in the coming months.
The ‘debt ceiling' pencilled in by end of September by US agencies is moving closer day by day. But yesterday, the White House made it clear that it would back the "cleanest possible" debt ceiling increase despite calls from conservatives to seek spending cuts in return. Office of Management and Budget Director Mick Mulvaney said yesterday at a briefing that the administration would not seek any spending cuts in a debate on increasing the debt ceiling. Remember, this is a demand from members of the Tea Party and conservative Freedom Caucus in the House. This should be seen as an open invitation from the White House to the Democrats to secure a bi-partisan agreement .
However, the Trump administration has other issues to deal with than the debt ceiling. Last night there were reports that Special Counsel Robert Mueller is using a grand jury in Washington with the purpose of investigating Russia's interference in the 2016 elections. This piece of news can hardly be seen other than a sign that his inquiry is growing in intensity. A grand jury would imply that witnesses can be called in and that they have to testify under oath. The news pushed most US equity indices into the red and only the Dow Jones was in green as the closing bell rang. The US Treasury market also saw support on the news and we should expect a positive opening for European bonds this morning despite the rally yesterday. And Trump? He called the investigation a " total fabrication".