Sample Category Title
Daily Technical Analysis: US Dollar Waiting For Direction From US Non Farm Payroll
Currency pair EUR/USD
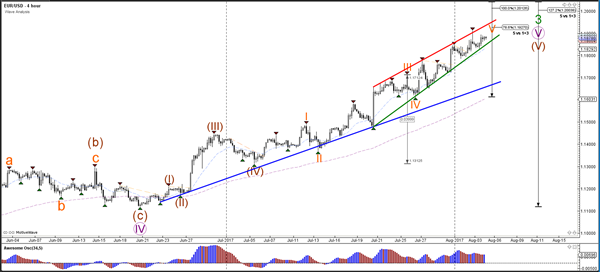
The Non Farm Payroll (NFP) numbers will be released later today for the US, which could significantly impact the US Dollar. The EUR/USD specifically is in an uptrend but could be losing some of its momentum because the angle of resistance trend line (red) is shallower than the support trend line (green). This indicates a mild rising wedge chart pattern, which is a potential reversal pattern. However, this does not stop price from continuing with the trend potentially towards the next target at the round level of 1.20 and Fibonacci targets.
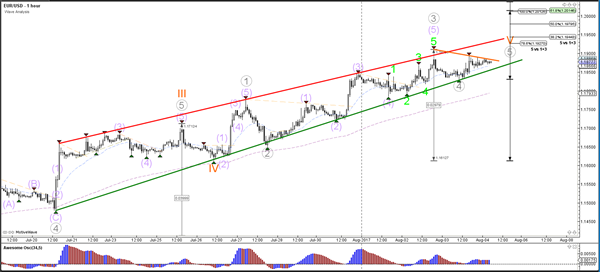
The EUR/USD completed a wave 4 (grey) correction if price manages to break above the resistance trend line (orange). The bullish breakout could see price continue with one more higher high towards the wave 5 (grey) Fib levels.
Currency pair USD/JPY
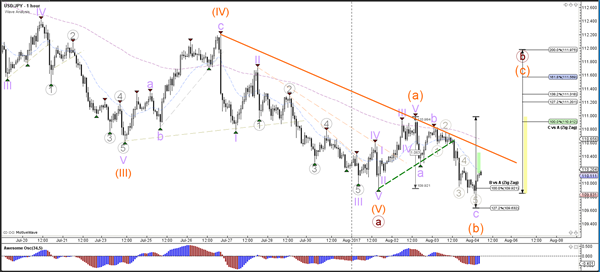
The USD/JPY could show a potential bullish bounce at support to complete a wave B (orange) and start a wave C (orange).
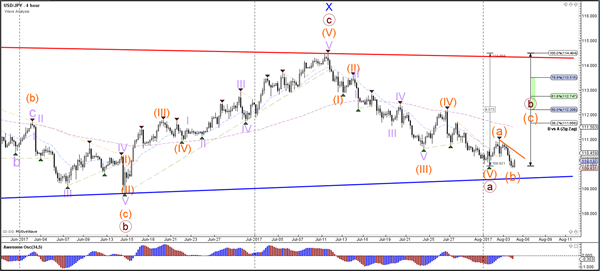
The USD/JPY could have completed 5 waves (grey) within wave C (purple). A bullish breakout above resistance (orange) could see price challenge the Fibonacci targets of wave C vs A (orange).
Currency pair GBP/USD
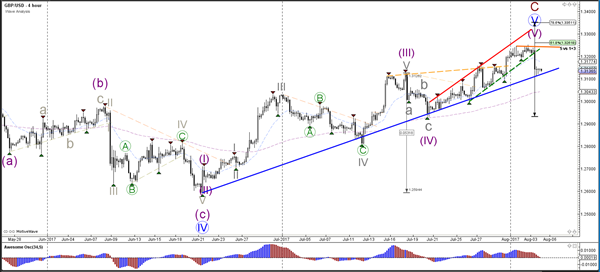
The GBP/USD failed to break above the 1.3250 quarter level and made a bearish reversal during yesterday's interest rate decision by the Bank of England to keep rates at 0.25%. The bearish price action broke below the channel support (dotted green) but stopped at the larger support level. The lack of a bullish break is making a larger wave C (brown) now more likely.
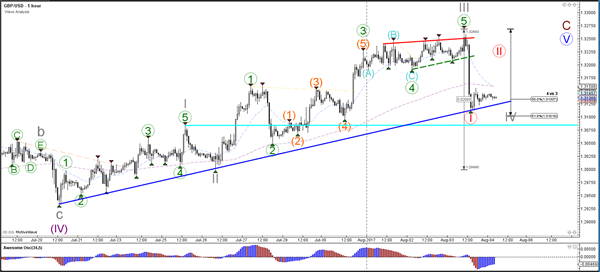
The GBP/USD could potentially be in a bearish correction such as a wave 4 (grey) as long as price stays above the top of wave 1 (grey) indicated by the light blue line. Another valid wave structure could be a wave 1-2 (red) downtrend as the bearish momentum was strong. This would become more likely if price manages to break below the support trend lines (blue) or move correctively upwards as part of wave 2 (red).
Daily Technical Outlook And Review: EUR/USD, GBP/USD, AUD/USD, USD/JPY, USD/CAD, USD/CHF, DOW 30, GOLD
A note on lower timeframe confirming price action...
Waiting for lower timeframe confirmation is our main tool to confirm strength within higher timeframe zones, and has really been the key to our trading success. It takes a little time to understand the subtle nuances, however, as each trade is never the same, but once you master the rhythm so to speak, you will be saved from countless unnecessary losing trades. The following is a list of what we look for:
- A break/retest of supply or demand dependent on which way you're trading.
- A trendline break/retest.
- Buying/selling tails ... essentially we look for a cluster of very obvious spikes off of lower timeframe support and resistance levels within the higher timeframe zone.
- Candlestick patterns. We tend to only stick with pin bars and engulfing bars as these have proven to be the most effective.
We typically search for lower-timeframe confirmation between the M15 and H1 timeframes, since most of our higher-timeframe areas begin with the H4. Stops are usually placed 1-3 pips beyond confirming structures.
EUR/USD
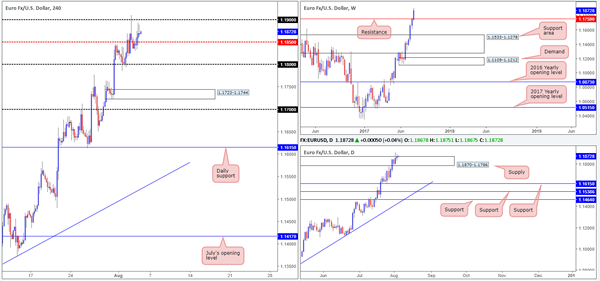
During the course of yesterday's segment, the single currency traded the first half of the London session sub 1.1850. Following a close above this number, however, H4 price retested the line as support and rose to a high of 1.1893 on the day.
Weekly bulls continue to show promise above weekly resistance at 1.1759. Should the major conclude the week closing beyond this line, further buying could take shape up to a weekly resistance planted at 1.2044. Turning our attention to the daily chart, supply at 1.1870-1.1786, although it is still intact, remains vulnerable to the upside. This is not only because of where weekly price is trading and the strong uptrend the EUR is currently entrenched within, but also due to the back-to-back daily spikes seen through the top edge of the daily zone.
Our suggestions: While it is clear that this market remains in a robust position at this time, we are reluctant to consider buying until the noted daily supply has been consumed (by consumed we mean a daily close printed above the area). In addition to this, it would be imprudent of our desk to buy this market when we're still short the GBP/USD!
Data points to consider: US Job's report at 1.30pm GMT+1.
Levels to watch/live orders:
- Buys: Flat (stop loss: N/A).
- Sells: Flat (stop loss: N/A).
GBP/USD
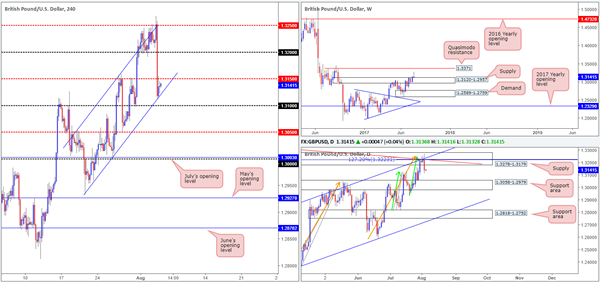
The BoE kept its monetary policy unchanged on Thursday, consequently sending the pair sharply lower. As can be seen from the H4 chart, price bottomed just ahead of the 1.31 handle, buoyed by a channel support line etched from the low 1.2932. As we write, the balance between bids/offers appear to be even between the current channel support and the nearby mid-level resistance at 1.3150.
For those who follow our reports on a regular basis, you may recall that our desk recently took a short position from 1.3209, with conservative stops planted at 1.3280. Our reasoning behind executing a short position from here was strong: daily supply at 1.3278-1.3179, a daily trendline resistance taken from the high 1.3477, a daily channel resistance drawn from the high 1.2903 and two converging daily AB=CD (green/orange arrows) 127.2 Fib extensions at 1.3222/1.3223 (taken from the lows 1.2811/1.2365). Also, for you RSI fans, there was daily divergence in motion, as well. In light of the recent move lower, we have moved the stop-loss order to breakeven.
Our suggestions: In an ideal world, we're looking for the unit to continue pressing lower today, breaking through the H4 channel support line and also the nearby 1.31 handle. Assuming that this comes to fruition, the 1.3050 region will be in sight – a level we'll be looking to take partial profits at given its relationship with the daily support area at 1.3058-1.2979 (the next downside target on the daily scale).
Data points to consider: US Job's report at 1.30pm GMT+1.
Levels to watch/live orders:
- Buys: Flat (stop loss: N/A).
- Sells: 1.3209 ([live] stop loss: breakeven).
AUD/USD
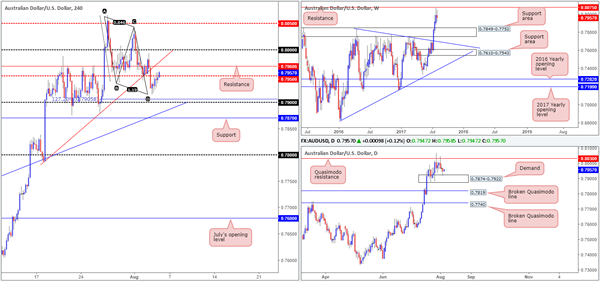
In recent trading, the H4 candles completed an AB=CD measured move at 0.7916, taken from high 0.8065. Leaving the 0.79 handle and its nearby H4 127.2% Fib ext. at 0.7905 unchallenged, the unit inched its way higher yesterday, with price now seen testing the waters beyond the mid-level resistance at 0.7950.
What gives the H4 measured move extra credibility is the daily demand seen marked at 0.7874-0.7922. This could, if the bulls continue to support the pair, lift price back up to the daily Quasimodo resistance at 0.8030. Still, before this can come to realization, the nearby H4 resistance at 0.7968 will need to be cleared.
Our suggestions: Technically speaking, there is not really much to hang our hat on at the moment, as far as trading opportunities. Buying may appear to be a good idea on the daily chart, but with H4 resistance lurking just ahead, we're unwilling to commit. For that reason, our desk will remain on the sidelines for the time being and look to reassess structure following the US job's report.
Data points to consider: RBA Monetary policy statement and Australian Retail sales figures at 2.30am. US Job's report at 1.30pm GMT+1.
Levels to watch/live orders:
- Buys: Flat (stop loss: N/A).
- Sells: Flat (stop loss: N/A).
USD/JPY:
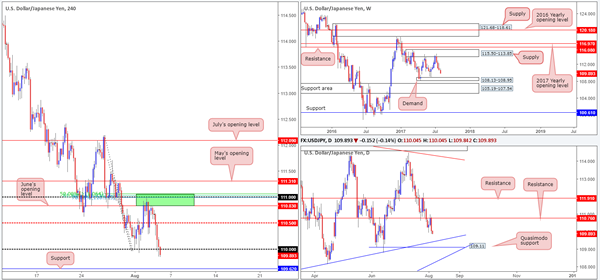
Following a second near-retest of the H4 sell zone marked in green at 111.07/110.83, the USD/JPY plummeted south on Thursday. Comprised of a H4 Fibonacci resistance cluster (50.0%/61.8%/78.6% taken from the highs 112.19/111.71/111.28), June's opening level at 110.83 and a psychological band at 111, this zone was an area of interest to our team. Unfortunately, we were unable to pin down a lower-timeframe entry signal!
As we write, H4 price is trading sub 110 which could lead to the unit challenging support logged in at 109.62. From the weekly timeframe, the market looks as though it could continue to press lower until we reach the small demand base seen at 108.13-108.95. Zooming in and looking at the daily picture, we can see that price recently responded to resistance at 110.76 and now looks poised to test a Quasimodo support at 109.11 (converges closely with a trendline support taken from the low 108.13).
Our suggestions: With the higher-timeframe picture suggesting that further selling could be on the cards, a close below 110 on the H4 chart likely suggests that we're heading down to at least the H4 support mentioned above at 109.62. We would not trade this market short, however, until H4 action retests 110 as resistance and prints a lower-timeframe sell signal thereafter (see the top of this report).Ideally, we want the stop to be no more than 15 pips, so as to aid risk/reward down to the 109.62 region.
Data points to consider: US Job's report at 1.30pm GMT+1.
Levels to watch/live orders:
- Buys: Flat (stop loss: N/A).
- Sells: Watch for H4 price to close below 110 and then look to trade any retest seen thereafter ([waiting for a lower-timeframe entry to form following the retest is advised] stop loss: dependent on where one confirms the level).
USD/CAD
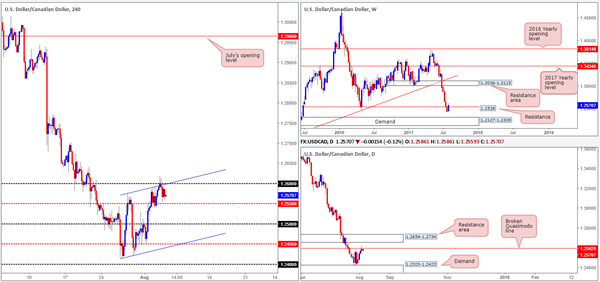
The USD/CAD failed to sustain gains beyond the 1.26 handle and its converging H4 channel resistance (extended from the high 1.2576) on Thursday, resulting in the market closing mid-range between 1.26 and the H4 mid-level support pegged at 1.2550. Of particular interest here is the daily broken Quasimodo line at 1.2592, as it is positioned just beneath 1.26. Also noteworthy is the weekly resistance line coming in a little lower on the curve at 1.2538. This – coupled with the trend on this pair pointing to the downside – we believe the bears likely have the upper hand at this time.
Our suggestions: Watch for H4 price to close beneath the mid-level support at 1.2550 today. This – followed up with a retest and a H4 bearish candle – preferably a full, or near-full-bodied candle, would, in our opinion, be enough evidence to sell. Should the trade come to fruition, the ultimate take-profit target would, for us, be the neighboring H4 channel support etched from the low 1.2413, which happens to converge closely with the top edge of a daily demand base at 1.2303-1.2423 (the next downside target on that scale).
Data points to consider: US/Canadian Job's report at 1.30pm GMT+1.
Levels to watch/live orders:
- Buys: Flat (Stop loss: N/A).
- Sells: Watch for H4 price to close below 1.2550 and then look to trade any retest seen thereafter ([waiting for a H4 bearish candle to form [preferably a full-bodied candle] following the retest is advised] stop loss: ideally beyond the candle's wick).
USD/CHF
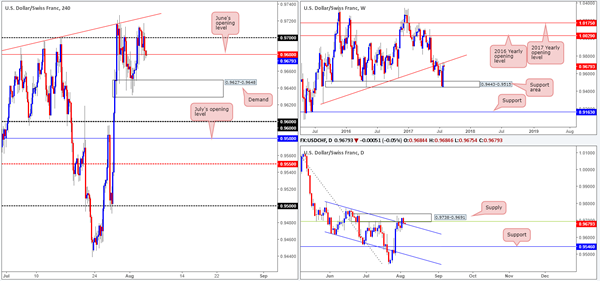
Working our way down from the top this morning, weekly flow remains kissing the underside of a major weekly trendline resistance extended from the low 0.9257. In the event that the bears punch lower from here, the next downside target is likely to be the weekly support area logged at 0.9443-0.9515. Down on the daily picture, we can see that price continues to be capped by a supply zone at 0.9738-0.9691, which converges with a channel resistance extended from the high 0.9808 and a 38.2% Fib resistance at 0.9693 taken from the high 1.0099. Of late, however, the bulls closed above the said channel resistance, and are in the process of retesting the line as support.
Across on the H4 chart, June's opening level at 0.9680 is currently seen in the mix. A violation of this line would likely place the demand area at 0.9627-0.9648 in the spotlight.
Our suggestions: With the recent (daily) close above the aforementioned daily channel resistance, this could suggest that the current daily supply may be weakening. Although the downside is still favored at the moment, it is a difficult market to sell. Not only because of the current daily channel support, but also due to June's opening level at 0.9680 and the nearby H4 demand base at 0.9627-0.9648. For that reason, we'll remain on the sidelines and wait for further developments post today's US job's report.
Data points to consider: US Job's report at 1.30pm GMT+1.
Levels to watch/live orders:
- Buys: Flat (stop loss: N/A).
- Sells: Flat (stop loss: N/A).
DOW 30
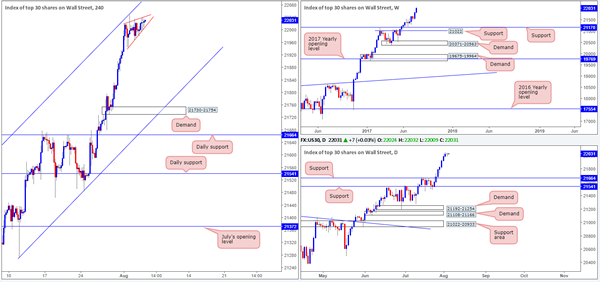
Of late, the US equity market entered into a phase of rising compression between two converging H4 trendlines (21942/22019). This came after price shook hands with a H4 channel resistance extended from the high 21493. Could this be the bears making an appearance? While this is a possibility, one has to remain conscious of the surrounding landscape. Both weekly and daily action shows absolutely no resistance on the horizon given that the index is trading at record highs at the moment. The flip side to this, however, is the closest support on the bigger picture does not come into play until daily support at 21664, so should the market selloff, there's not much in the way to stop it!
Our suggestions: Although there is a chance that this market may head south, we would not feel comfortable selling the recent move north seeing as it is shaped by seven strong consecutive daily bull candles!
Data points to consider: US Job's report at 1.30pm GMT+1.
Levels to watch/live orders:
- Buys: Flat (stop loss: N/A).
- Sells: Flat (stop loss: N/A).
GOLD
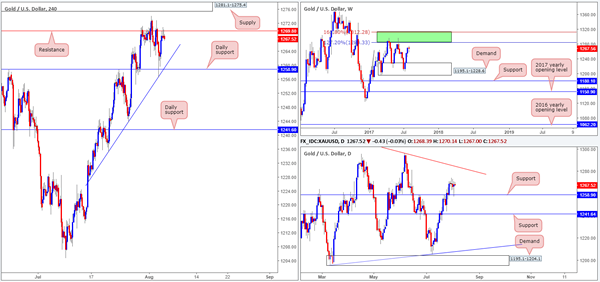
In recent trading, the yellow metal challenged the daily support level at 1258.9 that happened to blend nicely with a H4 trendline support taken from the low 1235.1. The move from here, as you can see, lifted bullion back up to the H4 resistance pegged at 1269.8, which for now is doing a good job of holding the unit lower.
According to the daily timeframe, the bounce from the noted support could lead to a move being seen up to a daily trendline resistance extended from the high 1337.3. What's also notable here is the daily trendline intersects beautifully with a weekly area comprised of two Fibonacci extensions 161.8/127.2% at 1312.2/1284.3 taken from the low 1188.1 (green zone – the next upside target on the weekly scale).
Our suggestions: With both the weekly and daily timeframes showing room for the bulls to stretch their legs, we would be very cautious selling the current H4 resistance. Buying on the other hand, although you'd be trading in-line with weekly and daily flow, would entail buying into H4 supply seen beyond the current H4 resistance at 1281.1-1275.4. Therefore, our strategy for the time being is to lay low and assess structure following the US job's report scheduled to be released later on today.
Levels to watch/live orders:
- Buys: Flat (stop loss: N/A).
- Sells: Flat (stop loss: N/A).
Oil And Gold Sleepy Pre NFP
NFP data this evening squashes volatility in Asia as traders adopt and sit and wait approach.
Crude Oil
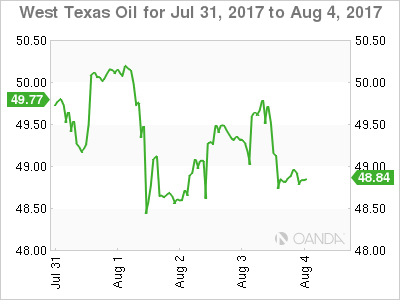
Caution seemed to be the catchword in oil markets overnight. Traders were unwilling to add substantial risk approaching the weekend, and both Brent and WTI spot contracts had a quiet session with both falling approximately 50 cents from the previous day. Having had such a strong run higher in the last two weeks, contradictory inventory data this week and apparent record high OPEC production seemed to have sapped the appetite for upside risk for now.
Oil most likely remains vulnerable to more sell side profit taking into the weekend as traders chose to lock in profits in a sideways market.
Brent spot trades at 51.75 this morning, just above its 200-day average at 51.425. It remains locked between its triple top at 52.70 and support in the 50.45/65 regions, its 50% Fibonacci retracement and the 100-day average.
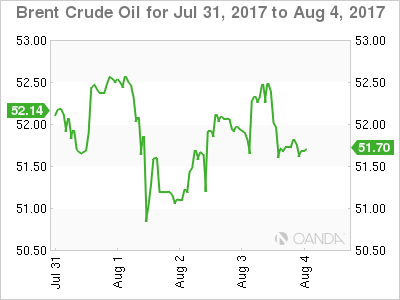
WTI spot trades at 48.90 this morning and its likewise ranging between major support and resistance. Resistance being the double top at 50.30 with support being in the 47.75/48.20 zone, containing its 50% retracement and the 100-day average.
Gold
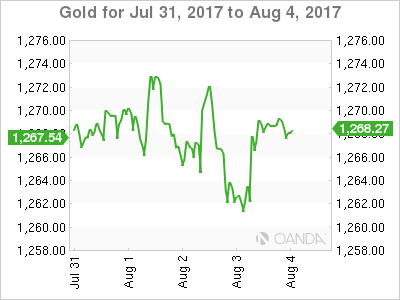
Position squaring ahead of today’s Non-Farm Payrolls data also seems to be pervading both currency and stock markets with gold also no exception. Sellers locking in profits saw gold drop 10 dollars to 1256.00 at one stage, before recovering strongly to finish slightly higher than its open at 1268.75.
We expect gold to trade entirely of the nuances of the U.S. dollar into the data moving inversely to dollar strength of weakness in what may be a somewhat directionless Asia session today.
Gold trades almost unchanged at 1267.75 in early Asia. Resistance is initially at 1274.20 ahead of a double top around 1282.00. Support should appear in the first instance at 1262.50 before yesterday’s low of 1256.00, ahead of the much more significant 100-day moving average at 1252.65.
Is The Dow Ignoring The Coming Tightening Cycle?
Key Points:
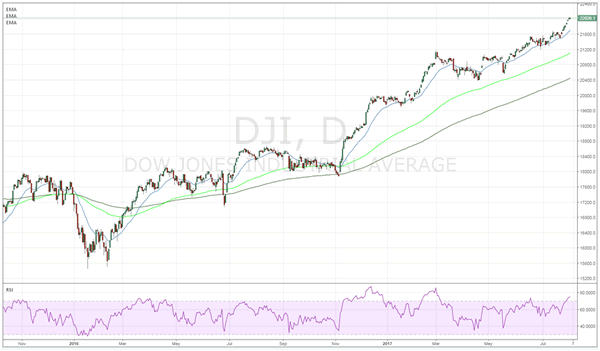
- DJIA breaches 22,000 level and continues to move higher.
- Market may be underestimating the impact of either a tightening or tapering phase.
- Keep a close watch on Federal Reserve policy and sentiment in the near term.
The Dow Jones Industrial Average recently crossed the mythical 22,000 mark in open defiance of potential monetary tightening coming from the U.S. Federal Reserve. As many of you may know, there is a direct negative correlation between interest rates and equity prices so it's especially surprising to see the Dow forging ahead despite all the expectation setting for either a rate hike or a taper. Subsequently, it begs the question as to whether equity investors completely lost their minds…or do they know something the rest of us do not.
At a guess, maybe equity investors have little faith in the Fed's ability to follow through on their threats of a massive balance sheet taper given the lack of strong inflationary pressures. On this point, they may be correct given that the Fed has a poor track record of telling the truth when it comes to setting forward expectations.
However, although inflation has recently dipped, it was largely due to a fall in crude oil and energy prices and really didn't impact the PCE Deflator or the Core very much. So there are still building inflationary pressures, as well as a strong disconnect between the public and the Fed, that provides a relatively dangerous environment for equity prices.
Subsequently, there is a real risk that if the Federal Reserve does indeed embark upon a cycle of either interest rate hikes, or balance sheet reduction, that a sharp fall in U.S. equities would soon follow. This presents a relatively real risk to U.S. equity valuations given the historically high levels that the DJIA currently resides at.
Ultimately, U.S. equity markets have been fuelled by loose monetary policy and a drive towards yields for some time and many working within the advisory space in this sector have never traded through a bear market. Subsequently, all the ingredients are there for a significant revaluation in the coming months. The reality is that, without an economic shock, the central bank is likely to be under pressure to commence reducing their balance sheet overhang in the coming months. Given the amount of expectation setting that the FOMC has been doing this year it's almost guaranteed that they will act decisively in some way lest their credibility become at risk. Subsequently, it's a matter of when, not if, we eventually move towards lift off. So watch this space!
Market Morning Briefing: A Worse Than Expected Reading Of US ISM Manufacturing Index Keeps Dollar Index Weak
STOCKS
Dow (22026.10, +0.04%) is stable near current levels. But it could move up slowly towards 22500 from where some rejection is possible. Dax (12154.72, -0.22%) on the other hand is stuck within the 12350-12080 region for the last 8-9 sessions and could continue for a few more sessions. There is some scope of coming off towards 12000 in the next few sessions.
Shanghai (3280.92, +0.24%) needs to sustain above 3300 in order to continue moving up. Else a corrective dip towards 3200 is possible in the coming sessions. Trend remains firmly up. Nikkei (19956.58, -0.36%) continues to remain in the sideways consolidation and lacks directional clarity just now. We need to wait for a few more sessions to get some cue on whether it would move above 20200 or come down below 19900.
Nifty (10013.65, -0.67%) is clearly coming off from the resistance visible on the 3-day charts. It could now come off towards 9900 as mentioned yesterday.
COMMODITIES
Gold (1267) is struggling to rise above the 1270-75 regions and only a break above that may open up the higher target of 1295. Crucial supports are poised at 1258 and 1245 levels. In case the Support at 1245 breaks, there will be a further dip to 1230 and 1210 levels respectively. Silver (16.66) stands comparatively strong due to the recent strength in copper prices. Immediate resistance poised at 17 levels. Only a close below 16.50 could open up 16.20 and 15.90 levels respectively. We might see significant fall in Silver if there will be any short term price correction in Copper towards sub 2.85 levels.
Muted price action has been seen in Copper (2.88). Midterm resistance comes at 3.12 regions from where we may see some correction due to profit taking. We will remain bullish on copper while it is trading above 2.78 regions.
Brent (51.90) and WTI (48.94) are trading within the ranges of 48-53 and 47.60-49.50 respectively. We might see some weekend profit booking at current levels, but we will remain bullish on Brent and WTI, while they are trading above 48.70 and 45.50 levels on a weekly closing basis.
FOREX
A worse than expected reading of US ISM manufacturing index keeps Dollar Index (92.78) weak and on track to its downside target of 92.00. Euro (1.1875) is seeing a narrow range day as the wait for the US NFP data goes on. A weak US NFP data would be beneficial for Euro to test 1.20 and push Dollar Index to 92.00.
Dollar-Yen (110.14) faced a sharp rejection from exactly our resistance of 111.00-10 to test sub-110.00 levels. In the near term, a trending move can be expected next week but only on a break from the range of 109.30-111.10. Otherwise, the pair may oscillate in this range for a few more days before a breakout.
BOE kept the rates unchanged but a cut in the GDP and wage growth projection triggered a sharp decline in Pound (1.3139) taking it to the near term support of 1.3100. A recovery can be expected if it manages to stay above 1.3100-1.3050. There is an equal probability of a breakdown below 1.3050 signaling a top at 1.3260. Wait and watch.
Aussie (0.7970) continues its consolidation mode in the range of 0.7875-0.8050 which may continue for a few more sessions. The larger trend remains up and the higher targets of 0.8100-70 remain unchanged.
Dollar Rupee (63.70) closed flat at 63.70 after making an intra-day low of 63.55 as expected. There are chances of testing lower levels of 63.30/25 in the coming sessions while price remains below 63.95.
INTEREST RATES
The US yields have fallen and could move down in the coming sessions to test respective supports. The 5Yr (1.79%), 10Yr (2.23%) and the 30Yr (2.80%) are all trading lower from previous levels of 1.82%, 2.26% and 2.85%; and could test supports near 1.70%, 2.10% and 2.60% respectively. Near term looks bearish.
The UK-US 10Yr (-1.08%) has fallen and could test support near -1.13% from where a bounce back is possible.
NZD/USD Downside Paused
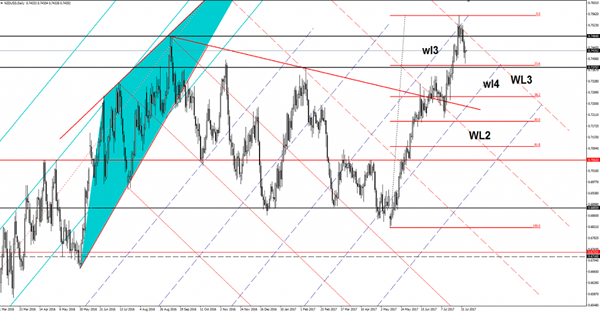
Price edged lower on Thursday, but failed to reach the 23.6% retracement level and the 0.7375 static support. Maintains a bullish perspective, despite the minor decrease, could bounce back if the support will hold. Only a valid breakdown below the mentioned support levels will open the door for more declines. We may have a minor consolidation here before will start a significant move.
USD/CHF More A Buy Than A Sell
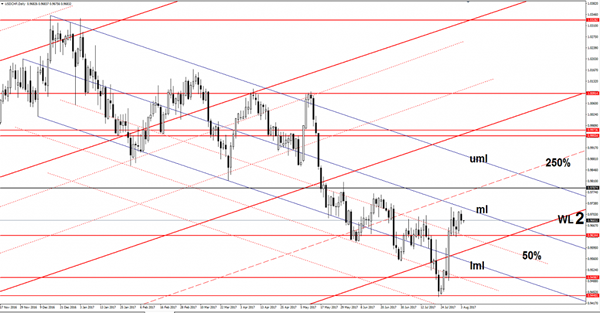
USD/CHF decreased in the last session, but maintains a chance to reach new high in the upcoming period. Could decrease to retest the 0.9634 static support before will try to take out the dynamic resistance from the median line (ml). I’ve said in a previous report that we may see a minor consolidation above the 0.9634 level before the rate will have enough energy to jump much higher.
USD/JPY Additional Drops On The Cards
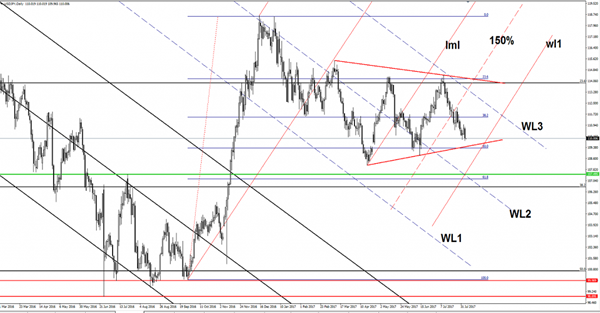
The USD/JPY dropped significantly on Thursday and erased the last two day's gains, should touch new lows because the Nikkei stock index is still expected to drop in the next days. Price moves sideways on the Daily chart, but I hope that we'll have a clear direction very soon.
It is expected to breakout from the symmetrical triangle, but remains to see the direction. A breakdown looks imminent at this moment because the Yen could dominate the currency market if the JP225 will drop towards the 19700 major static support.
Technically and Nikkei's drop is natural after another failure to stabilize above the 20058 long term horizontal resistance. The Japanese currency will appreciate aggressively versus the other major currencies if the Nikkei will drop below the 19700 major static support (resistance turned into support).
Japan is releasing the Average Cash Earning later, which is expected to rise by 0.5% in June, less versus the 0.6% growth in the former reading period. We may have some volatility in the afternoon as the US will publish some high impact data.
USD/JPY move within a symmetrical triangle, should hit the downside line of this pattern in the upcoming hours and the 50% retracement level. Support can be found also at the warning line (wl1) of the minor ascending pitchfork. A valid breakdown below the mentioned support levels will open the door for more declines in the upcoming weeks, only a rejection along with a JP225 increase will send the rate higher again.
Price is trading right below the 110.00 psychological level, but we'll see how will reach when will touch the mentioned support levels.
Cable Demolished By Dovish BOE
Pound Trading In The Red
The Cable has taken a hit from the BOE today, as you already know, the Official Bank Rate was left unchanged, at 0.25%, matching expectations. The interest rate remains steady since August 2016 when was decreased from 0.50%. The MPC members voted by a majority of 6 to 2 for this decision, the Pound plunged versus all its major rivals after this decision, the bulls were disappointed.
BOE maintains unchanged the Asset Purchase Facility, at 435B, matching expectations, the MPC members voted unanimously for this decision. BOE Carney sustained that the economic growth will remain sluggish and also that some tightening will be needed in the upcoming three years.
The Pound has turned to the downside even if the United Kingdom Services PMI increased from 53.4 to 53.8 points, beating the 53.6 estimate and signaling a further expansion.
USD Uninspired By US Figures
US dollar remains sluggish after the United States data publication, the figures have come in mixed and weren’t able to boost the currency. Unfortunately, the greenback lost some ground versus its rivals in the second part of the day also because the ISM Non-Manufacturing PMI plunged from 57.4 to 53.9 points, has come much below the 56.9 estimate.
The Unemployment Claims dropped again after one week increase, were reported at 240K in the previous week, below the 242K estimate and much below the 245K in the former reading period, while the Factory Orders surged by 3.0% in June, beating the 2.9% estimate, the orders rallied after the 0.3$ drop in May. Moreover, the Final Services PMI surged from 54.2 to 54.7 points, exceeding the 54.2 estimate, the Challenger Job Cut dropped by 37.6%, more versus the 19.3% drop in the former reading period, but failed to help the dollar to stay higher against its counterparts.
USDJPY – Reverses Gains, Set To Weaken Further
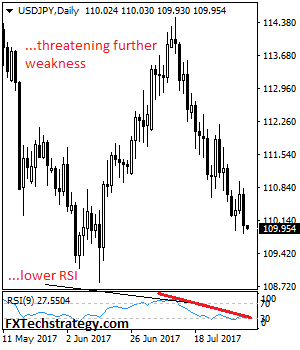
USDJPY - With the pair taking back its gains to close lower on Thursday. On the downside, support comes in at the 109.50 level where a break if seen will aim at the 109.00 level. A cut through here will turn focus to the 108.50 level and possibly lower towards the 108.00 level. Its daily RSI is bearish and pointing lower suggesting further weakness. On the upside, resistance resides at the 110.50 level. Further out, we envisage a possible move towards the 111.00 level. Further out, resistance resides at the 111.50 level with a turn above here aiming at the 112.00 level. On the whole, USDJPY looks to weaken further short term.