

Sample Category Title
Elliott Wave Analysis: GBPUSD Making A Sharp Drop
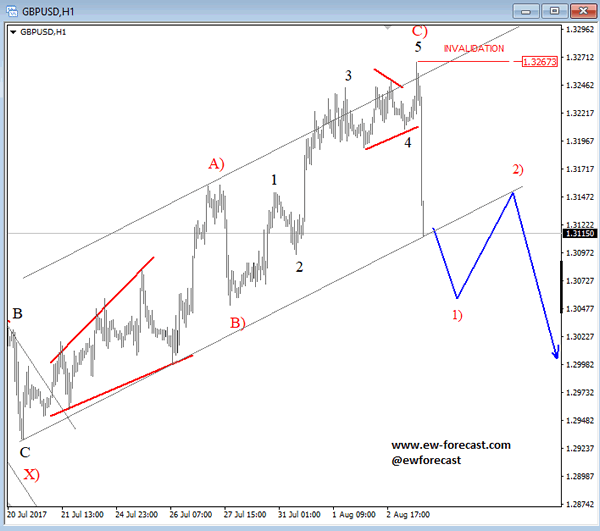
Cable is coming sharply off its highs after BOE left interest rates unchanged. Two members voted for a hike and 6, including the Governor, voted to leave them unchanged. Technically, this drop has been expected to occur from a new high, and it seems that top is now in place if we consider very strong 150 pip fall. Ideally that is begging of some bigger sell-off, but I would still like to see a broken trendline support and then maybe pay a close attention to wave 2) pullback, sometime after NFP.
GBPUSD, 1H
Trade Idea: USD/CAD – Sell at 1.2690
USD/CAD - 1.2600
Recent wave: Only wave v of c has ended at 0.9407 and wave C of major A-B-C correction is underway with wave iii ended at 1.4690, wave v of C may bring one more marginal rise probably in 2018
Trend: Down
Original strategy :
Sell at 1.2690, Target: 1.2490, Stop: 1.2750
Position: -
Target: -
Stop: -
New strategy :
Sell at 1.2690, Target: 1.2400, Stop: 1.2750
Position: -
Target: -
Stop:-
As the greenback found good support just above last week’s low at 1.2414 and has rebounded, retaining our view that further consolidation would take place and another corrective bounce to 1.2640-50 cannot be ruled out, however, as this move is viewed as retracement of recent decline, reckon 1.2700-05 would limit upside and bring another decline later, below 1.2500 would bring test of said support at 1.2414 but break there is needed to signal downtrend has resumed and extend weakness to 1.2400, then towards 1.2350-60. We are keeping our count that wave v as well as wave (C) ended at 1.3794 and impulsive wave (i ii, i ii) is now unfolding with minor wave iii still in progress, hence bearishness remains for this fall to extend weakness to aforesaid downside targets.
In view of this, would not chase this fall here and would be prudent to sell the pair again on recovery as 1.2690-95 should limit upside. Above 1.2745-50 would defer and risk a stronger rebound to 1.2800-10 but only break of latter level would signal a temporary low is formed instead, bring retracement of recent decline to 1.2850, then 1.2900, however, price should falter below 1.3000 and the greenback shall head south again from there.
To recap, wave B from 1.3066 is unfolding as an a-b-c and is sub-divided as a: 1.2192, b: 1.2716 and wave c is a 5-waver with i: 1.1983, ii: 1.2506, extended wave iii with minor iii at 1.0206, wave iv ended at 1.0781 and wave v as well as wave iii has ended at 0.9931, hence the subsequent choppy trading is the wave iv which is unfolding as (a)-(b)-(c) with (a) leg of iv ended at 1.0854, followed by (b) leg at 1.0108 and (c) leg as well as the wave iv ended at 1.0674. The wave v is sub-divided by minor wave (i): 0.9980, (ii): 1.0374, (iii): 0.9446, (iv): 0.9913 and (v) as well as v has possibly ended at 0.9407, therefore, consolidation with upside bias is seen for major correction, indicated target at 1.3700 and 1.4000 had been met and further gain to 1.4700 would be seen later.

GBP/USD Mid-Day Outlook
Daily Pivots: (S1) 1.3191; (P) 1.3221; (R1) 1.3252; More...
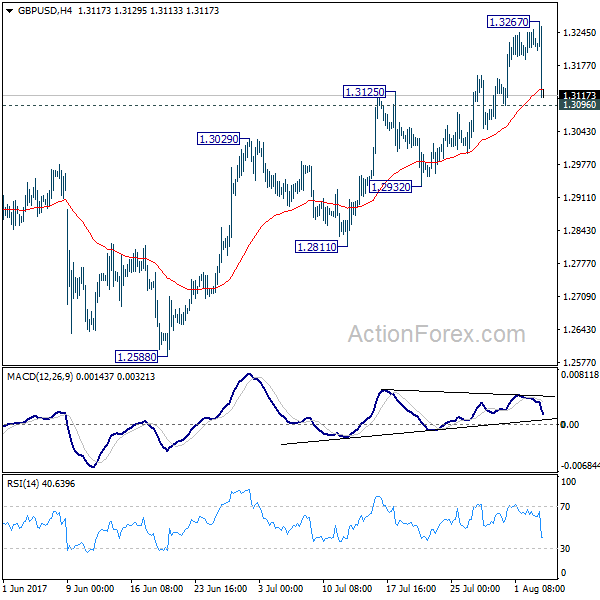
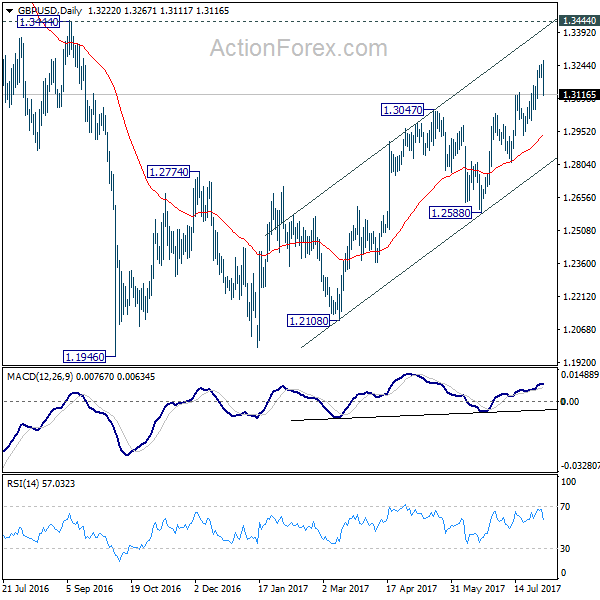
GBP/USD drops sharply after hitting 1.3267 but it's staying above 1.3096 minor support. Intraday bias is neutral first. Overall, price actions from 1.1946 are viewed as a corrective pattern. Considering bearish divergence condition in 4 hour MACD, break of .3096 will be the first sign of reversal. Intraday bias will be turned back to 1.2932 support first in that case. Break of 1.3267 will extend the rise. But, we'll look for topping signal again around 1.3444 key resistance.
In the bigger picture, overall, price actions from 1.1946 medium term low are seen as a corrective pattern that is still in progress. While further upside is expected, larger outlook remains bearish as long as 1.3444 key resistance holds. Down trend from 1.7190 (2014 high) is expected to resume later after the correction completes. And break of 1.2588 will indicate that such down trend is resuming.
EUR/GBP Surged above 0.9000 after BoE
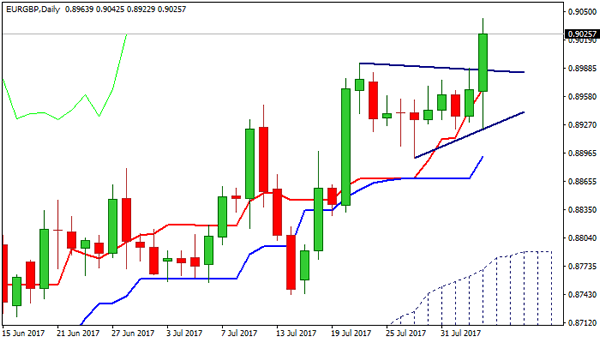
The Euro surged above 0.9000 barrier against the pound after BoE rate hike vote of 6-2 vs expected 5-3 configuration disappointed markets and sent sterling lower. Fresh rally came ticks ahead of target at 0.9048 (02 Nov 2016 high) and also approached 0.9069 resistance (Fibo 76.4% of 0.9305/0.8304 descend). Completion of bullish pennant pattern on daily chart generated positive signal for bullish continuation of broader recovery from 0.8300 double-bottom, where a higher base was formed on weekly chart. Bulls need clear break above 0.9048/69 pivots to trigger further extension higher and expose key med-term barrier at 0.9305 (07 Oct 2016 spike high). Former top at 0.8994 (posted on 21 July) marks initial support, followed by rising Tenkan-sen (0.8966) and 10SMA (0.8955), which underpin the action and should contain dips.
Res: 0.9048; 0.9069; 0.9098; 0.9137
Sup: 0.8994; 0.8966; 0.8955; 0.8922
EUR/USD Mid-Day Outlook
Daily Pivots: (S1) 1.1795; (P) 1.1853 (R1) 1.1912; More...
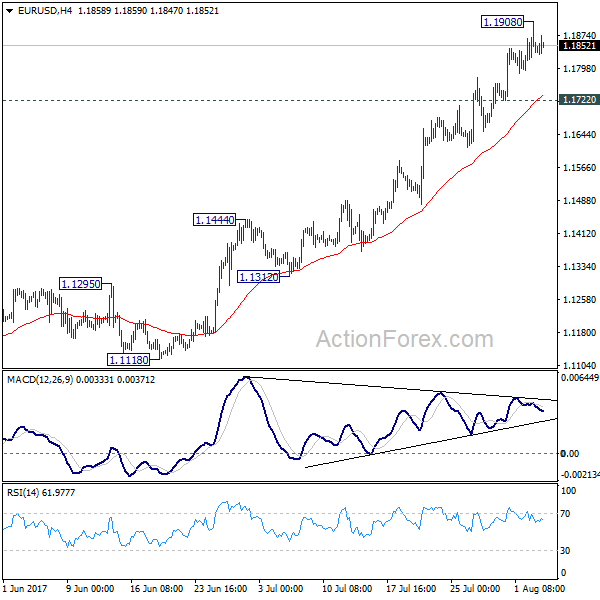
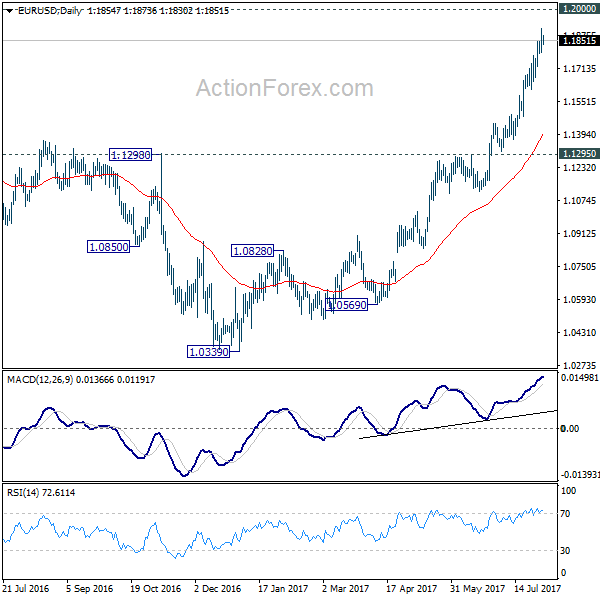
Intraday bias in EUR/USD remains neutral for consolidation below 1.1908 temporary top. Another rise is expected as long as 1.1722 support holds. Above 1.1908 will target 1.2 psychological level. Considering bearish divergence condition in 4 hour MACD, we'll be cautious on topping around there to bring correction. On the downside, break of 1.1722 will indicate short term topping and bring deeper pull back to 55 day EMA (now at 1.1379).
In the bigger picture, an important bottom was formed at 1.0339 on bullish convergence condition in weekly MACD. Sustained break of 55 month EMA (now at 1.1760) will pave the way to key fibonacci level at 38.2% retracement of 1.6039 (2008 high) to 1.0339 (2017 low) at 1.2516. While rise from 1.0339 is strong, there is no confirmation that it's developing into a long term up trend yet. Hence, we'll be cautious on strong resistance from 1.2516 to limit upside. But for now, medium term outlook will remain bullish as long as 1.1295 support holds, in case of pull back.
Trade Idea Update: USD/CHF – Buy at 0.9600
USD/CHF - 0.9697
Original strategy :
Buy at 0.9600, Target: 0.9700, Stop: 0.9565
Position : -
Target : -
Stop : -
New strategy :
Buy at 0.9600, Target: 0.9700, Stop: 0.9565
Position : -
Target : -
Stop : -
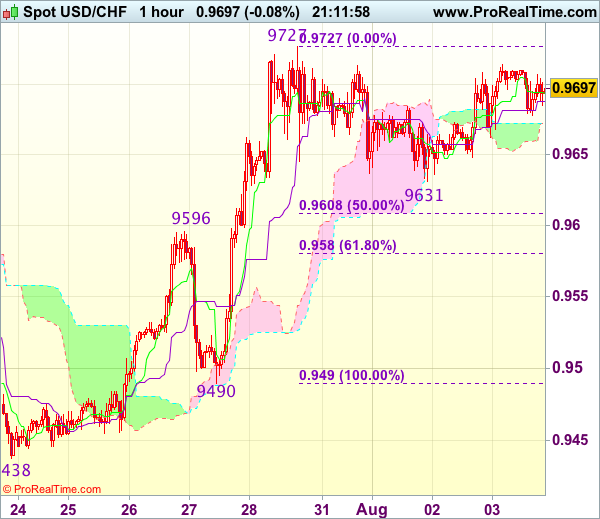
Although the greenback rebounded after finding support at 0.9631, break of indicated resistance at 0.9727 is needed to signal recent upmove has resumed and extend gain to 0.9750-60, then 0.9780, however, near term overbought condition should limit upside to 0.9800-10, bring retreat later. If said resistance at 0.9727 continues to hold, then further consolidation would take place and another retreat to 0.9650 and 0.9631 cannot be ruled out but 0.9596 (previous resistance turned support) should limit downside and bring another rise later.
In view of this, would not chase this rise here and would be prudent to buy dollar on subsequent pullback as previous resistance at 0.9596 should turn into support and contain dollar’s downside. Below 0.9580 (61.8% Fibonacci retracement of 0.9490-0.9727) would defer and suggest a temporary top is formed instead, bring correction to 0.9540-50 but price should stay well above support at 0.9490, bring another rise later.
USD/CHF Mid-Day Outlook
Daily Pivots: (S1) 0.9664; (P) 0.9689; (R1) 0.9735; More...
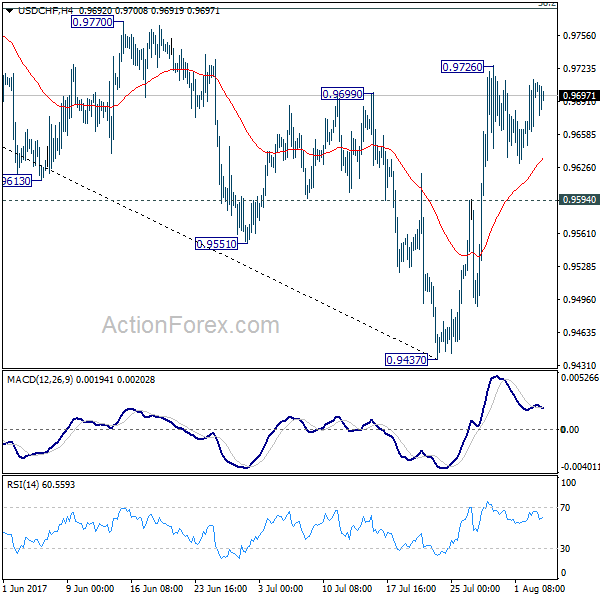
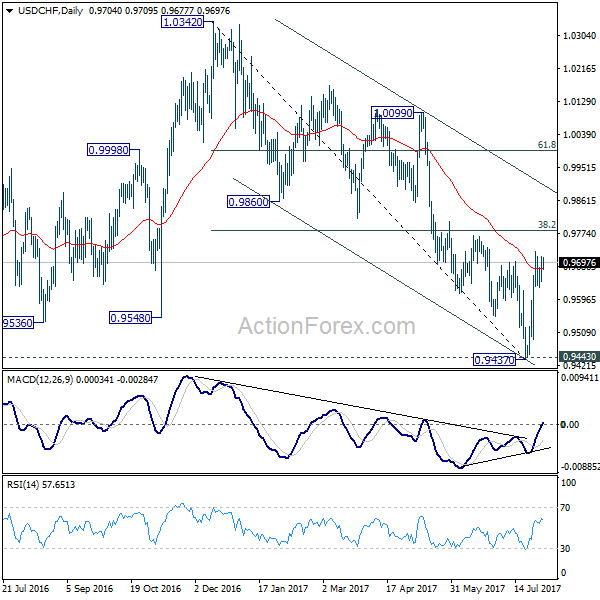
USD/CHF remains bounded in range below 0.9726 and intraday bias remains neutral for the moment. Another rise is expected as long as 0.9594 support holds. Prior break of 0.9699 resistance suggests near term reversal after defending 0.9443 key support. Above 0.9726 will target 38.2% retracement of 1.0342 to 0.9437 at 0.9783 first. Break will target channel resistance (now at 0.9899). However, firm break of 0.9594 will dampen this bullish view and turn bias back to the downside for 0.9437.
In the bigger picture, current development argues that USD/CHF has successfully defended 0.9443 key support level. And long term range trading in 0.9443/1.0342 is extending with another rise. At this point, there is no sign of an up trend yet. Hence, while further rise is expected in USD/CHF, we'll start to be cautious on loss of momentum above 61.8% retracement of 1.0342 to 0.9437 at 0.9996.
Trade Idea Update: GBP/USD – Exit long entered at 1.3130
GBP/USD - 1.3130
Original strategy :
Bought at 1.3130, Target: 1.3230, Stop: 1.3095
Position : - Long at 1.3130
Target : - 1.3220
Stop : - 1.3095
New strategy :
Exit long entered at 1.3130,
Position : - Long at 1.3130
Target : -
Stop : -
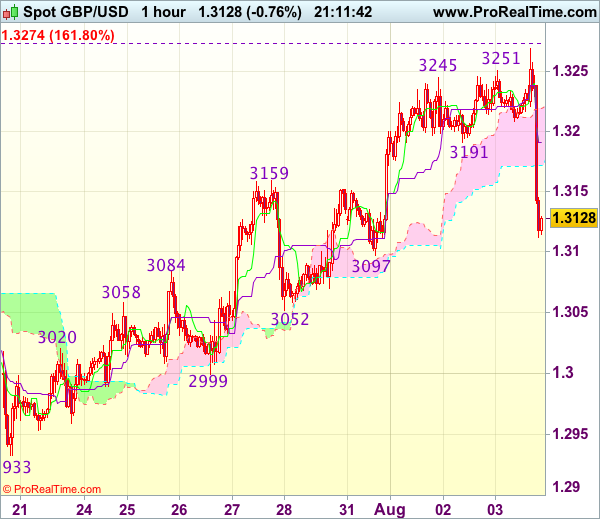
Despite intra-day brier rise to 1.3269, lack of follow through buying and current selloff suggests an intra-day top has been formed and consolidation with downside bias is seen for test of support at 1.3097, however, break there is needed to add credence to this view, bring retracement of recent upmove to 1.3070-75 and later towards support at 1.3052 but price should stay well above support at 1.2999, bring another rise later.
In view of this, would be prudent to exit long entered at 1.3130 and stand aside in the meantime. Above 1.3170-75 would bring recovery to 1.3200, however, as temporary top has been formed at 13269, reckon upside would be limited to 1.3220-30 and price should falter well below resistance at 1.3269, bring another retreat later.
USD/JPY Mid-Day Outlook
Daily Pivots: (S1) 110.33; (P) 110.66; (R1) 111.06; More....
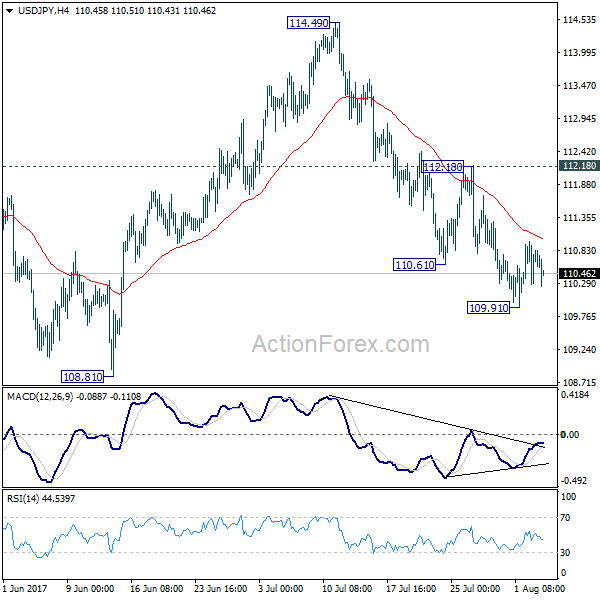
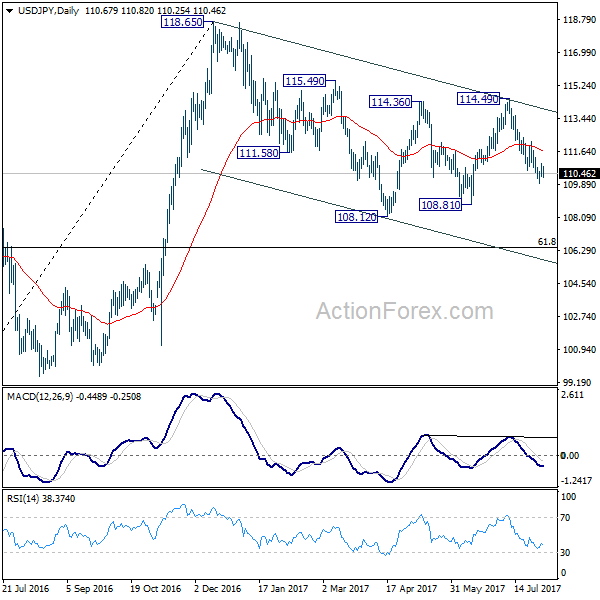
USD/JPY's consolidation from 109.91 is still in progress and intraday bias stays neutral at this point. As long as 112.18 remains intact, outlook stays bearish for deeper fall. Below 109.91 will target 108.81 support first. Break there will resume whole correction from 118.65 and target 61.8% retracement of 98.97 to 118.65 at 106.48. Nonetheless, break of 112.18 resistance will dampen our bearish view and turn focus back to 114.49 resistance instead.
In the bigger picture, the corrective structure of the fall from 118.65 suggests that rise from 98.97 is not completed yet. Break of 118.65 will target a test on 125.85 high. At this point, it's uncertain whether rise from 98.97 is resuming the long term up trend from 75.56, or it's a leg in the consolidation from 125.85. Hence, we'll be cautious on topping as it approaches 125.85. If fall from 118.65 extends lower, down side should be contained by 61.8% retracement of 98.97 to 118.65 at 106.48 and bring rebound.
Comments on the Sterling, after the Bank of England Leaves Interest Rates at a Record Low
Sterling was in trouble during Thursday's trading session, with prices crashing towards 1.3120 after the Bank of England left interest rates at a record low of 0.25% in August's policy meeting. The unsavory combination of uninspiring UK economic data in July and uncertainty surrounding Brexit talks, has pressured BoE hawks and dented expectations of a rate hike occurring anytime soon.
With the central bank downgrading its UK GDP growth forecast for both this year and 2018, Sterling is poised for further punishment down the road. Inflation estimates were also lowered to 2.58% next year, while the forecast for wage growth in 2018 and 2019 was trimmed to 3% and 3.25%, respectively.
With political uncertainty, soft economic fundamentals and ongoing Brexit concerns weighing heavily on the UK economy, investors may start to question whether the BoE moves forward with raising rates in 2018. The sharp depreciation of the British Pound following the interest rate decision continues to highlight how the currency has become increasingly reactive to monetary policy speculations.
From a technical standpoint, the GBPUSD bulls have been living on borrowed time and using Dollar weakness as a foundation to elevate prices. With Sterling bears inspired by BoE doves, the GBPUSD is likely to trade towards 1.3000 once 1.3100 is conquered.