Sample Category Title
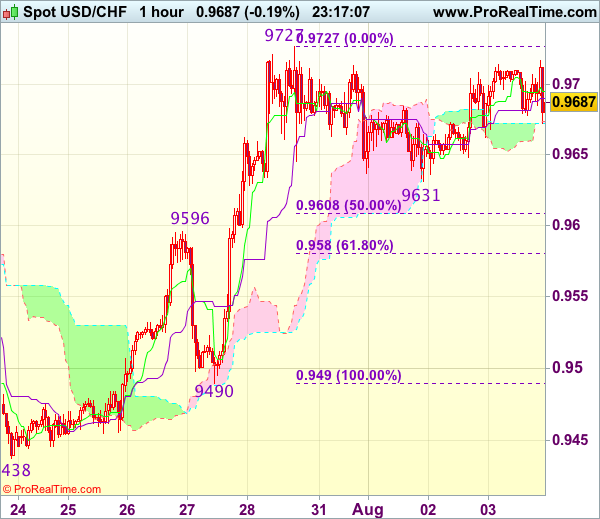
Trade Idea Wrap-up: USD/CHF – Buy at 0.9600
USD/CHF - 0.9688
Most recent candlesticks pattern : N/A
Trend : Near term up
Tenkan-Sen level : 0.9695
Kijun-Sen level : 0.9690
Ichimoku cloud top : 0.9674
Ichimoku cloud bottom : 0.9672
Original strategy :
Buy at 0.9600, Target: 0.9700, Stop: 0.9565
Position : -
Target : -
Stop : -
New strategy :
Buy at 0.9600, Target: 0.9700, Stop: 0.9565
Position : -
Target : -
Stop : -
Although the greenback rebounded after finding support at 0.9631, break of indicated resistance at 0.9727 is needed to signal recent upmove has resumed and extend gain to 0.9750-60, then 0.9780, however, near term overbought condition should limit upside to 0.9800-10, bring retreat later. If said resistance at 0.9727 continues to hold, then further consolidation would take place and another retreat to 0.9650 and 0.9631 cannot be ruled out but 0.9596 (previous resistance turned support) should limit downside and bring another rise later.
In view of this, would not chase this rise here and would be prudent to buy dollar on subsequent pullback as previous resistance at 0.9596 should turn into support and contain dollar’s downside. Below 0.9580 (61.8% Fibonacci retracement of 0.9490-0.9727) would defer and suggest a temporary top is formed instead, bring correction to 0.9540-50 but price should stay well above support at 0.9490, bring another rise later.
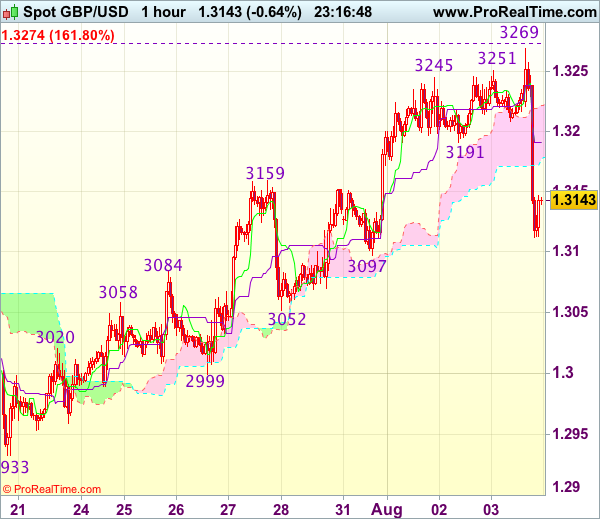
Trade Idea Wrap-up: GBP/USD – Stand aside
GBP/USD - 1.3143
Most recent candlesticks pattern : N/A
Trend : Near term up
Tenkan-Sen level : 1.3191
Kijun-Sen level : 1.3191
Ichimoku cloud top : 1.3222
Ichimoku cloud bottom : 1.3177
Original strategy :
Exit long entered at 1.3130,
Position : - Long at 1.3130
Target : -
Stop : -
New strategy :
Stand aside
Position : -
Target : -
Stop : -
Despite intra-day brief rise to 1.3269, lack of follow through buying and current selloff suggests an intra-day top has been formed and consolidation with downside bias is seen for test of support at 1.3097, however, break there is needed to add credence to this view, bring retracement of recent upmove to 1.3070-75 and later towards support at 1.3052 but price should stay well above support at 1.2999, bring another rise later.
In view of this, would be prudent to stand aside in the meantime. Above 1.3170-75 would bring recovery to 1.3200, however, as temporary top has been formed at 13269, reckon upside would be limited to 1.3220-30 and price should falter well below resistance at 1.3269, bring another retreat later.
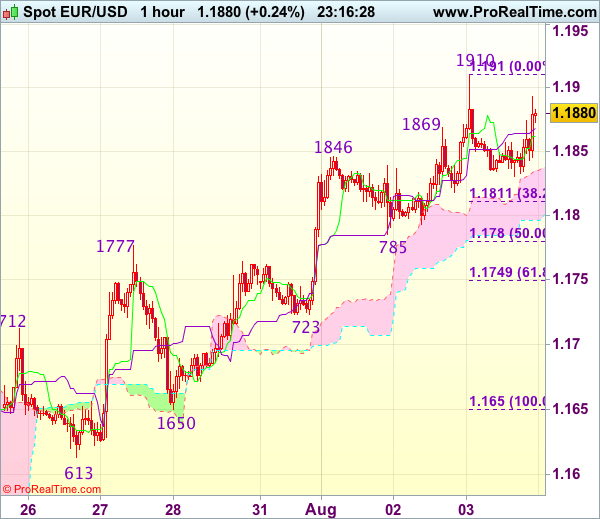
Trade Idea Wrap-up: EUR/USD – Hold short entered at 1.1880
EUR/USD - 1.1880
Most recent candlesticks pattern : N/A
Trend : Near term up
Tenkan-Sen level : 1.1862
Kijun-Sen level : 1.1868
Ichimoku cloud top : 1.1835
Ichimoku cloud bottom : 1.1796
Original strategy :
Sold at 1.1880, Target: 1.1780, Stop: 1.1915
Position : - Short at 1.1880
Target : - 1.1780
Stop : - 1.1915
New strategy :
Hold short entered at 1.1880, Target: 1.1780, Stop: 1.1915
Position : - Short at 1.1880
Target : - 1.1780
Stop : - 1.1915
Although the single currency extended recent upmove to 1.1910 yesterday, the subsequent retreat suggests consolidation below this level would be seen and mild downside bias is for weakness to 1.1810-15, however, break of 1.1780-85 (50% Fibonacci retracement of 1.1650-1.1910 and previous support) is needed to signal top is formed, bring retracement of recent rise to 1.1745-50 (61.8% Fibonacci retracement) but support at 1.1723 would remain intact.
In view of this, we are holding on to our short position entered at 1.1880. Above said resistance at 1.1910 would signal recent upmove is still in progress and may extend headway to 1.1940-50 and possibly towards 1.1970-75 before correction takes place.
Trade Idea Wrap-up: USD/JPY – Exit short entered at 110.90
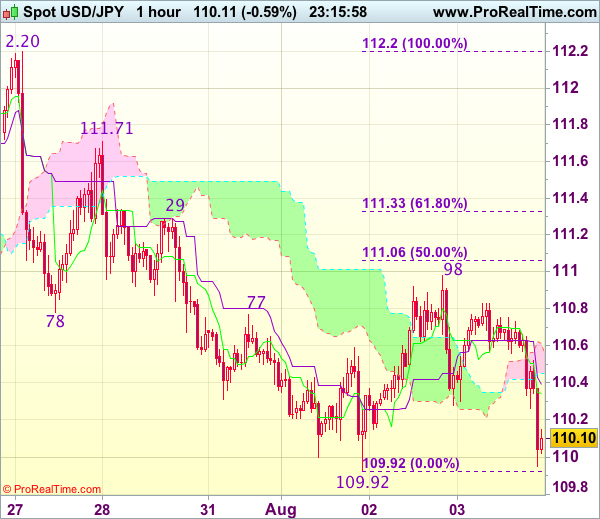
USD/JPY - 110.10
Most recent candlesticks pattern : N/A
Trend : Near term down
Tenkan-Sen level : 110.34
Kijun-Sen level : 110.39
Ichimoku cloud top : 110.61
Ichimoku cloud bottom : 110.45
Original strategy :
Sold at 110.90, Target: 109.90, Stop: 111.00
Position : - Short at 110.90
Target : - 109.90
Stop : - 111.00
New strategy :
Exit short entered at 110.90
Position : - Short at 110.90
Target : -
Stop : -
Although the greenback has dropped again in NY morning, break of this week’s low at 109.92 is needed to confirm recent decline has resumed and extend recent selloff from 114.50 top to 109.70–75 but loss of downward momentum should limit downside to 109.50, risk from there has increased for a rebound to take place later.
In view of this, would be prudent to exit short entered at 110.90 and look to sell again on recovery as 110.50 would limit upside. Above 110.70 would bring another bounce to 110.98 resistance but break of 111.05-10 (50% Fibonacci retracement of 112.20-109.92) is needed to signal a temporary low is formed, bring test of 111.29 resistance first.
Pound Slumps after BoE Lowers UK Outlook; Dollar Slips on Weak ISM
The pound was the worst performing major currency in today's European session as it tumbled after the Bank of England downgraded its growth and inflation forecasts. The euro was steady against the US dollar but surged against the pound, while the greenback came under pressure in forex markets from a weak ISM PMI.
The Bank of England decided to hold rates unchanged at 0.25% at the end of its two-day policy meeting today. But the 6-2 vote was less hawkish than the 5-3 split seen in June as newcomer Silvana Tenreyro joined the doves in voting against a hike. The Bank also published its quarterly inflation report where they revised down their forecasts of GDP growth and inflation for 2017 and 2018.
The pound fell over 100 pips against the dollar to plunge to $1.3118 from a fresh 10-month high of $1.3264 hit just a few hours prior to the Bank's announcement. Sterling was earlier boosted by stronger-than-expected services PMI out of the UK. The Marki/CIPS services beat expectations of 53.6 to rise to 53.8 in July from 53.4 previously. However, the Bank's less optimistic outlook and a less hawkish MPC vote weighed on the British currency with traders ignoring Governor Mark Carney's warning in his press conference that it would be appropriate to ""withdraw more stimulus than the market currently has embedded". Most analysts now expect a rate hike to arrive in the second half of 2018.
The euro also surged against the pound, breaking above 0.90 pounds for the first time since November 2016. It last stood 0.8% firmer at 0.9031, while against the dollar, it was steadier, hovering around $1.1850 for much of the session.
The single currency found support today from better-than-expected retail sales data for the Eurozone. Retail sales in the euro area jumped by 0.5% month-on-month in June, which was well above forecasts of 0.1% and compares with 0.4% in May. On an annual basis, retail sales were up 3.1% versus estimates of 2.6%. This offset somewhat disappointing final PMI readings. The Eurozone's final composite PMI for July was revised down by 0.1 to 55.7.
It was a busy day for the US with a flurry of data releases. Weekly jobless claims fell by slightly more than expected, indicating continued tightening in the labour market. The number of people claiming unemployment benefits in the week starting July 24 dropped to 240k from a revised 245k in the previous week. Expectations were for a figure of 242k. Other labour market data included the Challenger layoffs. The number of layoffs declined from 31.1k to 28.3k in July.
June factory orders were also out today. New orders for US manufactured goods rose by the fastest rate in eight months in June, increasing by 3.0% m/m. This was just above forecasts of 2.9% and a big improvement on the 0.3% drop seen in the prior month.
The big focus though was the ISM non-manufacturing PMI but ahead of that, the final Markit services PMI for July was released. The services PMI was revised up from 54.2 to 54.7 in July's final reading. In contrast, the ISM's non-manufacturing PMI missed estimates of 57.0 to slump to 53.9 in July from 57.4 in May. Further dampening sentiment were sharp declines in the new orders and employment sub-indices, although the prices paid index rose in July, pointing to an uptick in inflationary pressures.
The dollar fell sharply after the ISM data, finding little support from the broadly positive figures of the other US releases. Against the yen, the greenback headed back towards the 110 handle before steadying just above the level in late European session. However, the dollar index managed to stay flat, mainly as a result of the pound's big losses, and was marginally weaker at 92.81. The focus now is on tomorrow's all-important non-farm payrolls report.
In commodities, gold gained about 0.2% on the back of the weaker dollar to rise to $1269 an ounce. Oil prices also reversed their earlier losses to turn positive. WTI crude stood at $49.66 a barrel, while Brent was trading at $52.57 a barrel.
Sterling Tumbles as BoE Keeps Rates on Hold, Cuts Growth Forecasts
The Bank of England decided to keep rates unchanged at all-time lows as it completed its two-day meeting today. Despite the decision not deviating from expectations, sterling suffered sizable losses relative to majors including the dollar and the euro as the Bank lowered its forecasts for growth in the current and following years. The pound's decline continued as Mark Carney, the central bank's Governor, appeared before the press after the decision announcement. Overall, the Bank's decision, minutes and language used in its quarterly Inflation Report lacked the hawkish tone that led to rising market expectations for an interest rate hike to be delivered this year.
More specifically, the BoE's Monetary Policy Committee (MPC) voted by 6-2 to maintain its benchmark interest rate at the record low of 0.25%. This compares with a 5-3 split during the June meeting when the Bank came the closest to voting for a rate hike since 2007. Additionally, the MPC was unanimous at keeping the total stock of government bonds to be purchased as part of its stimulus program at 435 billion pounds and the respective number for corporate bonds at 10bn pounds.
Furthermore, the Bank cut its annual GDP forecasts for 2017 and 2018 to 1.7% and 1.6% respectively from the previous 1.9% and 1.7%. Inflation projections were slightly revised upwards for the current year to 2.7% on an annual basis from 2.6% before, while the central bank's expectations for annual inflation in 2018 remain at 2.6%. Standing out was the considerable reduction in wage growth forecasts to 3.0% annually for 2018 from 3.5% just two months ago. This comes at a time when UK households are already seeing their purchasing power diminish as a result of the weakening sterling following last year's vote to exit the EU blog of nations.
The Bank and its Governor in the press conference that followed, were clear that businesses and households should not expect borrowing costs to stay at their record low levels for much longer. However, the many caveats Carney gave - revolving in large part around Brexit-related uncertainty - in order for policy tightening to get underway, led forex market participants to place little emphasis on those comments.
Pound/dollar immediately fell upon the decision announcement and extended its losses as Governor Carney was talking, falling to as low 1.3111. The pair was trading at 1.3234 previously, while earlier in the day it hit a fresh near 11-month high of 1.3266. It was last 0.6% down on the day. Euro/pound broke above the 0.90 handle, reaching as high as 0.9042, a nine-month high. It traded at 0.8942 before the news. It was last up by 0.8% and close to the day's high.
On the Brexit front, Carney said that uncertainty over the UK-EU future relationship is weighing on business investment and household spending, adding that the level of investment in the economy is currently expected to be 20% lower than the Bank anticipated before the vote to leave the EU. Still the BoE is basing its long-term forecasts under a "smooth" Brexit assumption according to Carney. The buildup in consumer borrowing also received attention as it has risen to levels last seen before the 2008 financial crisis - this makes raising rates even more difficult as borrowers are already struggling to meet obligations in an environment of ultra-low interest rates.
Ian McCafferty and Michael Saunders were the two MPC members that dissented in favor of a 25 basis points rate hike, expressing concerns over rising inflation. Kristin Forbes, the third member voting in favor of a rate rise during the June meeting, has since departed after completing her term as an MPC voting member. The BoE next meets on September 14.
US: Expansion in Non-Manufacturing Industries Cools in July, But Underlying Details Remain Encouraging
Institute for Supply Management's (ISM) non-manufacturing index pulled back 3.5 points to 53.9 - marking the lowest level in a year. The headline print came in considerably below market expectations which called for a moderate pullback to 56.9.
The vast majority of indicators deteriorated on the month, with new orders (-5.4 to 55.1), business activity (-4.9 to 55.9) and employment (-2.2 to 53.6) recording the biggest declines.
On the other hand, the prices paid sub-index improved 3.6 points to 55.7, indicating that prices increased at a faster rate in July than in the month prior - the second consecutive acceleration.
Despite the pullback, comments from survey contacts remained largely positive. Moreover, nearly all of the non-manufacturing industries surveyed reported growth in July, with Management of Companies, Agriculture, and Forestry, Fishing & Hunting being the only exceptions - all three being very small industries.
Key Implications
The ISM non-manufacturing index followed its manufacturing equivalent and decelerated in July. However, the performance was markedly worse, with the deceleration being more apparent in magnitude and broader across sub-indicators. Overall, while the decline in the headline and among the main sub-indicators is disappointing, the fact that the index remains in expansionary territory and that most industries continue to report growth and remain upbeat, suggest that today's pullback is less concerning.
The deterioration in the employment sub-index, taken together with an equivalent decline in its manufacturing report and a below-consensus print in yesterday's ADP employment report suggests some potential softness in tomorrow's payrolls report and poses a downside risk to our expectation that the U.S. economy added 183k jobs during July.
The silver lining in today's report was the continued improvement in the prices sub-index. Both the manufacturing and non-manufacturing sub-indices are now back above last year's levels, after spending two months in the red. Together with a somewhat firmer core PCE index in June, the better numbers suggest that a turnaround in price pressures may be taking place.
Pound Slips as BoE Trims Growth Forecast
GBP/USD has dropped considerably in Thursday trade. In the North American session, the pair is trading at 1.3140, down 0.63% on the day. On the release front, the Bank of England maintained interest rates at 0.25%, but also lowered its 2018 forecast for GDP and wage growth. Elsewhere, UK Services PMI improved slightly, with a reading of 53.8 points. This beat the forecast of 53.6 points. In the US, unemployment claims edged lower to 240 thousand in July, beating the estimate of 242 thousand. ISM Non-Manufacturing slowed down to 53.9, compared to the estimate of 57.4 points. This reading was well below the forecast of 56.9 points. On Friday, the US releases wage growth and non-farm payrolls, so traders should be prepared for some movement from GBP/USD.
After touching 11-month highs on Wednesday, the pound has reversed directions and erased this week's gains. The currency reacted negatively as the BoE cut its growth forecasts for 2017, from 1.9% in May to 1.7%, and for 2018, from 1.7% to 1.6%. As well, the bank sharply cut lowered its wage growth forecast for 2018, from 3.5% to 3.0%. The BoE held rates at 0.25%, but the minutes from the policy meeting were dovish, with MPC members warning that "GDP growth had been sluggish and was expected to remain so in the near term." The BoE's pessimistic message has dashed hopes of a rate hike before the end of the year, although the bank suggested that a slight improvement in growth could lead to a rate hike in 2018. BoE policymakers have publicly argued about monetary policy, and the vote at Thursday's meeting, 6 members favored holding rates, while only 2 members voted to raise rates. The British economy has slowed down, but the bank is reluctant to raise rates when inflation is running at 2.6%, well above the bank's target of 2%. To complicate matters, the Brexit talks have made little progress, raising fears of a messy exit from the EU, which could take a serious toll on the British economy.
Earlier in the year, the Federal Reserve all but promised to raise interest rates three times in 2017. However, the Fed has pressed the rate trigger only twice, and a third hike remains in doubt, with current odds under 50%. Inflation has remained stubbornly low, despite a strong labor market. In June, Fed Chair Janet Yellen said that factors causing weak inflation were "transient", but there are no signs that inflation will pick up anytime soon. With the Federal Reserve unlikely to raise rates before December, investor attention has shifted to the Fed's balance sheet, which stands at $4.2 trillion. Fed policymakers have broadly hinted at reducing purchases of bonds and securities starting in September, but San Francisco Fed President John Williams was more forthcoming about the Fed's plans, likely aimed at giving notice to the markets. In a speech on Wednesday, Williams said that the economy had "fully recovered" from the 2008 financial crisis and called on the Fed to start trimming the balance sheet "this fall". Williams added that the process would be gradual and would take four years to reduce the balance sheet to a "reasonable size". On Wednesday, two other FOMC members also came out in support of starting to taper the balance sheet – St. Louis Fed President James Bullard and Cleveland Fed President Loretta Mester.
BOE Voted 6-2 to Leave Rate Unchanged, Downgraded Growth Outlook
The BOE left the Bank rate unchanged at 0.25%, the government bond purchases at 435B pound and corporate bond purchases at 10B pound. As we had anticipated, the members voted 6-2 to leave the interest rate unchanged with the newcomer Silvana Tenreyo supporting to maintain the status quo. Ian McCafferty and Michael Saunders continued to believe a +25 bps rate is needed. Sterling slumped after the announcement as the central bank downgraded the growth and wage forecasts. Governor Mark Carney warned that Brexit uncertainty is weighing on the country's economic outlook.
The members cut the GDO growth outlook to +1.7%, from +1.9% previously, for 2017 and +1.6%, from +1.7% previously, for 2018. Inflation outlook is revised modestly higher to +2.7% (+2.6% previously) for this year and unchanged at +2.6% for 2018. The forecast fro 2019 also stays unchanged at +2.2% . Governor Mark Carney suggested that if "households and business look through the flurry of headlines then the economy can be expected to pick up". He noted that the country's current economic performance is "sluggish".
Undoubtedly, Brexit is a key factor for the downgrade. At the press conference for the quarterly inflation report, Carney noted that the uncertainty over Brexit negotiation "weighs on the decisions of businesses and households and holds down both demand and supply". Note, however, that the downgraded growth forecast for 2017 was based on a "smooth" Brexit in 2019. This, according to Carney, remains the "most realistic assumption". Upon triggering Article 50 of the Lisbon Treaty on March 29, PM Theresa May has officially started the 2-year negotiation of the UK leaving the EU. The parliamentary election held in June has increased the uncertainty. a hung parliament was resulted as the Conservative Party failed to gained more than 625 seats. It eventually formed a coalition government with DUP, which supports Brexit but has reservation over PM May's hard Brexit stance. Meanwhile, with its big jump in the number of seats, Labors, the major opposition party, would be more influential over the Brexit negotiation. The opinions amongst parties have never been more divided.
On the monetary policy outlook, BOE forecasts two rate hikes in three years with the first hike coming in 3Q18. Chief Economist Andy Haldane noted in June that he would likely support a rate hike in 2H17. Yet, he stayed in the dove camp this time.
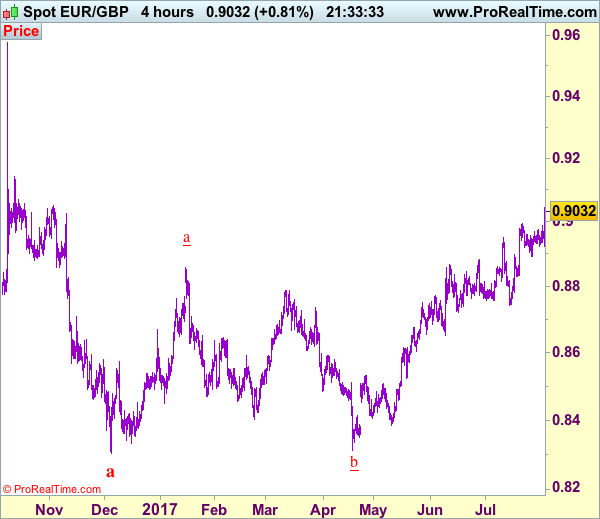
Trade Idea: EUR/GBP – Target met and stand aside
EUR/GBP - 0.9028
Recent wave: Major double three (A)-(B)-(C)-(X)-(A)-(B)-(C) is unfolding and 2nd (A) has possibly ended at 0.6936.
Trend: Near term up
Original strategy :
Bought at 0.8925, met target at 0.9025
Position : - Long at 0.8925
Target : - 0.9025
Stop : -
New strategy :
Stand aside
Position : -
Target : -
Stop : -
Current anticipated rally adds credence to our bullishness and our long position entered at 0.8925 has met our upside target at 0.9025 with 100 points profit, hence bullishness remains for recent upmove to extend gain to 0.9050 but reckon upside would be limited to 0.9075-80 due to overbought condition and price should falter below 0.9100 today, risk from there has increased for a retreat later.
As we have taken profit on our long position entered at 0.i8925, would not chase this rise here and would be prudent to stand aside in the meantime. On the downside, expect pullback to be limited to 0.8980-85 and 0.8850 ghoul hold, bring another rise later. Only below support at 0.8920-25 would abort and signal a temporary top is in place, bring retracement of recent upmove to 0.8890-00 first.
Our preferred count is that, after forming a major top at 0.9805 (wave V), (A)-(B)-(C) correction is unfolding with (A) leg ended at 0.8400 (A: 0.8637, B: 0.9491 and 5-waver C ended at 0.8400. Wave (B) has ended at 0.9413 and impulsive wave (C) has either ended at 0.8067 or may extend one more fall to 0.8000 before prospect of another rally. Current breach of indicated resistance at 0.9043 confirms our view that the (C) leg has ended and bring stronger rebound towards 0.9150/54, then towards 0.9240/50.