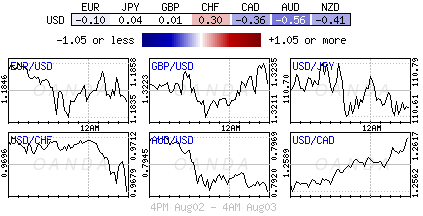
Sample Category Title
AUD/USD Breakdown In Play
Price plunges on the daily chart and looks unstoppable as the USD received a helping hand from the USDX's minor rebound. USDX climbed above the 93.00 psychological level and tries to climb higher after the yesterday's oversold sign.
Technically, the AUD/USD drop is natural after the amazing rally, so you don't have to worry if will drop much deeper in the upcoming days. Could be attracted by some important confluence areas, so more downside is in view right now. USD is frightened by the US data release, another disappointment could ruin its upside perspective.
The US is to release the Unemployment Claims report, the Initial Jobs could drop from 244K to 242K in the previous week, the indicator stayed below the 250K level since April, a major drop will boost the greenback. Moreover, the ISM Non-Manufacturing PMI could decrease from 57.4 to 56.9 points in July, while the Final Services PMI is forecasted to remain unchanged, at 54.2 points. The Factory Orders may increase by 2.9% in June, which will be good for the USD.
AUD/USD opened with a minor gap down in the morning, signalling that the bears are in control. Will drop further if will retest the broken upper median line (uml) of the descending pitchfork, the next downside target will at the median line (ml) and lower at the major lower median line (LML).
The current drop is natural after the false breakouts above the 50% Fibonacci line (ascending dotted line) and above the first warning line (wl1). Price failed to retest the warning line (wl1), signaling that the bulls are exhausted and we may have a short term reversal.
The outlook remains bullish as long as is trading above the lower median line (LML), we could have a buying opportunity from there.
GBPUSD Bearish, Weakens On Price Rejection
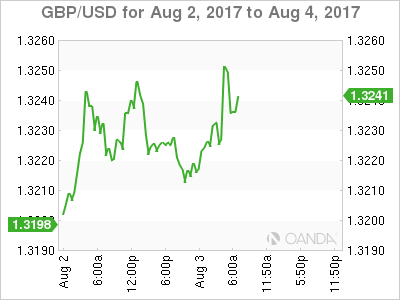
GBPUSD: The pair backed off higher prices again on Thursday to decline on bear pressure. This development leaves risk to the downside in the days ahead. Support lies at the 1.3100 level where a break will turn attention to the 1.3050 level. Further down, support lies at the 1.3000 level. Below here will set the stage for more weakness towards the 1.2950 level. Conversely, resistance stands at the 1.3200 levels with a turn above here allowing more strength to build up towards the 1.3250 level. Further out, resistance resides at the 1.3300 level followed by the 1.3350 level. On the whole, GBPUSD continues to face downside risk on price failure.
(BOE) Bank Rate Held at 0.25%, Government Bond Purchases at £435bn and Corporate Bond Purchases at up to £10bn
The Bank of England's Monetary Policy Committee (MPC) sets monetary policy to meet the 2% inflation target, and in a way that helps to sustain growth and employment. At its meeting ending on 2 August 2017, the MPC voted by a majority of 6-2 to maintain Bank Rate at 0.25%. The Committee voted unanimously to maintain the stock of sterling non-financial investment-grade corporate bond purchases, financed by the issuance of central bank reserves, at £10 billion. The Committee voted unanimously to maintain the stock of UK government bond purchases, financed by the issuance of central bank reserves, at £435 billion. The Committee voted unanimously to close the drawdown period for the Term Funding Scheme (TFS) on 28 February 2018, as envisaged when the scheme was introduced.
The MPC's overall assessment of the outlook for inflation and activity in the August Inflation Report is broadly similar to that in May. In the MPC's central forecast, GDP growth remains sluggish in the near term as the squeeze on households' real incomes continues to weigh on consumption. Growth then picks up to just above its reduced potential rate over the balance of the forecast period. Net trade and business investment firm up, and consumption growth recovers in line with modestly rising household incomes. Net trade is bolstered by strong global growth and the past depreciation of sterling. The combination of high rates of profitability, especially in the export sector, the low cost of capital and limited spare capacity supports investment by UK firms over the forecast period, offsetting the effect of continued uncertainties around Brexit.
CPI inflation rose to 2.6% in June from 2.3% in March, as expected. The MPC expects inflation to rise further in coming months and to peak around 3% in October, as the past depreciation of sterling continues to pass through to consumer prices. Conditional on the current market yield curve, inflation is projected to remain above the MPC's target throughout the forecast period. This overshoot reflects entirely the effects of the referendum-related falls in sterling. As the effect of rising import prices on inflation diminishes, domestic inflationary pressures gradually pick up over the forecast period. As slack is absorbed, wage growth is projected to recover. In addition, margins in the consumer sector, having been squeezed by the pickup in import prices, are projected to be rebuilt. Consequently, inflation remains at a level slightly above the 2% target.
As in previous Reports, the MPC's projections are conditioned on the average of a range of possible outcomes for the United Kingdom's eventual trading relationship with the European Union. The projections also assume that, in the interim, households and companies base their decisions on the expectation of a smooth adjustment to that new trading relationship. Other important judgements include: that the lower level of sterling continues to boost consumer prices broadly as projected, and without adverse consequences for inflation expectations further ahead; that regular pay growth remains modest in the near term but picks up over the forecast period; and that subdued household spending growth is largely balanced by a pickup in other components of demand.
Monetary policy cannot prevent either the necessary real adjustment as the United Kingdom moves towards its new international trading arrangements or the weaker real income growth that is likely to accompany that adjustment over the next few years. Attempting to offset fully the effect of weaker sterling on inflation would be achievable only at the cost of higher unemployment and, in all likelihood, even weaker income growth. For this reason, the MPC's remit specifies that, in exceptional circumstances, the Committee must balance any trade-off between the speed at which it intends to return inflation sustainably to the target and the support that monetary policy provides to jobs and activity. Through most of the forecast period, the economy operates with a small degree of spare capacity and CPI inflation is well above the target. By the end of the forecast, that trade-off is eliminated. Spare capacity is fully absorbed, and inflation remains above the target.
The Committee judges that, given the assumptions underlying its projections including the closure of the drawdown period of the TFS, and allowing for the effects of the recent prudential decisions of the Financial Policy Committee and the Prudential Regulation Authority, some tightening of monetary policy would be required to achieve a sustainable return of inflation to the target. Specifically, if the economy follows a path broadly consistent with the August central projection, then monetary policy could need to be tightened by a somewhat greater extent over the forecast period than the path implied by the yield curve underlying the August projections.
In light of these considerations, six members thought that the current policy stance remained appropriate to balance the demands of the MPC's remit. Two members considered it appropriate to increase Bank Rate by 25 basis points. All members agreed that any increases in Bank Rate would be expected to be at a gradual pace and to a limited extent. The Committee will continue to monitor closely the incoming evidence, and stands ready to respond to changes in the economic outlook as they unfold to ensure a sustainable return of inflation to the 2% target.
Market Update – European Session: Focus On BOE And The Number Of Hawks
Notes/Observations
Bank of England likely to keep policy steady with focus on the vote. Markets ponder whether chief economist Haldane will move into the hawkish camp.
European PMI Services mixed but remain in expansion territory (beats: UK, France, Italy; Misses: Germany, Spain, Russia; In-line: Euro Zone
India PMI Services contracted at the fastest pace in nearly 4 years following implementation of Goods and Service Tax (GST)
Overnight
Asia:
Australia Jun Trade Balance (AUD): 0.9B v 1.8Be
China July Caixin PMI Services: 51.5 v 51.6 prior
S&P: There is more risk to Australia's AAA sovereign rating than in the past
Japan PM Abe reshuffles Cabinet (as expected). Suga keeps Chief Cabinet Sec positon while Aso stays as Fin Min and Deputy PM. 13 out of 19 positions went to people with prior Cabinet experience. Five of whom remain in the same posts. Six newcomers were brought in
Europe:
Russia PM Medvedev: Trump signing new sanctions was tantamount to full-scale trade war; means an end to hopes for better ties with Trump administration
EU's Juncker: broadly satisfied that changes made to the U.S. Russia sanctions bill will protect European interests. Ready to retaliate if the US sanctions against Russia affect European companies
Americas:
Brazil Lower House Votes against proceeding with charges against President Temer
Feds Williams (moderate non-voter): reiterates expected to take 4-year to trim Fed balance sheet to reasonable size
Fed's Rosengren (moderate, non-voter): Tighter labor markets trump inflation softness, which justify Fed plans to keep raising rates
Fed's Mester (hawkish, non-voter): Fed's anticipated path of rate increases is appropriate. Three rate hikes per year is appropriate to avoid overheating and reach-for-yield
Economic Calendar
(IE) Ireland July Services PMI: 58.3 v 57.6 prior (59th month of expansion); Composite PMI: 57.0 v 58.0 prior
(IN India July Services PMI: 45.9 v 53.1 prior (1st contraction in 7 months); Composite PMI: 46.0 v 52.7 prior
(RU) Russia July Services PMI: 52.6 v 55.0e (18th month of expansion); Composite PMI: 53.4 v 54.8 prior
(SE) Sweden July PMI Services: 59.0 v 57.3 prior
(TR) Turkey July CPI M/M: 0.2% v 0.2%e; Y/Y: 9.8% v 9.9%e; CPI Core Index Y/Y: 9.6% v 9.1%e
(ZA) South Africa July PMI Services: 50.1 v 49.0 prior (moves back into expansion)
(ES) Spain July Services PMI: 57.6 v 58.5e (45th month of expansion); Composite PMI: 56.7 v 57.8e
(IT) Italy July Services PMI: 56.3 v 54.1e 14th month of expansion; Composite PMI: 56.2 v 54.9e
(FR) France July Final Services PMI: 56.0 v 55.9e (confirms 14th month of expansion); Composite PMI: 55.6 v 55.7e
(DE) Germany Services July Final Services PMI: 53.1 v 53.5e (confirms 49th month of expansion but lowest since Sept); Composite PMI: 54.7 v 55.1e
(EU) Euro Zone July Final Services PMI: 55.4 v 55.4e (confirms 49th month of expansion); Composite PMI: 55.7 v 55.8e
FAO World Food Price Index: 179.1 v 175.2 prior; M/M: 2.3% v 1.4% prior (highest levelsince Jan 2015)
(UK) July Services PMI: 53.8v 53.6e (12th month of expansion); Composite PMI: 54.1 v 53.8e
(EU) Euro Zone Jun Retail Sales M/M: 0.5% v 0.0%e; Y/Y: 3.1% v 2.5%e
Fixed Income Issuance:
(ES) Spain Debt Agency (Tesoro) sold total €3.54B vs. €3.0-4.0B indicated range in 2022, 2026 and 2041 Bonds
Sold €1.74B in 0.4% Apr 2022 SPGB; Avg yield: 0.233% v 0.337% prior; Bid-to-cover: 1.60x v 2.26x prior
Sold €1.03B in 5.90% 2026 SPGB; Avg Yield 1.267% v 1.370% prior; Bid-to-cover: 1.86x v 1.71x prior
Sold €780M in 4.70% July 2041 SPGB; Avg Yield: 2.545% v 2.666% prior; Bid-to-cover: 1.40x v 1.47x prior
(ES) Spain Debt Agency (Tesoro) sold €580M vs. €250-750M indicated arnge in 0.3% Nov 2021 Inflation-Linked bonds; (SPGBei;Bonoei) bond; Real Yield: -0.927% v -0.674% prior; Bid-to-cover: x v 1.83x prior (Mar 2nd 2017)
(FR) France Debt Agency (AFT) sold total €6.498 vs. €5.5-6.5B indicated range in 2025, 2027 and 2048 Oats
Sold €1.521B in 6.0% Oct 2025 Oats; avg yield: 0.39% v 0.39% prior; Bid-to-cover: 1.76x v 1.83x prior
Sold €3.598B in 1.00% May 2027 Oats; Avg Yield: 0.75% v 0.72% prior; Bid-to-cover: 2.15x v 1.76x prior
Sold €1.379B in 2.00% May 2048 Oats; Avg Yield 1.79% v 1.87% prior, Bid-to-cover 1.57x v 1.53x prior
SPEAKERS/FIXED INCOME/FX/COMMODITIES/ERRATUM
Equities
Indices [Stoxx50 -0.3% at 3,447, FTSE -0.1% at 7,402, DAX -0.4% at 12,135, CAC-40 -0.1% at 5,103, IBEX-35 -0.6% at 10,452, FTSE MIB +0.3% at 21,615, SMI +0.1% at 9,128, S&P 500 Futures -0.1%]
Market Focal Points/Key Themes: European stocks open lower in line with Asia, and continued to move lower as the session progressed; energy stocks weighed on by oil price; gold underperforming putting pressure on materials stocks; focus on major risk events coming up, including rate decisions and tomorrow's NFP numbers; among US companies reporting today: Aetna, Avon and Kellogg
Equities
Consumer discretionary: Next PLC NXT.UK +7.0% (earnings), Bic BB.FR +7 0% (earnings)
Materials: Tenaris TEN.IT -4.3% (earnings)
Industrials: BMW BMW.DE +0.4% (earnings), Siemens SIE.DE -3.0% (earnings), Rheinmetall RHM.DE +1.5% (earnings), Fraport FRA.DE -2.9% (earnings)
Financials: Unicredit UCG.IT +4.3a% (earnings), Aviva AV.UK +0.7% (earnings)
Telecom: Deutsche Telekom DTE.DE +0.6% (earnings), Inmarsat ISAT.UK -4.6% (earnings)
Healthcare: Merck KGaA MRK.DE +0.6% (earnings) - Energy: Neste NES1V.FI -7.8% (earnings)
Speakers
ECB Economic Bulletin reiterated Draghi post rate press conference that incoming data pointed to solid and broad-based recovery while underlying price pressures remained subdued. Substantial degree of stimulus was still needed
ECB lowered its emergency liquidity assistance (ELA) cap for Greece banks from €40.5B to €38.9B
Italy Fin Min Podoan: Budget law to focus on jobs and investment - Norway Fin Min Jensen: Seeing a natural cooling of housing market
Turkey Dep PM Simsek: TRY currency (Lira) has attained relative stability. Inflation to decline to under 7% in 2018
Turkey Presidential advisor Gedikli: Central Bank might cut interest rates at its 1st meeting in 2018
China PBoC said to be considering a widening of the yuan's trading band from the current 2% level after a major Communist party meeting this year, (**Note: last widened back in Mar 2014)
Taiwan Central Bank (CBC) June Minutes: Decision was unanimous to keep policy steady. One member: No urgency to raise interest rate. Forecasted 2017 GDP growth at 2.1%
Japan PM Abe commented following his Cabinet reshuffle and stressed that he would prioritize the economy and sought to increase the speed of Abenomics
Currencies
FX markets relatively quiet with focus on BOE rate decision. USD Index trying to pull away from 15-month lows attributed to political turmoil gripping Washington and by largely uninspiring US economic data. Dealers noted that greenback benefitted from some profit-taking from shorts ahead of the release of USS payroll data on Friday.
EUR/USD consolidated after hitting 2-1/2 year highs on Wed. The pair euro has drawn support from expectations that the ECB Bank would eventually begin phasing out its easy policy
GBP/USD firmer ahead of BOE with pair trading testing 1.3270 area. GBP aided by a beat in its PMI services data. BOE seen keeping its policy steady amid political and Brexit uncertainty with the vote seen at 6-2 (**Note: only 8 members voting this time around. Hogg's replacement has been announced (Ramsden) but he would not join the MPC until September ). One of the three dissenters at the last meeting (Forbes) term ended and her replacement (Tenreyro) is widely expected to vote with the majority. Members McCafferty and Saunders were again expected to dissent calling for a 25bps rate hike. There was some risk that Haldane voted with the hawks, which would leave the vote 5-.
RUB currency (Ruble) maintained its soft tone as it weakened for a 6th straight session. President Donald Trump signed into law Russian sanctions
Fixed Income
Bund futures trades at 162.79 down 7 ticks in lackluster trading with the days range 18 ticks wide. Support remains at 162.56 followed by 162.08, while resistance stands at 16.03 then 163.30.
Gilt futures trades slightly higher at 125.98 ahead of the Bank of England rate decision. UK services PMI came in slightly higher then expectations marking the 12th straight month of expansion.
Thursday's liquidity reportshowed Wednesday's excess liquidity fell to €1.736T down €6B from €1.742T prior. Use of the marginal lending facility rose to €253M from €70 prior.
Corporate issuance saw $5.5B come to market via 4 issuers bringing weekly issuance above $20B. General Motors $3B 4 part offering accounted for the bulk of the issuance, as more companies exit the earnings blackout period.
Looking Ahead
05:30 (HU) Hungary Debt Agency (AKK) to sell Bonds (3-tranches)
05:30 (PL) Poland to sell Bonds (switch auction)
06:00 (IE) Ireland July Live Register Monthly Change: No est v -4.8K prior; Level: No est v 259.2K prior
06:45 (US) Daily Libor Fixing
07:00 (UK) Bank of England (BOE) Interest Rate Decision: Expected to leave Interest Rates unchanged at 0.25% and maintain Asset Purchase Target (APT) at -
07:00 (UK) Bank of England (BOE) July Minutes
07:00 (UK) Bank of England (BOE) Quarterly Inflation Report (QIR)
07:00 (CZ) Czech Central Bank (CNB) Interest Rate Decision: Expected to raise Repurchase Rate by 25bps to 0.25%
07:00 (UR) Ukraine Central Bank Interest Rate Decision: Expected to leave Interest Rates unchanged at 12.50%
07:00 (ZA) South Africa Jun Electricity Production Y/Y: No est v 4.6% prior; Electricity Consumption Y/Y: No est v 3.4% prior
07:30 (US) July Challenger Job Cuts: No est v 31.1K prior; Y/Y: No est v -19.3% prior
07:30 (UK) Bank of England (BOE) Gov Carney Quarterly Inflation Report press conference
08:00 (US) Fed Summits holds an event, "ATARC Federal Cloud & Data
08:00 (UK) Baltic Dry Bulk Index
08:30 (US) Initial Jobless Claims: 243Ke v 244K prior; Continuing Claims: 1.96Me v 1.964M prior
08:30 (UK) Weekly USDA Net Export Sales
09:00 (RU) Russia Gold and Forex Reserve w/e July 28th: No est v $414.7B prior
09:00 (BR) Brazil July Services PMI: No est v 47.4 prior; Composite PMI: No est v 48.5 prior
09:00 (MX) Mexico July Consumer Confidence Index: 86.9e v 87.2 prior
09:45 (US) July Final Markit Services PMI: 54.2e v 54.2 prelim; Composite PMI: No est v 54.2 prelim
10:00 (US) July ISM Non-Manufacturing Composite: 56.9e v 57.4 prior
10:00 (US) Jun Factory Orders: +3.0%e v -0.8% prior; Factory Orders Ex-Transportation: No est v -0.3% prior
10:00 (US) Jun Final Durable Goods Orders: 0.0%e v 6.5 prelim; Durables Ex Transportation: No est v 0.2% prelim; Capital Goods Orders (Non-defense/ex-aircraft): No est v -0.1 prelim; Capital Goods Shipment (Non-defense/ex-aircraft): No est v 0.2% prelim; Durables Ex-Defense: No est v 6.7 prelim
10:30 (US) Weekly EIA Natural Gas Inventories - 11:00 (BR) Brazil to sell Fixed Rate 2023 and 2027 Bonds - 11:00 (BR) Brazil to sell LTN 2018, 2019 and 2021 Bills
Japan 225 Stock Index Neutral As It Moves Into Cloud
The Japan 225 stock index is looking increasingly neutral as it heads into the Ichimoku cloud. The index has been trading sideways after hitting a near two-year peak of 20322 in June. It is currently being supported by the 50-day moving average just above the 20000 level, as well as the top of the cloud.
Near-term momentum indicators are also painting a very neutral picture. The MACD is just below zero after a long period in positive territory, while the %K line of the stochastic oscillator is just above the 50 neutral level. The positively aligned %K and %D lines indicate some upside momentum is still in place.
If the immediate support level of 20000 holds, fresh upside moves would bring the June high of 203222 in focus as a key resistance point. A break above this level would signal a resumption of the longer-term uptrend that began in November last year, and open the way towards the June 2015 peak of 20945. Although before then, the area around 20500 – a previous congestion region – could prove a difficult barrier.
Failure to hold above the 50-day moving average would shift the short-term bias to bearish, while a drop into the cloud would confirm that the medium-term outlook has turned neutral. Support from inside the cloud should come from the previous support and resistance areas of 19900 and 19600.
Pound Eyes BoE Dissenters
Thursday August 3: Five things the markets are talking about
Stocks have retreated from their record highs amid declines across Asia and as a drop in crude oil prices weigh on Euro shares.
Europe's 'single unit' (€1.1844) has edged lower after yesterdays significant jump higher, while the mighty dollar stabilizes somewhat as the market awaits U.S labor market data.
Ahead of the Bank of England (BoE) monetary policy announcement (07:00 am EDT), the pound (£1.3256) has added to gains, rising to its highest in ten months outright after a purchasing managers' survey showed activity in the all important U.K services sector continued to increase last month.
Note: BoE's Carney could signal a more 'hawkish' tone when the bank announces its policy decision and releases its quarterly inflation report. BoE rates are expected to remain on hold.
1. Stocks see red
Stateside yesterday, the Dow Jones Industrial Average broke above the psychological 22,000 print for the first time, supported by Apple's stellar quarterly results.
In Japan, the Nikkei fell (-0.3%), hit by tech shares selling after 'Apple effect' fades, while the broader Topix ended nearly flat.
In Hong Kong, stocks were weighed down by financial and energy shares. The Hang Seng index fell -0.3%, while the China Enterprises Index lost -0.5%.
In China, stocks retreated on a soft services sector report and liquidity concerns. The blue-chip CSI300 index fell -0.9%, while the Shanghai Composite Index lost -0.4%.
Note: China July Caixin PMI Services was 51.5 vs. 51.6 prior.
In Europe, most bourses have opened on the back foot and have continued to move lower as energy stocks are weighed on by oil price. With gold underperforming is putting some pressure on materials stocks. Market focus now turns to the Bank of England (BoE) rate decisions and tomorrow's U.S payrolls.
U.S stocks are set to open in the red (-0.1%).
Indices: Stoxx50 -0.3% at 3,447, FTSE -0.1% at 7,402, DAX -0.4% at 12,135, CAC-40 -0.1% at 5,103, IBEX-35 -0.6% at 10,452, FTSE MIB +0.3% at 21,615, SMI +0.1% at 9,128, S&P 500 Futures -0.1%
2. Oil prices rise, but remain capped, gold lower
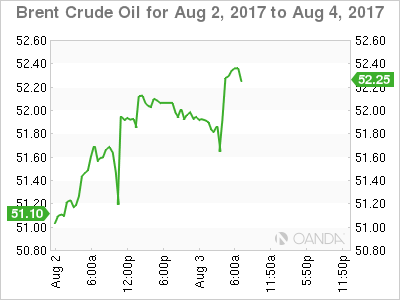
Oil prices have rallied a tad overnight, supported somewhat by renewed signs of a gradually tightening U.S market. However, ongoing high supplies from OPEC producers continue to cap gains.
Brent crude futures are at +$52.56 per barrel, up +20c, or +0.4% from Wednesday's close. U.S West Texas Intermediate (WTI) crude futures are at +$49.79 per barrel, up +20c, or +0.4%.
Yesterday's weekly report from the EIA data showed that U.S. output rose while crude inventories fell by less than analysts expected; however, demand for gas was again stellar, fueling a sizeable decline in product stockpiles.
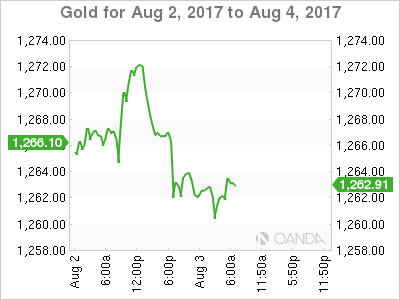
Gold prices are under pressure (-0.5% to +$1,260.36 per ounce) as the dollar inches away from its multi-month lows. Signs that the U.S economy is strengthening has some investors focusing on risk assets.
Note: The prudent investors will continue to look for further evidence of stronger U.S inflation numbers before they get a little bit more optimistic about a rate hike, which remains a natural headwind for gold prices.
3. U.K yields indicate the BoE decision a non-event
The fixed income market is only pricing +10% odds of a BoE rate rise this morning – to some that's a tad too low. While a rate hike is not the central theme, inflation forecasts are likely to be adjusted a tad higher, which can only be looked through if you believe there is enough spare capacity and slack in the economy. The market will also focus on the vote, as markets ponder whether chief economist Haldane will move into the 'hawkish' camp.
Elsewhere, the yield on U.S 10-year Treasuries has backed up +1 bps to +2.28%. Germany's Bund 10-year yield rallied +1 bps to +0.50%, while U.K's 10-year Gilt yield advanced +2 bps to +1.24%, the highest in a week.
4. Pound at multi-month highs
The FX market is relatively quiet with focus on BoE rate decision. The USD Index continues to try to pull away from its 15-month lows attributed to political turmoil in Washington and by largely uninspiring U.S economic data.
EUR/USD (€1.1845) is consolidating after hitting fresh two-year highs yesterday (€1.1905). The 'single unit' has found support from expectations that the ECB would eventually begin phasing out its 'easy' policy.
Sterling (£1.3231) is firmer ahead of the BoE decision. It's aided by a beat in its PMI services data. The BoE is expected to keep policy steady amid political and Brexit uncertainty with the vote seen at 6-2.
Note: only eight members are voting this time around. Hogg's replacement has been announced (Ramsden), but he would not join the MPC until next month.
Note: One of the three dissenters at the last meeting (Forbes) term ended and her replacement (Tenreyro) is widely expected to vote with the majority. Members McCafferty and Saunders are again expected to dissent calling for a +25bps rate hike.
5. Global inflation hits lowest level in eight years
Data this morning from the OECD indicates that inflation in the G20's largest economies, which account for most of the world's economic activity, fell to its lowest level in almost eight years during June. Consumer prices were +2% higher than a year earlier.
Note: The last time inflation was lower was in October 2009, when it stood at +1.7% as the global economy was starting to emerge from the sharp downturn that followed the global financial crisis.
Euro Inches Lower On Mixed Services PMIs
EUR/USD has ticked lower in the Thursday session. Currently, the pair is trading at 1.1850, down 0.09% on the day. On the release front, German Final Services PMI dipped to 53.1, short of the estimate of 53.5 points. Eurozone Final Services was stronger, which matched the estimate with a reading of 55.4 points. Eurozone Retail Sales edged up to 0.5%, beating the forecast of 0.0%. In the US, there are two key releases. Unemployment Claims is expected at 242 thousand, and the ISM Non-Manufacturing PMI is forecast to slow to 56.9 points. On Friday, the US releases wage growth and non-farm payrolls, so traders should be prepared for some movement from EUR/USD.
The ECB continues to stick with its ultra-accommodative monetary policy, and with the euro-area struggling with weak inflation, no changes are expected in the next few months. Currently, ECB interest rates stand at a flat 0.00%, where they have been pegged since March 2o16. Under the bank's quantitative easing program (QE), the bank has been purchasing assets at a rate of EUR 60 billion/month. The QE program is scheduled to wind up in December, although the ECB has provided itself with some wiggle room, saying that that it could extend the program 'if necessary'. With the eurozone economy finally flexing some muscle in 2017, there has speculation that the ECB would tighten policy, and this has led to some frenzied buying of euros, much to the consternation of the ECB. At a conference of central bankers in June, ECB President Mario Draghi said that the reflationary forces could result in the bank 'adjusting the parameters' of current stimulus. The comments did not appear to mark a change in ECB policy, but investors seized on the remarks and the euro soared. The ECB was caught off guard, and resorted to the unusual step of stating that the markets had misinterpreted Draghi's comments. Given that fiasco, it's a safe bet that the ECB will be ultra-cautious in upcoming statements in order to avoid any repeat convulsions in the markets. At the same time, as we approach the December timeline for winding up QE, the ECB would do well to act in a transparent fashion and let the markets know if the QE program will indeed wind up in December. A lack of transparency could trigger market volatility, which is precisely what ECB policymakers wish to avoid.
With the Federal Reserve unlikely to raise rates before December, investor attention has shifted to the Fed's balance sheet, which stands at $4.2 trillion. Fed policymakers have broadly hinted at reducing purchases of bonds and securities starting in September, but San Francisco Fed President John Williams was more forthcoming about the Fed's plans, likely aimed at giving notice to the markets. In a speech on Wednesday, Williams said that the economy had 'fully recovered' from the 2008 financial crisis and called on the Fed to start trimming the balance sheet 'this fall'. Williams added that the process would be gradual and would take four years to reduce the balance sheet to a 'reasonable size'. On Wednesday, two other FOMC members also came out in support of starting to taper the balance sheet – St. Louis Fed President James Bullard and Cleveland Fed President Loretta Mester.
Will Inflation Data Deter BoE Hawks?
- UK inflation cools but will rate hike pressures?
- Economic and monetary policy uncertainties could drive volatility;
- US PMI data crucial after uninspiring H1.
As we enter the business end of the week, focus has turned away from earnings season and onto some of the other major economic events that could shake things up in the markets.
While there are still a large number of companies reporting second quarter earnings on Thursday – 43 from the S&P 500 – attention is shifting towards tomorrow's US jobs report and today's Bank of England decision, otherwise known as "Super Thursday". The BoE has been one of the central banks that has become much more hawkish in recent months and up until a few weeks ago, was seen as possibly following in the footsteps of the Bank of Canada and raising interest rates.
Since then, inflation has fallen from 2.9% to 2.6% which may have taken the wind out of the sails of those pushing for higher rates. At the last meeting, three policy makers voted for a rate hike and at least one other – Andy Haldane - has since claimed they contemplated doing the same and could be persuaded to at the upcoming meetings. Inflation running both above target and the level that the central bank anticipated was cited as the reason for voting for higher rates but with price pressures having cooled last month, logic suggests calls for such action should have to.
This assumes that higher inflation was the sole reason for supporting such a move and that the coordinated nature in which a number of central banks have appeared to lean towards tightening measures is a coincidence, which I'm not convinced it is. Given the latest data, today's vote and the minutes, inflation report and press conference that accompanies it should shed further light on the BoEs expectations for interest rates. Markets have all-but priced out a rate hike today but recent moves in sterling and UK yields suggest traders are not convinced that the BoE will hold off too much longer.
Given the uncertainties surrounding both the UK economic outlook – as a result of Brexit – and the BoE's position, markets could become quite volatile, particularly when the voting is released and during the press conference with Governor Mark Carney and some of his colleagues. Any suggestion that the recent inflation data hasn't deterred policy makers in pushing for a hike could pushing the pound and UK yields higher once again, while the opposite could hurt them both with them already trading at quite elevated levels.
The US won't fall off the radar today, with a plenty of economic data being released throughout the session. While tomorrow's jobs report is widely regarded as the biggest release each month, the ISM-non manufacturing PMI, Markit services PMI, jobless claims and factory orders numbers all provide crucial insight into the economy, particularly the two reports focused primarily on the outlook for the all-important services sector. We can therefore expect plenty of interest around these releases, particularly as labour market aside, the data this year hasn't blown anyone away.
Daily Technical Analysis: USD/CAD Overextended Above Weekly And Daily Camarilla Pivots
The USD/CAD is enjoying the uptrend that I have already provided the analysis for, but now it looks a bit overextended to the upside. This looks like a USD strength more than CAD weakness as ADP numbers had a revision yesterday that provided a boost to dollar. At this point the USD/CAD is getting close to the POC (ATR pivot, D H5, bearish order block) 1.2610-30. The price is above both weekly and daily H5. There is also a bearish divergence that suggests a possible U-turn. Targets are 1.2580,1.2550 and 1.2530. Ideally the price should stay below 1.2660 if the bears want to remain in control.
W L3 - Weekly Camarilla Pivot (Weekly Interim Support)
W H3 - Weekly Camarilla Pivot (Weekly Interim Resistance)
W H4 - Weekly Camarilla Pivot (Strong Weekly Resistance)
M H4 - Monthly Camarilla Pivot (Very Strong Monthly Resistance)
M L3 – Monthly Camarilla Pivot (Monthly Support)
M L4 – Monthly H4 Camarilla (Very Strong Monthly Support)
POC - Point Of Confluence (The zone where we expect price to react aka entry zone)
Technical Outlook: USDJPY – Recovery Was Limited For Now But Daily Cloud Twist Continues To Attract
Near-term bias remains at the upside as daily cloud twist continues to attract. However, recovery attempts from fresh low at 109.91 (01 Aug) stay capped under strong barrier at 111.00 (daily Tenkan-sen).
Bounce after strong downside rejection at 109.91 keeps near-term focus shifted higher, as slow stochastic is heading north on daily chart after reversing from o/s zone and shows more room at the upside and daily Tenkan-sen turned sideways from steep descend.
We need to see sustained break above Tenkan-sen barrier to open pivotal barrier at 111.34 (thinning daily cloud top / Fibo 61.8% of 112.19/109.91 downleg), break of which will be bullish.
Caution of early recovery rejection as overall structure is bearish, which would re-focus strong 110.00 support zone.
Res: 110.82, 111.00, 111.34, 111.65
Sup: 110.56, 110.14, 109.91, 109.26