
Sample Category Title
AUD/USD Selling Pressures Around 0.80
AUD/USD's technical structure has finally not reversed. Hourly resistance is given at 0.8066 (27/07/2017 high). Hourly support given at 0.7875 (21/07/2017 low). Expected to show further consolidation.
In the long-term, we are waiting for further signs that the current downtrend is ending. Key supports stand at 0.6009 (31/10/2008 low) . A break of the key resistance at 0.8295 (15/01/2015 high) is needed to invalidate our long-term bearish view.
USD/CAD Pushing Higher
USD/CAD's bearish momentum is showing ending signals. The pair remains nonetheless in a strong downtrend. Hourly resistance given at 1.2589 (02/08/2017) has been broken. Expected to show continued consolidation above 1.2400.
In the longer term, the pair has broken longterm support that can be found at 1.2461 (16/03/2015 low) before bouncing back. Strong resistance is given at 1.4690 (22/01/2016 high). The pair should head further lower
USD/CHF Buying Pressures
USD/CHF is edging higher. Hourly support can be found at 0.9631 (01/08/2017 low). Strong resistance is given at 0.9778 (15/06/2017 high) is on target. Expected to to show further strengthening.
In the long-term, the pair is still trading in range since 2011 despite some turmoil when the SNB unpegged the CHF. Key support can be found 0.8986 (30/01/2015 low). The technical structure favours nonetheless a long term bullish bias since the unpeg in January 2015
USD/JPY Ready For Another Leg Lower
USD/JPY's bearish momentum continues despite ongoing consolidation. Hourly support is given at 109.93 (01/08/2017 low). Stronger support is located at a distance at 108.83 (17/04/2017 low). Expected to show further downside pressures.
We favor a long-term bearish bias. Support is now given at 96.57 (10/08/2013 low). A gradual rise towards the major resistance at 135.15 (01/02/2002 high) seems absolutely unlikely. Expected to decline further support at 93.79 (13/06/2013 low).
GBP/USD Breaking Strong Resistance Area
GBP/USD still lies within a bullish trend. Hourly resistance is now given at 1.3245 (01/08/2017 high). Hourly support is given at 1.2933 (20/07/2017 low). Expected to show further upside pressures.
The long-term technical pattern is even more negative since the Brexit vote has paved the way for further decline. Long-term support given at 1.0520 (01/03/85) represents a decent target. Long-term resistance is given at 1.5018 (24/06/2015) and would indicate a long-term reversal in the negative trend. Yet, it is very unlikely at the moment.
EUR/USD Continued Bullish Pressures
EUR/USD bullish pressures continue. The pair has reached 1.1910 (02/08/2017 high). Hourly support can be found at 1.1785 (01/08/2017 high). Stronger support lies at 1.1613 (26/07/2017 low). Expected to show continued bullish pressures.
In the longer term, the momentum is now turning largely positive. We favour a continued bullish bias. Key resistance is now holding at 1.1871 (24/08/2015 high)t while strong support lies at 1.0341 (03/01/2017 low).
EUR/JPY Daily Outlook
Daily Pivots: (S1) 130.48; (P) 130.94; (R1) 131.74; More...
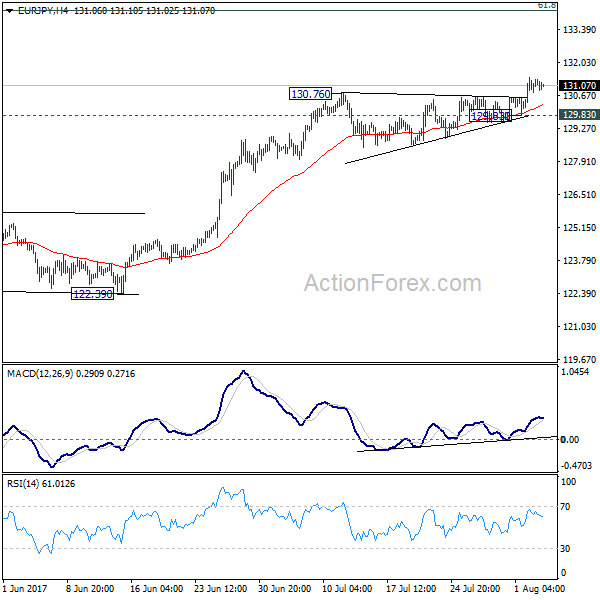
Intraday bias in EUR/JPY remains on the upside for the moment. Current rally is now expected to target long term fibonacci level at 134.20. On the downside, break of 129.83 support is needed to indicate short term topping. Otherwise, outlook will remain bullish in case of retreat.
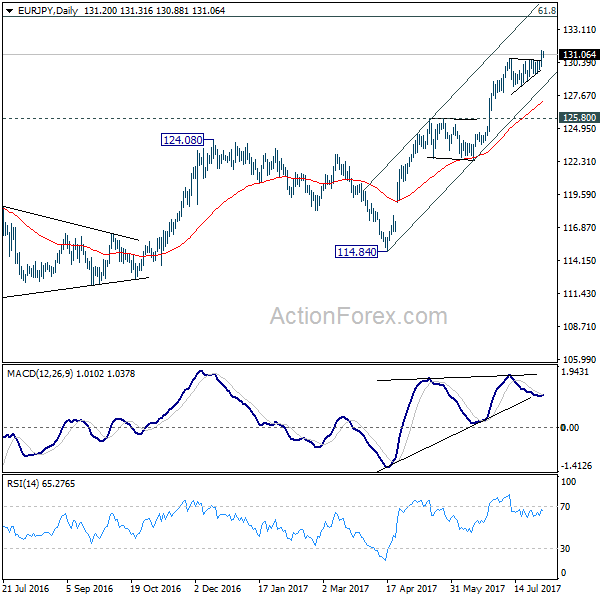
In the bigger picture, the down trend from 149.76 (2014 high) is completed at 109.03 (2016 low). Current rally from 109.03 should be at the same degree as the fall from 149.76 to 109.03. Further rise is expected to 61.8% retracement of 149.76 to 109.03 at 134.20. Sustained break there will pave the way to key long term resistance zone at 141.04/149.76. Medium term outlook will remain bullish as long as 125.80 resistance turned support holds.
EUR/GBP Daily Outlook
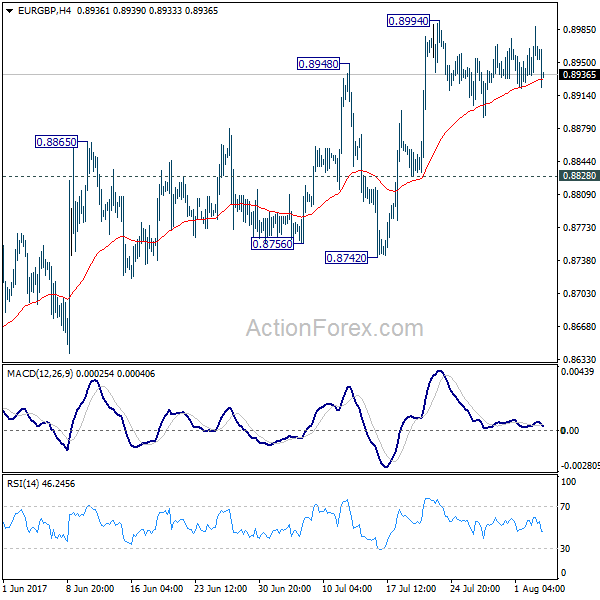
Daily Pivots: (S1) 0.8933; (P) 0.8961; (R1) 0.8991; More
EUR/GBP is still bounded in consolidation below 0.8994 and intraday bias remains neutral. In case of another retreat, downside should be contained by 0.8828 to bring rise resumption. Whole rally from 0.8312 is still in progress and break of 0.8994 will target 0.9304 key high. There is no clear sign of up trend resumption yet. Hence, we'll be cautious on strong resistance from 0.9304 to limit upside and bring another fall. However, break of 0.8828 will turn focus back to 0.8742 support. Break there will indicate near term reversal.
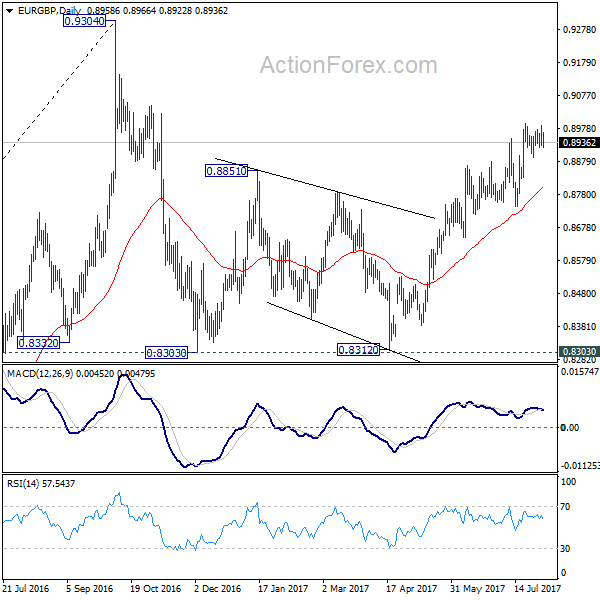
In the bigger picture, price actions from 0.9304 are viewed as a medium term corrective pattern. It's uncertain whether it is finished yet. But in case of another fall, we'd expect strong support from 0.8116 cluster support (50% retracement of 0.6935 to 0.9304 at 0.8120) to contain downside and bring rebound. Whole up trend from 0.6935 is expected to resume after consolidation from 0.9304 completes.
EUR/AUD Daily Outlook
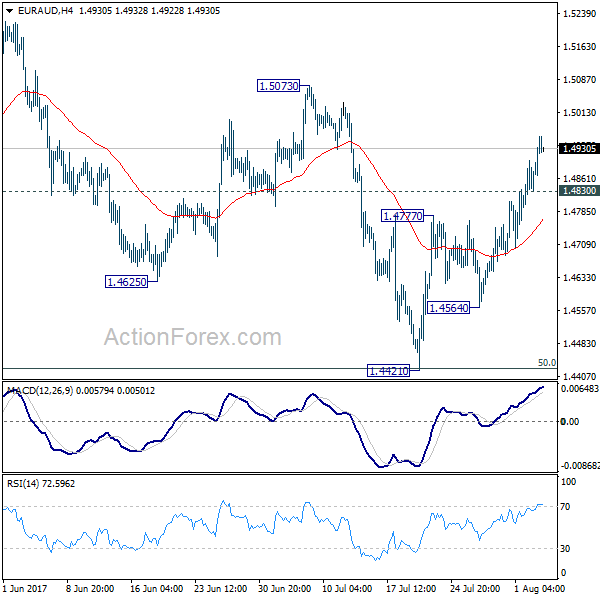
Daily Pivots: (S1) 1.4820; (P) 1.4861; (R1) 1.4920; More...
Intraday bias in EUR/AUD remains on the upside for 1.5073 resistance. As noted before, correction from 1.5226 should have completed with three waves down to 1.4421 already. Break of 1.5073 will likely resume the rise from 1.3624 and target 61.8% projection of 1.3624 to 1.5226 from 1.4421 at 1.5411 next. On the downside, below 1.4830 minor support will turn intraday bias neutral first. But outlook will stay cautiously bullish as long as 1.4777 resistance turned support holds.
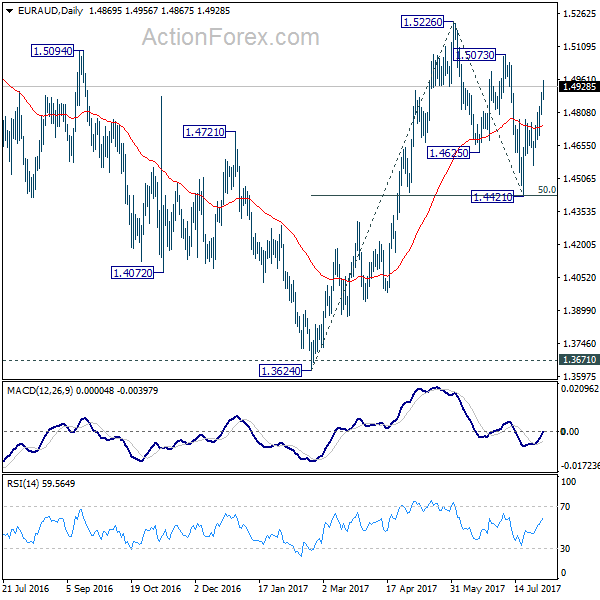
In the bigger picture, we're holding on to the view that corrective decline from 1.6587 medium term has completed at 1.3624. Rise from 1.3624 is expected to resume to retest 1.6587. The corrective structure of the fall from 1.5226 is affirming this view. Above 1.5226 will target a test on 1.6587 key resistance. However, another decline will dampen our view and would drag EUR/AUD lower to retest key support zone around 1.3624.
Is The BoE Going To Signal Less Urgency For A Hike On ‘Super Thursday’?
Today is 'Super Thursday' in the UK. Besides the BoE rate decision and the meeting minutes, we also get the quarterly Inflation Report, which Governor Carney will present at a press conference after the meeting. The consensus is for the Bank to keep its policy unchanged via a 6-2 vote. Given that the votes are the first piece of information we get, we expect the initial reaction in GBP to depend primarily on that, and subsequently, on what signals policymakers send regarding the likelihood of a rate hike this year.
At its latest meeting, the BoE appeared quite hawkish, signaling reduced tolerance for above-target inflation (CPI was +2.9% yoy at the time). A few days later, Governor Carney and Chief Economist Haldane both hinted that a rate hike may be in the works at one of the upcoming meetings. Nevertheless, soon thereafter, data showed that inflation slowed notably (to +2.6% yoy), pouring cold water on speculation for an immediate rate increase. What's more, although the labor market continued to tighten, both wage and GDP growth remain lackluster, enhancing the case for no action by the BoE this year.
At the time of writing, market pricing suggests roughly a 45% probability for a hike by year-end, which we think is reasonable given the data. The key question for GBP traders is: Will that probability rise or fall in the aftermath of this 'Super Thursday'? On balance, we think it's more likely to fall. The slowdown in inflation combined with uninspiring growth suggest that the BoE could signal less urgency than previously for a near-term hike. In addition, given the softness in Q2 GDP, there is a prospect for the Bank to revise down its growth forecasts. Bearing these in mind, we believe that the reaction in sterling today could be negative.
The key risk to our view is that despite economic developments suggesting a relatively low likelihood for a hike in the near-term, the BoE may want to keep speculation on that front alive in order to support the pound and thereby, curb inflation. In this case, Carney could say that the MPC discussed the prospect of a hike, but decided against it for now. Such signals, or a potentially closer-than-expected vote, could cause GBP to strengthen.
EUR/GBP has been trading in a consolidative manner during the last couple of weeks, between the support of 0.8890 (S2) and the resistance of 0.9000 (R2). Nevertheless, the overall path of the pair remains positive as marked by the uptrend line taken from the lows of November 2015. As such, we expect the bulls to drive the battle above the psychological barrier of 0.9000 (S2) in the not-too-distant future and initially aim for our next resistance of 0.9050 (R3). The trigger for such a rally could be a dovish BoE today. Even if the Bank appears hawkish and the pair tumbles, we would treat such a retreat as a corrective phase.
GBP/USD has been in an uptrend mode since the 21st of June. At the time of writing, the pair oscillates between the support of 1.3190 (S1) and the resistance of 1.3250 (R1). A dovish BoE today could cause the pair to tumble, but given that we expect the greenback to continue performing worse than the pound in the foreseeable future, we expect the bulls to take advantage of a potential retreat and aim for another test near 1.3250 (R1). Now, in case the Bank remains hawkish, the pair could break above 1.3250 (R1) without correcting lower. Such a break is possible to pave the way for our next resistance of 1.3350 (R2).
As for today's economic data:
As for the economic data, we get the UK services PMI for July and expectations are for an uptick. Even though something like that could support GBP a bit, the currency's intraday direction is likely to be decided by the BoE a couple of hours later. We also get Eurozone's final Markit services PMI for July and the bloc's retail sales for June. In the US, the ISM non-manufacturing PMI for July will be in focus. The forecast is for the index to have declined slightly, which may bring USD under renewed selling interest.
EUR/GBP
Support: 0.8920 (S1), 0.8890 (S2), 0.8830 (S3)
Resistance: 0.8975 (R1), 0.9000 (R2), 0.9050 (R3)
GBP/USD
Support: 1.3190 (S1), 1.3160 (S2), 1.3100 (S3)
Resistance: 1.3250 (R1), 1.3350 (R2), 1.3440 (R3)