Sample Category Title
USD/JPY: US ADP Non-Farm Payrolls
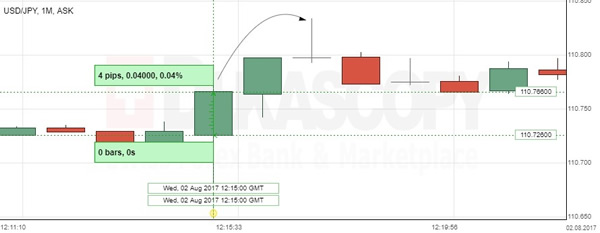
The USD/JPY exchange rate edged higher after the private survey showed a modest increase in job creation. After the publication, the US Dollar rose against the Japanese Yen by 0.04% to reach the 110.76 mark. ADP reported that non-farm sectors added 178K jobs in July, the second weakest change this year, compared with the upwardly-revised 191K increase in the previous month. According to the report, a slight fall in manufacturing jobs was offset by higher employment for service-related positions. Figures suggested that job creation remained strong enough to see the economy nearing to full employment. However, preliminary data is unlikely to determine the current condition of the US labour market, as the official report is set to come in on Friday.
GBP/USD: UK Construction PMI
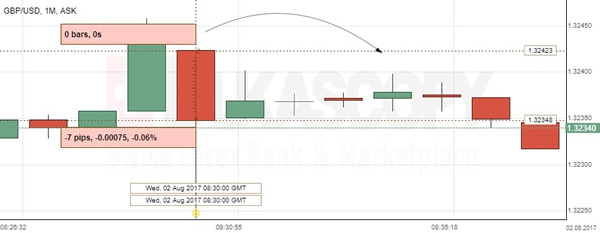
The British Pound depreciated against the US Dollar, as the data revealed that the UK construction industry grew at the slowest pace in 11 months in July. After the report, the GDP/USD exchange rate fell by 0.06% to be seen trading at 1.3234. Markit revealed that its PMI for Britain's construction sector dropped to 51.5 in July, below forecasts for a modest decline to 54.5 points. The report showed a decrease in commercial development and weaker house building, which reflected a slowdown in the property market. Moreover, post-election uncertainties and unclarity surrounding the country's economic outlook resulted in subdued demand for construction, while firms revealed less confidence about the future of the sector.
EUR/GBP Elliott Wave Analysis
EUR/GBP – 0.8932
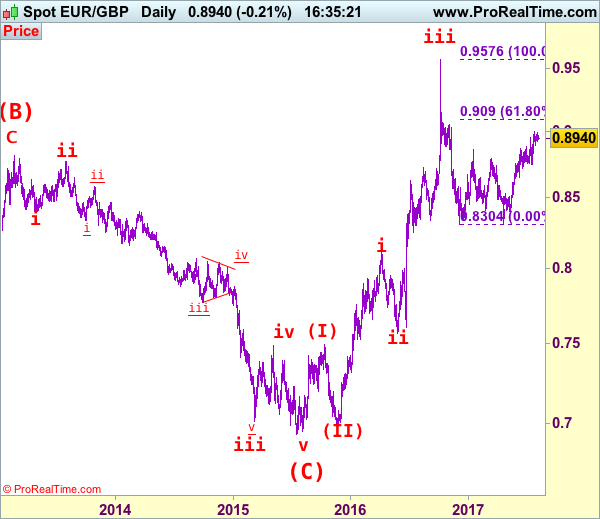
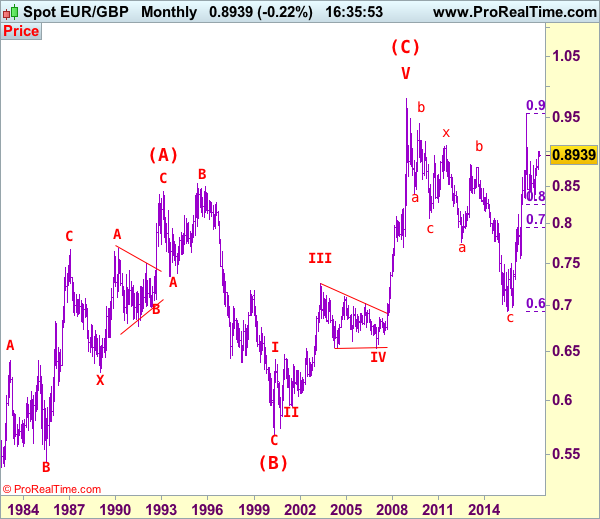
EUR/GBP – The major (A)(B)(C)-(X)-(A)(B)(C) correction from 0.9805 is unfolding and 2nd (A) has possibly ended at 0.6936.
As the single currency has maintained a firm undertone after breaking above previous resistance at 0.8950, adding credence to our bullish view that recent rise from 0.8304 (Dec 2016) is still in progress and upside bias remains for further gain to psychological resistance at 0.9000, break there would encourage for headway to 0.9090 (61.8% Fibonacci retracement of 0.9576-0.8304), having said that, break of previous resistance at 0.9142 is needed to signal the retreat from 0.9576 top (2016 high) has ended at 0.8304, bring headway to 0.9200-10 first.
Our latest preferred count is that the wave V of a 5-wave series from 0.5682 ended at 0.9805 earlier and major from there has possibly ended at 0.8067 as A-B-C-X-A-B-C. We are keeping our view that the entire correction from 0.9805 has possibly ended at 0.7756 and as labeled as the attached daily chart and impulsive move from 0.9084 has ended at 0.7756 as a 5-waver which marked either the (C) wave or the A leg of (C), a daily close above resistance at 0.8831 would suggest (C) leg has ended and headway towards 0.9084.
On the downside, whilst initial pullback to 0.8845-50 cannot be rule out, reckon 0.8825-30 would limit downside and bring another rise later. A daily close below 0.8780-85 would defer and suggest a temporary top is possibly formed, bring test of support at 0.9743 but break there is needed to add credence to this view, bring retracement of recent upmove to 0.8700, then towards previous support at 0.8652 which is likely to hold from here.
Recommendation: Buy at 0.8830 for 0.9030 with stop below 0.8730
Euro's long term uptrend started in Feb 1981 at 0.5039 and is unfolding as a (A)-(B)-(C) move with (A): 0.8433 (Feb 1993), (B): 0.5682 (May 2000) and impulsive wave (C) should have ended at 0.9805 with wave III ended at 0.7254 (May 2003), triangle wave IV at 0.6536 (23 Jan 2007) and wave V as well as wave (C) has ended at 0.9805.
We are keeping an alternate count that only wave III ended at 0.9805 and the correction from there is the wave IV and may extend weakness to 0.7700, however, it is necessary to see a daily close above resistance at 0.9143 would change this to be the preferred count.
USD/CAD Elliott Wave Analysis
USD/CAD – 1.2607
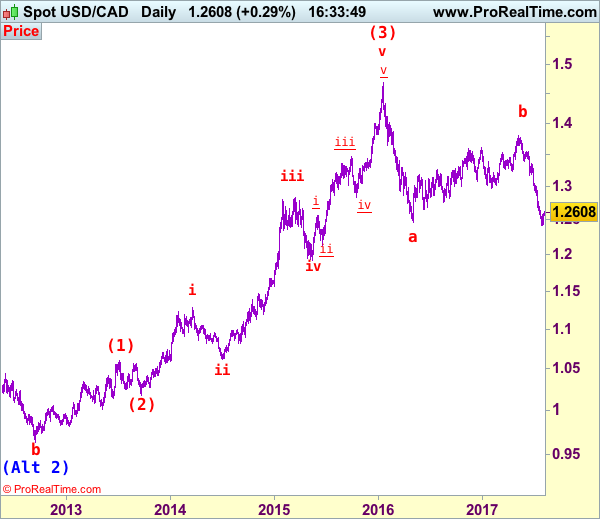
USD/CAD – Wave v ended at 0.9407 and only wave (3) of c ended at 1.4690 and one more rise cannot be ruled out.
The greenback finally recovered after falling to 1.2414 late last month and consolidation above this level would be seen initially and corrective bounce to 1.2700, then 1.2770-75 cannot be ruled out, however, reckon previous support at 1.2859 would cap upside and bring another decline later, below 1.2451 would bring retest of 1.2414 but break there is needed to confirm recent wave c decline has resumed for weakness to 1.2350, then 1.2300 but loss of momentum should prevent sharp fall below 1.2200-10 and price should stay well above 1.2000 level, bring rebound later. We are keeping our bearish count that wave b ended at 1.3794 and wave c has commenced for further fall to aforesaid downside targets.
We are keeping our view that the wave b from 1.0657 (a leg top) has possibly ended at 0.9633 with (a): 0.9800, wave (b): 1.0447 and wave c at 0.9633, the subsequent rise from there is now treated as wave c exceeded indicated upside target at 1.3770-80 and 1.4000 and wave (3) has possibly ended at 1.4690 and wave (4) correction has commenced for retracement back to 1.2410-20, then towards 1.2200.
On the daily chart, our latest preferred count remains that the A of (B) rally from 0.9059 low (7 Nov 2007) unfolded into an impulsive wave with i: 0.9059-1.0380, ii ended at 0.9819, iii at 1.3019 followed by triangle wave iv at 1.2026 , then wave v formed a top at 1.3066 and also ended the wave A. The wave B is unfolding as an double three a-b-c-x-a-b-c and is sub-divided as a: 1.2192, b: 1.2716 and wave c at 1.0784, followed by wave x at 1.1725, another set of a-b-c unfolded with 2nd a at 0.9931, 2nd b at 1.0674. the 2nd c has possibly ended at 0.9407, therefore, consolidation with upside bias is seen for major correction, indicated target at 1.3900 had been met and gain to 1.4700 would follow.
On the upside, whilst initial recovery to 1.2700 cannot be ruled out, reckon upside would be limited to 1.2770-75 and renewed selling interest should emerge there, bring another decline to aforesaid downside targets. Above previous support at 1.2859 would defer and risk a stronger rebound to resistance at 1.2944 but upside should be limited to psychological resistance at 1.3000 and price should falter well below another previous support at 1.3165 (now resistance), bring another decline later.
Recommendation: Sell at 1.2770 for 1.2470 with stop above 1.2870.
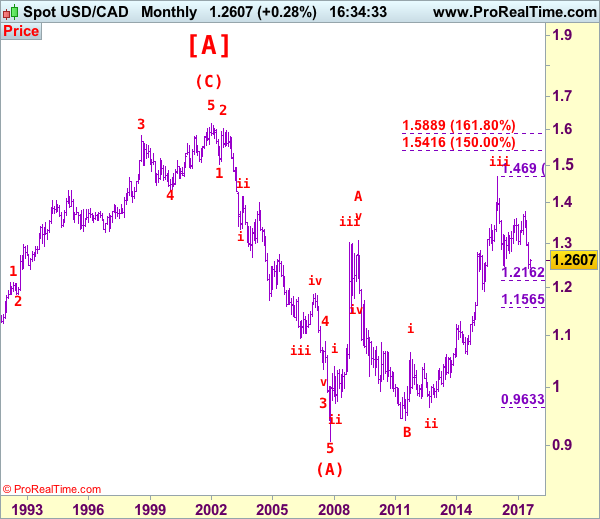
Longer term - The selloff from 1.6194 (21 Jan 2002) to 0.9059 (07 Nov 2007) is viewed as (A) wave which is a 5-waver as labeled on the monthly chart as below, the subsequently rally is labeled as (B) with impulsive A leg of (B) ended at 1.3066, wave B of (B) is unfolding which has either ended at 0.9407 or would extend one more fall but downside should be limited to 0.9200 and 0.9000 should hold.
US-North Korea-China Triangle: Intimidation Unlikely to Turn into War
An increasingly provocative North Korea is testing the limit of US' patience. Following another test of ICBM missile last Thursday, US President Donald Trump has accelerated sanctions against the hermit Kingdom. He has also pledged to give China a difficult time on trade amidst the latter's lack of pressure against North Korea's nuclear developments. Although intensifying geopolitical tensions might increase volatility of the financial markets, we believe the chance of war remains remote as the provocations-sanctions-negotiations process is indeed a routine of the Korean Peninsula problem over the past decades.
In July, North Korea tested fires the intercontinental ballistic missile (ICBM) into the Sea of Japan. Some experts indicated that the missile, the technology of which is legitimately possessed by the US, France, China, the UK and Russia, could potentially reach Alaska.
The UN, the US and South Korea have imposed various over North Korea. The latest UN resolutions (Resolution 2270, passed in March 2016 and Resolution 2321, passed in November 2016) involved banning of raw material exports to the country. Back in the Obama era, the Congress passed the North Korea Sanctions and Policy Enhancement Act of 2016 aiming to stave the country financially and militarily. The Trump administration is planning to use trade restrictions and economic measures against China so as to pressure china to accelerate action against its nuclear neighbor.
US-China Trade Relations
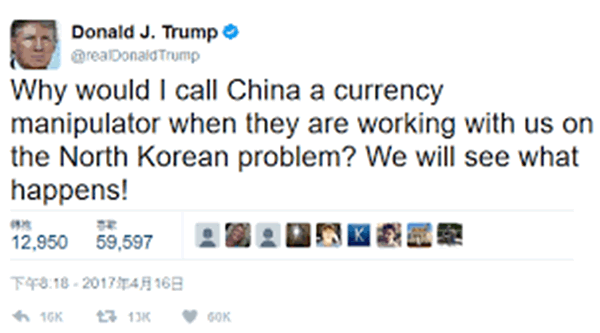
The world's two biggest economies are the biggest trading partners of each other. Total trade between the two countries amounted to US$578.6B in 2016. The biggest complaint from the US is its persistent trade deficit against China. Last year, US-China trade deficit remained at an elevated US$ 347B, though the amount has been down much from its peak. The US labeled China a “currency manipulator” from 1992-1994 amidst dissatisfaction over its action to depreciate the renminbi to promote exports. Trump repeatedly claimed that he would name China a “currency manipulator” during his election campaign and continue to say so until this April, when he suggested that his back away was due to China's promise to help on the North Korean issue.
Currency Manipulator
Besides political reason, there is little ground for the US to label China as currency manipulator due to its own criteria. The US Treasury Department uses three criteria to judge whether a country is manipulating the currency: 1)a bilateral trade surplus of US$20B with the US; 2)current account surplus of more than 3% of GDP and 3) it buys foreign assets of 2% of output to weaken currency. Our analysis suggests that only the first criterion is met for the case of China as it is running a trade surplus of around US$ 300B against the US. Various estimates show that China's current account surplus has fallen below 3% of GDP at least since 2H15 and over 2015 and 2016, the People's Bank of China had sold US$ 80B of FX reserve to stabilize renminbi from massive selloff. Therefore, the second and third criteria are not met.
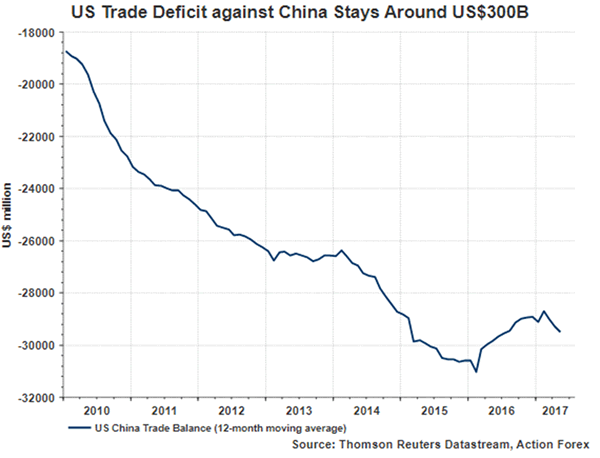
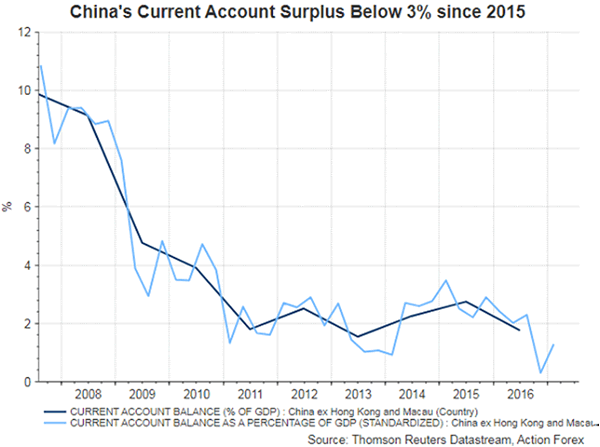
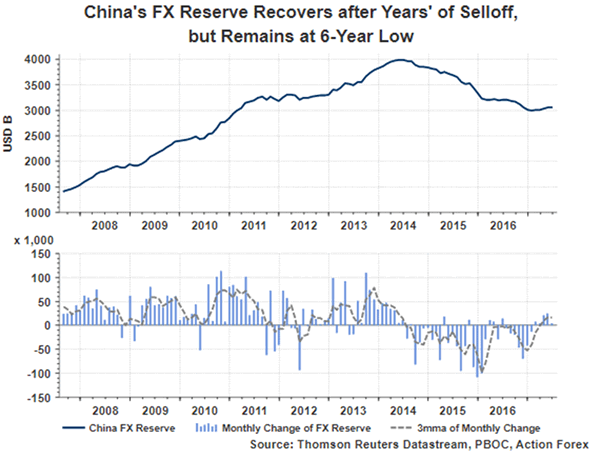
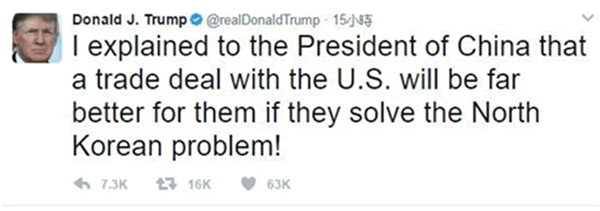
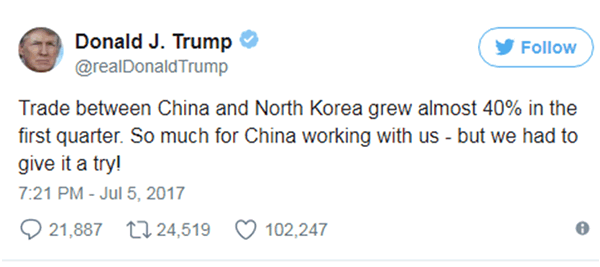
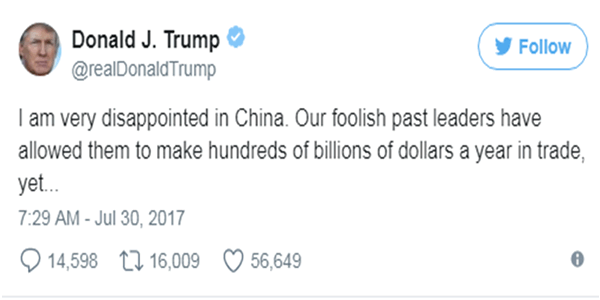
We believe Trump's complaint on currency and trade deficit have been a threat against China over the North Korean issue. also in April. Trump tweeted that he “explained to the President of China that a trade deal with the US will be far better for them if they solve the North Korean problem”. On July 5, Trump complained that “trade between China and North Korea grew almost 40% in the first quarter” and then on July 30, he appeared frustrated, noting that “I am very disappointed in China. Our foolish past leaders have allowed them to make hundreds of billions of dollars a year in trade”.
China-North Korea Relations
Indeed, China is the closest partner of North Korea, both geographically and economically. The two countries are only separated by the Yalu River, Paektu Mountain and the Tumen River, with Dandong, in the Liaoning Province of China, the largest city on the border. China is contributing over 80% of North Korea's international trade, exporting oil and refinery products, and fertilizer to the country and importing coal from it. Given its close proximity, China agrees on sanctions over North Korea, as long as they do not affect China's national interest. Military conflict and war are definitely not preferred. A likely failure of North Korea in case of war means inflow of tens of millions of refugees from the country to China. Moreover, a enlarged South Korea (North Korea collapses) after the war would strength US' strategic presence in Asia.
US-China-Korea Triangle
The Korean peninsula problem has long related to US' strategic interest in Asia. Trump's withdrawal from the Trans-Pacific Partnership has already dampened America's reputation and leadership amongst its Asian allies (South Korea, Japan, Taiwan, Philippines, etc.). How the White House handle North Korea would be critical to US' influence in the region. For now, we remain uncertain of the Trump's agenda, especially given his close relations with Russia. Yet, we believe any US trade sanctions against China would render to verbal trick given the close economic and political relations between the countries.
Foreign Exchange Market Commentary: EUR/USD, USD/JPY, GBP/USD, GOLD, WTI CRUDE, DJIA, FTSE100, DAX
EUR/USD
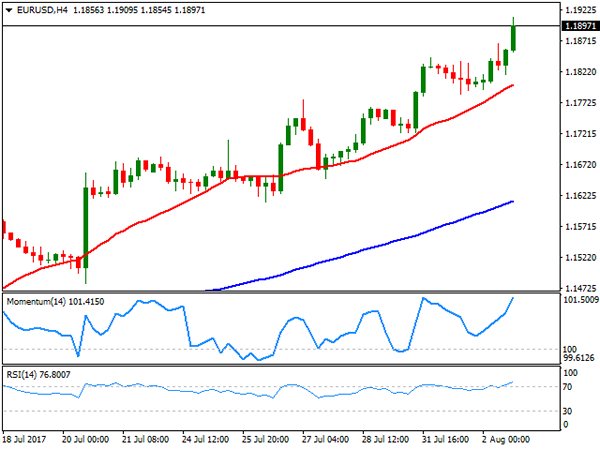
The EUR/USD settled at a fresh 2017 high right below the 1.1900 level and after posting 1.1909, as soft US data coupled with dovish comments from Fed's members. Trading was choppy across the board during the first half of the day, but the dollar had no chances, particularly after the release of a neutral US ADP survey, as July job's creation came in below expected at 178K, although June's figures was upwardly revised to 191K. The EU macroeconomic calendar was quite light, with only the release of industrial producer prices, down by 0.1% in June, in-line with market's expectations, and modestly up yearly basis to 2.5%, anyway supportive for ECB's tightening. In the US, Fed's Bullard expressed his concerns about soft inflation, saying that he doesn't support further hikes in the near term, not actually a surprise as he belongs to the doves' team, whilst Loretta Mester, reiterated her support for gradual hikes, but said that it could take a couple of months to see an uptick in local inflation.
The undeniable upward momentum persists heading into the Asian opening, as in the 4 hours chart, the 20 SMA continues leading the way higher, providing a dynamic support now at 1.1800, whilst technical indicators accelerated north, entering overbought territory and at fresh weekly highs. The market may enter in wait-and-see mode on Thursday after the release of services and composite PMIs in the EU and the US and ahead of the US Nonfarm Payroll report, with dips still seen as buying opportunities.
Support levels: 1.1845 1.1800 1.1765
Resistance levels: 1.1910 1.1950 1.1990
USD/JPY
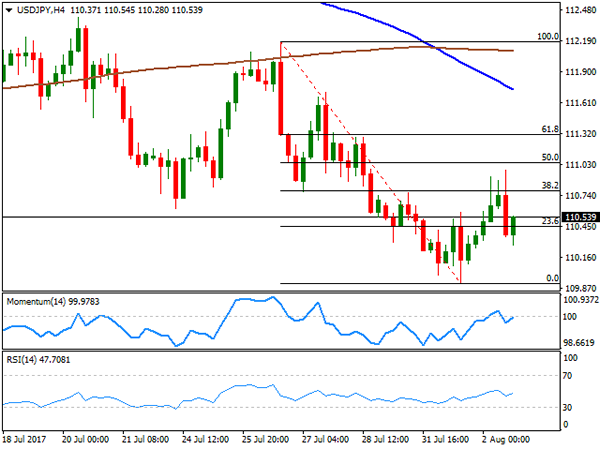
The USD/JPY pair neared 111.00 early US session, backed by a positive mood among stocks' traders, steady yields, and the US ADP employment survey, which was short of disappointing investors. The US private sector added 178,000 new jobs in July, slightly below the 185K expected, while June's figure was revised higher from 158K to 191K, whilst the Dow Jones Industrial Average traded beyond 22,000 for the first time ever on strong earnings reports. The USD/JPY pair, however, changed course in the US afternoon, trimming most of its daily gains, on dovish comments from Fed's officers, concerned on inflation and further limiting chances of further rate hikes in the US. The 4 hours chart shows that the price retreated after failing to settle above the 38.2% retracement of its latest decline between 112.18 and 109.91 around 110.80, now the immediate support, whilst the 100 SMA extended its decline below the 200 SMA, both far above the current level, as technical indicators hover around their mid-lines with no clear directional strength. Overall, the risk remains towards the downside, with a break below 109.90 required to confirm a new leg lower towards 108.80.
Support levels: 109.90 109.40 108.80
Resistance levels: 110.35 110.80 111.20
GBP/USD
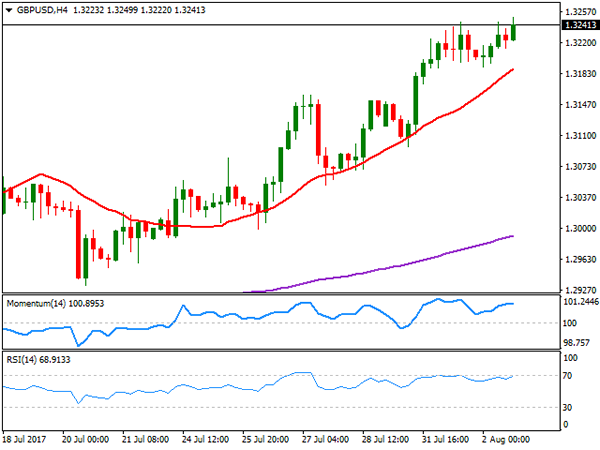
The GBP/USD pair extended its advance by a few pips this Wednesday, settling at 1.3241, after printing 1.3250 in the US afternoon. Pound gains were limited by a soft UK macroeconomic figure, as the construction PMI resulted at 51.9 in July from 54.8 in June, amid lower volumes of commercial building and a softer expansion of housing activity, according to Markit. Sterling's fate will be determinate by the BOE, as the Central Bank will unveil its latest monetary decision, alongside with fresh economic forecast this Thursday. No changes in rates or the APP are expected, but market will be looking at how policymakers vote on a possible move, as latest inflation data, has gave Carney's doves a breath. The pair is overbought daily basis, although in the short term, there's still room to go, given that in the 4 hours chart, the 20 SMA maintains its strong bullish slope below the current level, whilst technical indicators consolidate well above their mid-lines. Pullbacks towards 1.3190, Tuesday's low will probably attract buying interest, although a break below it on BOE's outcome, could see the pair reaching 1.3120. Above 1.3260, on the other hand, the bullish momentum will likely accelerate driving the pair beyond the 1.3300 threshold.
Support levels: 1.3190 1.3150 1.3120
Resistance levels: 1.3260 1.3310 1.3350
GOLD
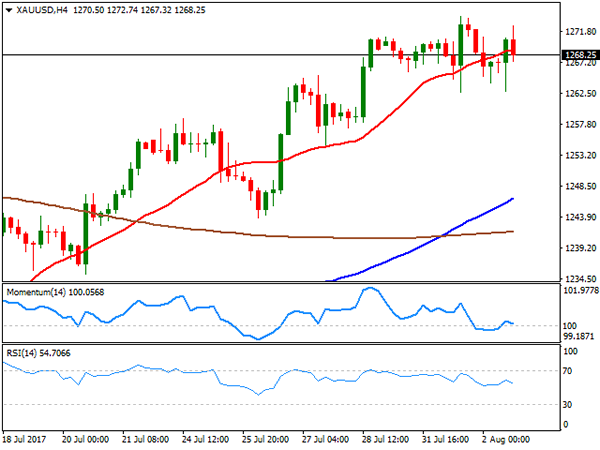
Spot gold ended little changed this Wednesday at $1,268.27 a troy ounce, down at the beginning of the day on soft physical demand in Asia. The commodity bounced back after the US opening as comments from Fed officers triggered concerns over US monetary policy, with the market now doubting on a third rate hike this year. Strong demand for riskier assets, limited gains, although spot holds at near two months highs. In the daily chart, the price remains well above all of its moving averages, with the 100 DMA still horizontal, with the 20 DMA accelerating north below it, and technical indicators in the mentioned chart retreating from overbought levels, supporting a downward corrective movement ahead on a break below 1,262.63, the weekly low and the immediate support. In the 4 hours chart, the price is currently hovering around a bullish 20 SMA, whilst technical indicators head south within neutral territory, indicating an increasing downward potential and in line with the longer term perspective.
Support levels: 1,263.65 1,257.30 1,246.40
Resistance levels: 1,274.05 1,283.30 1,290.10
WTI CRUDE OIL
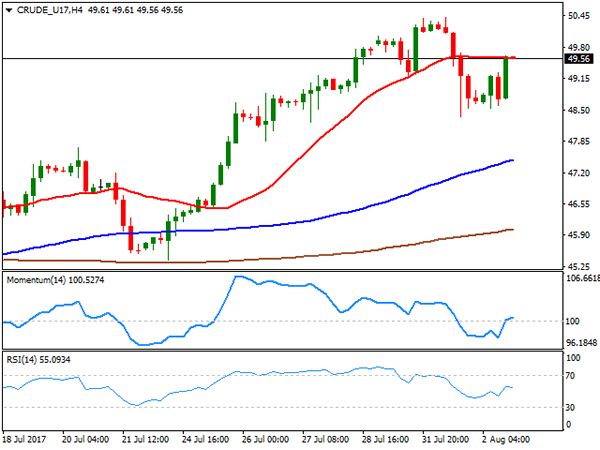
Crude oil prices recovered some ground this Wednesday, with West Texas Intermediate crude futures settling at $49.57 a barrel, despite disappointing US inventories´ data. Late Tuesday, the API reported an inventory build of 1.779 million barrels, while according to the EIA, stockpiles fell by 1.5 million in the week ended July 28th, nearly half market's expected decline of 2.96 million. The commodity fell as an immediate reaction to the news, but changed course amid broad dollar's weakness. The daily chart shows that the price continues trading between its 100 and 200 SMAs, while technical indicators have managed to recover modestly within positive territory, indicating that bulls are still in the driver's seat. In the 4 hours chart, the commodity pared gains around a horizontal 20 SMA, while technical indicators reached their mid-lines before losing directional strength, not enough to confirm further gains, but surely converging with the longer term perspective.
Support levels: 48.80 48.30 47.70
Resistance levels: 50.20 50.85 51.40
DJIA
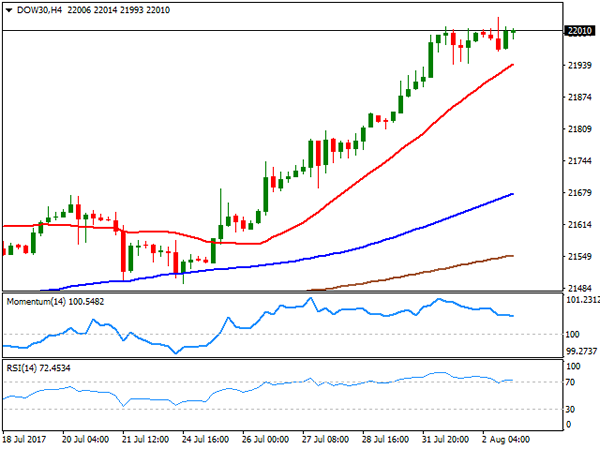
The Dow Jones Industrial Average closed at 22,016.04, up 52 points and above the 22,000 level for the first time ever, after Apple's latest resulted pushed the technology sector higher. The S&P advanced just 1 point, to settle at 2,477.57, while the Nasdaq Composite closed flat at 6,362.65. Apple was the best performer, up 4.99% after the company reported late Tuesday a quarterly revenue of $45.4 billion and quarterly earnings per diluted share of $1.67. Walt Disney Co. led decliners, ending the day 1.93% lower, followed by Verizon that shed 1.60%. The Dow maintains its bullish stance, despite technical indicators in the daily chart are heading north within overbought territory, whilst the 20 SMA accelerated its advance below the current level. In the shorter term, and according to the 4 hours chart, the Momentum indicator diverges south, retreating from overbought readings, whilst the RSI indicator holds around 72, whilst the 20 SMA extended its advance below the current level, all of which favors a continued advance for this Thursday.
Support levels: 21,993 21,940 21,895
Resistance levels: 22,036 22,080 22,140
FTSE100
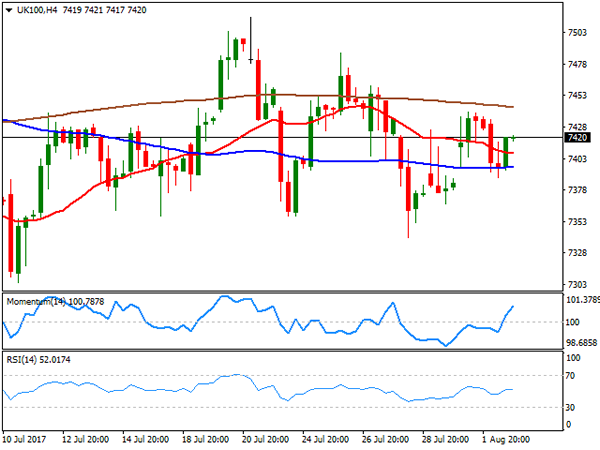
The FTSE 100 continues lacking directional strength, settling at 7,411.43, up 12 points or 0.16% this Wednesday, undermined by persistent strength in the Pound and a decline mining-related equities. Rio Tinto dragged the sector lower, despite reporting healthy profits, after warning that metal prices are likely to remain volatile for the rest of the year. Shares for the company closed 2.83% lower. Standard Chartered was the worst performer, shedding 6.05%, followed by Rolls-Royce that ended 3.68% lower. Old Mutual led advancers, adding 3.31%. The daily chart for the index presents a neutral stance, as it settled right above still directionless 20 and 100 DMAs, while technical indicators remain flat within neutral territory. In the 4 hours chart, the downward potential seems limited, as the Momentum indicator heads north above its mid-line, although with the index still trapped between modestly bearish moving averages and the RSI indicator flat at 52, little more could be expected at this point.
Support levels: 7,392 7,340 7,294
Resistance levels: 7,440 7,587 7,610
DAX
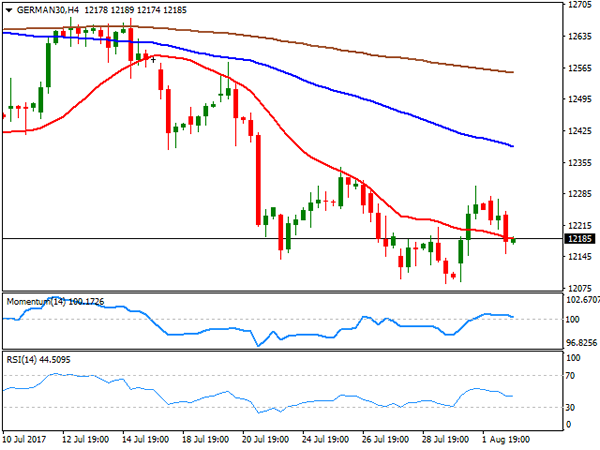
European equities edged lower, with the German DAX down 69 points to close the day at 12,181.48, weighed by EUR's strength, and weak banks' results. In Germany, Deutsche Lufthansa led advancers with a 2.27% gain, followed by Vonovia that added 1.38%. The worst performer was Heidelberg Cement that shed 3.49%, while Commerzbank lost 2.47% and Deutsche Bank ended 1.22% lower. The index seems poised to extend its decline, as in the daily chart, the Momentum indicator maintained and extended its bearish slope, now nearing oversold levels, whilst the RSI indicator resumed its decline, currently around 38. In the same chart, the 20 DMA crossed below the 100 DMA above the current level, reaffirming the negative stance. In the 4 hours chart, the index hovers around a bearish 20 SMA, whilst the Momentum indicator lacks directional strength, hovering around its mid-line, and the RSI indicator hovers around 44.
Support levels: 12,161 12,120 12,084
Resistance levels: 12,245 12,295 12,343
Economic Data, Monetary Policy To Drive Markets On Thursday
Investors are bracing for a deluge of market moving events over the next several hours, with Eurozone economic data and the Bank of England (BOE) set to make headlines.
Beginning in order of appearance, IHS Markit will release several batches of euro area PMI numbers at the start of European trading. Composite PMI indicators will be presented for France, Germany, and the 19-member Eurozone.
At 08:00 GMT, the European Central Bank (ECB) will issue its Economic Bulletin, which is published two weeks after each Governing Council meeting. The ECB voted to leave monetary policy on hold last month, as officials continued to monitor strong economic progress.
Earlier this week, Eurozone second-quarter GDP came in at 0.6%, in line with forecasts and matching Q1’s solid expansion.
Data on retail spending will also make headlines at 09:00 GMT. Eurozone retail sales are forecast to rise 0.1% in June, which translates into year-over-year gains of 2.6%.
Attention shifts to the BOE at 11:00 GMT. Although the central bank is widely expected to keep interest rates on hold, investors will be keeping tabs on how many MPC members vote in favour of a hike. Three dissenters emerged at the June policy meeting. A similar number on Thursday will provoke fresh debate about the future of UK monetary policy. It could also stoke gains in the British pound, which is highly sensitive to monetary policy.
BOE Governor Mark Carney is scheduled to hold a press conference alongside the official policy statement.
North America will also see active trading, as market participants absorb fresh batches of US economic data. The Labor Department will report on initial jobless claims at 12:30 GMT. A short while later, IHS Markit and the Institute for Supply Management (ISM) will issue separate PMI gauges covering the US service economy.
Finally, the Commerce Department will report on factory orders at 14:00 GMT.
EUR/USD
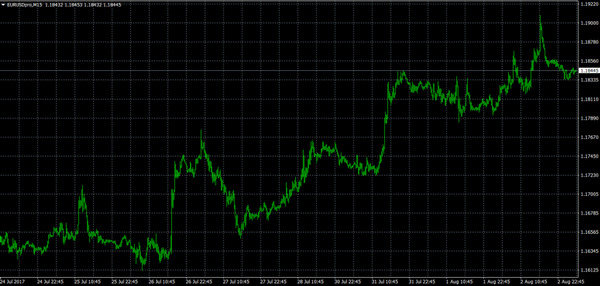
The euro broke through 1.19 US on Wednesday, raising both optimism and concern in the bull camp. Although the euro is backed by strong market forces, it may be rising too quickly, which leaves it exposed to a short-term correction. The EUR/USD was back down in the mid-1.18 region on Thursday. The pair faces immediate technical support at 1.1720.
GBP/USD
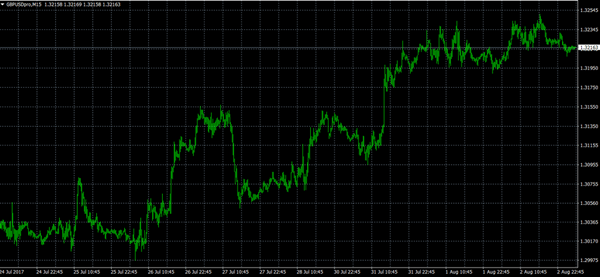
The British pound preserved daily gains north of 1.32 on Wednesday, as investors turned their attention to the BOE. Investors can expect a huge pop in cable should three or more dissenters emerge from the BOE meeting. For now, the GBP/USD faces immediate resistance near Wednesday’s session high of 1.3245.
GOLD
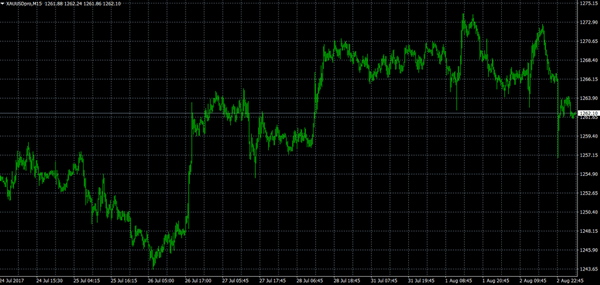
Gold prices pulled back sharply on Thursday amid a broad technical reversal. Bullion has made a valiant effort over the past four weeks but stumbled yet again as prices approached $1,280.00. The psychological $1,300.00 level remains elusive.
NZDUSD Turns Lower From 2-Year High After Reaching Overbought Conditions
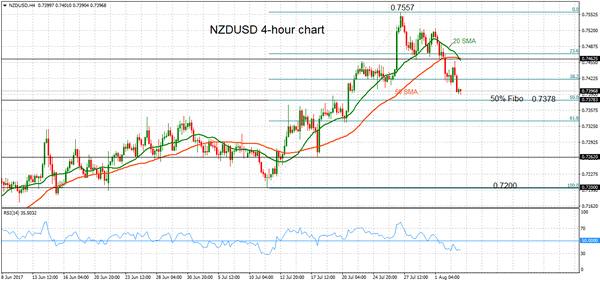
NZDUSD is making a corrective move lower after a recent uptrend stalled at a high of 0.7557 on July 27. The market became overextended at this more than 2-year high as indicated by RSI rising above the 70 level.
Following a short consolidation phase just above support at 0.7462, prices fell below this level which has turned into resistance. It is also where the 50-period moving average (MA) is currently located.
Further downside is expected since RSI has fallen below 50 into bearish territory. Support at 0.7378 is the next target. This is identified as the 50% Fibonacci retracement level of the upleg from the July 11 low of 0.7201 to the July 27 high of 0.7557. This is a critical level, which if broken, could accelerate a move lower and open the way to the 61.8% Fibonacci at 0.7335. Such a move would increase downside pressure for a move towards 0.7272 and then the key psychological 0.7200 level.
The technical picture is turning increasingly bearish as the shorter-term 20-period MA is pointing down and is about to cross below the 50-period one. This bearish signal combined with the falling RSI is strengthening the short-term bearish bias.
Only a move above 0.7462 would bring NZDUSD back to neutral. A break above the 0.7557 peak would see a resumption of the recent uptrend.
The near-term bias remains bearish under the 50 SMA while in the bigger picture, the bullish market structure is still intact.
Sterling Gains Ahead Of BOE, Trump Approves Russia Sanctions, US-China Trade At Risk
Markets have been relatively quiet during the Asian session with only a couple of notable economic data releases, which haven’t caused significant moves in the forex market. Looking ahead, the key event of the day will be Bank of England Governor Mark Carney’s speech and the central bank’s decision on interest rates.
Out of Asia, China’s Caixin services PMI and Australia’s balance of trade were the two main economic releases. The services PMI inched down to 51.5 in July from 51.6 the prior month and slightly below the expected level of 51.9. The balance of trade for the continent down under shrank to A$0.9 billion in June, much below expectations of A$1.8 billion and well below the downwardly revised figure for May, which stood at A$2.0 billion. The aussie lost about 40-pips against its US counterpart during the day to last trade at $0.7924.
The dollar was broadly steady against the yen during the first session of the day. The pair last traded at 110.61, and the dollar index was up 0.12% at 92.95. The non-farm payrolls report that will be released on Friday will be closely watched by dollar traders. In the mean time, President Trump is keeping everyone on their tip-toes with yet another political concern. According to a government official who spoke on condition of anonymity, Trump’s administration is preparing to investigate potential violations of intellectual property by China. If the probe goes ahead it will be the latest of several that could degrade ties between the world’s two largest economies and furthermore impact the overall global trade. This comes after US Congress approved a bill that puts sanctions against Russia, Iran and North Korea. President Trump reluctantly signed the bill last night.
During the European session, the Bank of England’s Monetary Policy Committee meeting and speech by BOE Governor Mark Carney could be of most interest. While markets are not expecting a hike in interest rates, traders will be looking out for a hawkish tone in Mark Carney’s speech. Should the BOE Governor indicate a tightening of monetary policy in the near future, sterling could react significantly. Pound/dollar was last moderately up, trading at 1.3231.
The euro eased 0.10%, slipping from yesterday’s intra-day high of 1.1909, which it last achieved in January 2015. Euro/dollar was last trading at 1.1845.
Oil prices were under pressure today following the EIA weekly report that showed oil inventories falling at a slower pace than expected and less than the prior week’s reduction. The EIA report follows the API figures that signaled a build in crude inventories. WTI was last trading at $49.31 a barrel while Brent was at $52.06.
Gold was also under pressure today, with the precious metal last trading at $1,262.42 an ounce.
Trade Idea: GBP/USD – Buy at 1.3145
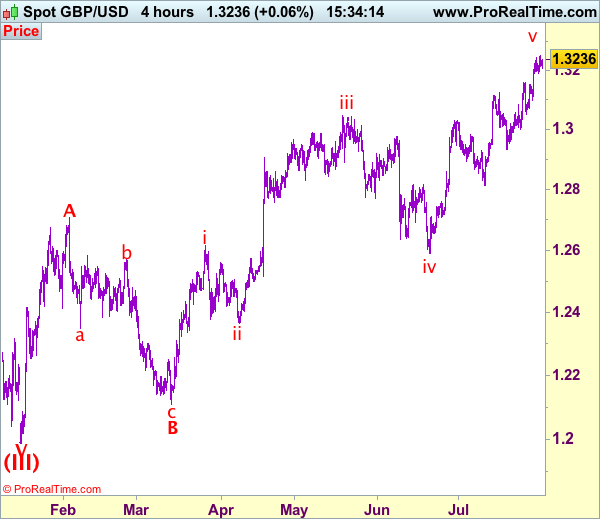
GBP/USD – 1.3232
Recent wave: Wave V of larger degree wave (III) has ended at 1.1986 and major correction has commenced from there for gain to 1.3000 and 1.3140-50
Trend: Near term up
Original strategy :
Buy at 1.3145, Target: 1.3345, Stop: 1.3085
Position: -
Target: -
Stop: -
New strategy :
Buy at 1.3145, Target: 1.3345, Stop: 1.3085
Position: -
Target: -
Stop:-
As sterling has continued trading with a firm bias after recent rally above previous resistance at 1.3126, adding credence to our bullishness for recent upmove to extend further gain to 1.3260-70, then towards 1.3300, having said that, as this move is still viewed as the final wave v of larger degree wave C, reckon upside would be limited to 1.3340-50 and price should falter below 1.3390-00, then sterling shall retreat sharply from there.
Our preferred count on the daily chart is that cable's rebound from 1.3500 (wave (A) trough) is unfolding as a wave (B) with A ended at 1.7043, followed by triangle wave B and wave C as well as wave (B) has ended at 1.7192, the subsequent selloff is the larger degree wave (C) which is still unfolding with minor wave (III) of larger degree wave 3 ended at 1.1986, hence wave (IV) correction is in progress which could either be a triangle wave (IV) of a complex formation but upside should be limited to 1.3500 and price should falter well below 1.4000, bring another decline in wave (V) of 3 for weakness to 1.1500, then 1.1200.
On the downside, whilst pullback to 1.3170-80 cannot be ruled out, reckon 1.3130-40 would hold and bring another rise. Only below said support at 1.3097 would abort and signal top is formed instead, bring retracement of recent rise to 1.3052 support but break there is needed to add credence to this view, bring correction to 1.3000, then 1.2980.