Sample Category Title
Trade Idea: GBP/JPY – Hold long entered at 145.55
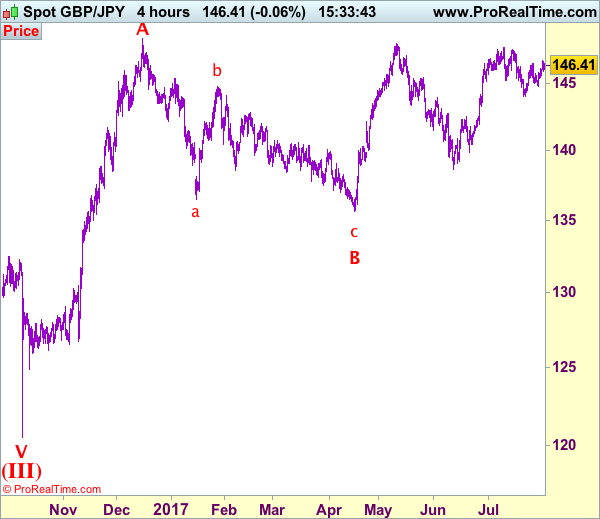
GBP/JPY - 146.35
Recent wave: Medium term low formed at 120.50 and (A)-(B)-(C) major correction has commenced with (A) leg ended at 148.45, hence wave (B) is unfolding for retreat to 131.00-10.
Trend: Near term up
Original strategy:
Bought at 145.55, Target: 147.55, Stop: 144.95
Position: - Long at 145.55
Target: - 147.55
Stop: - 144.95
New strategy :
Hold long entered at 145.55, Target: 147.55, Stop: 145.35
Position: - Long at 145.55
Target: - 147.55
Stop:- 145.35
Yesterday’s breach of resistance at 146.55 adds credence to our bullish view that the pullback from 147.75 has ended at 144.05 and consolidation with upside bias remains for further gain to 147.20-25, then towards said resistance, however, break there is needed to confirm recent upmove has resumed for headway towards previous chart resistance at 148.45 (2016 high) which is likely to hold from here.
In view of this, we are holding on to our long position entered at 145.55 and would exit on such rise. Below said support at 145.50 would defer and risk test of support at 144.85 but only break there would abort and prolong consolidation, risk weakness to 144.45-50, however, said support at 144.05 would hold from here, bring recovery later. A break of said support at 144.05 would add credence to our view that a temporary top has been formed at 147.75 earlier last month, bring retracement of recent upmove to 143.50, then towards support at 143.30.
Our preferred count is that larger degree wave V with circle is unfolding from 251.12 with wave (I) 219.34, (II): 241.38 and wave (III) is subdivided into 1: 192.60, 2: 215.89 (23 Jul 2008) and wave 3 ended at 118.87 earlier in 2009. The correction from there to 162.60 is wave 4 which itself is a double three and is labeled as first a-b-c ended at 151.53, followed by wave x at 139.03, 2nd a ended at 162.60, 2nd b at 146.75 and 2nd c leg of wave 4 ended at 163.00. Therefore, the decline from 163.00 to 116.85 is now treated as wave 5 which also marked the end of larger degree wave (III), hence wave (IV) major correction has commenced for retracement of the wave (III) from 241.38 and upside target at 183.95-00 (50% Fibonacci retracement of the wave (II) from 241.38) had been met, a drop below 160.00 would suggest wave (IV) has ended at 195.85, bring decline in wave (V) for initial weakness to 130 (already met) and 120.
Trade Idea: EUR/JPY – Buy at 130.70
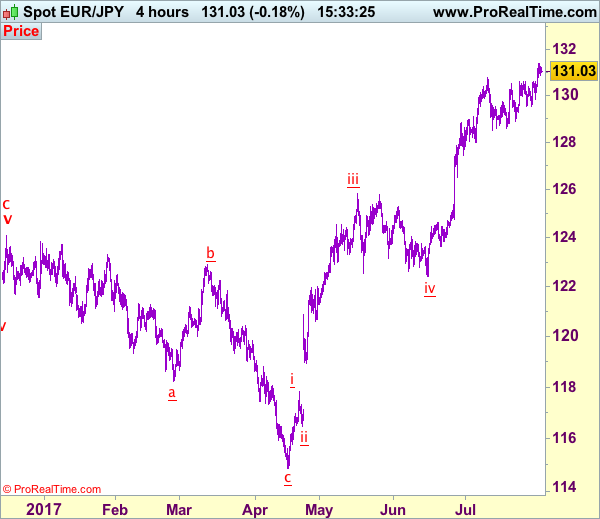
EUR/JPY - 131.05
Recent wave: wave v of (C) ended at 94.12 and major correction in wave A has ended at 149.79
Trend: Near term up
Original strategy:
Buy at 130.70, Target: 132.50, Stop: 130.10
Position: -
Target: -
Stop: -
New strategy :
Buy at 130.70, Target: 132.50, Stop: 130.10
Position: -
Target: -
Stop:-
The single currency has maintained a firm undertone after resuming recent upmove, adding credence to our bullishness and upside bias remains for further gain to 131.50-60, then 132.00-10, however, loss of upward momentum should prevent sharp move beyond 132.50-60 and reckon 132.90-00 would hold from here, risk from there is seen for a retreat later.
In view of this, would not chase this move here and would be prudent to buy euro on pullback as 130.55-60 should limit downside. Below 130.10-15 would risk test of support at 129.84 but break of latter level is needed to suggest a temporary top is possibly formed, bring test of 129.54, below there would provide confirmation, bring correction to 129.00 first.
Our latest preferred count is that wave (ii) is ABC-X-ABC which ended at 123.33 and wave (iii) is unfolding with wave iii ended at 100.77, followed by wave iv at 111.57 and wave v as well as the wave (iii) has ended at 97.04, followed by wave (iv) at 111.43 and wave (v) has ended at 94.12 which is also the end of the larger degree v, this also implied the major wave (C) has also ended there, hence major correction has commenced from there with (A) leg unfolding in its lower degree wave c which has possibly ended at 145.69. Under this count, A-B-C wave (B) has commenced with A leg ended at 136.23, wave B at 143.79 and wave C has possibly ended at 149.79.
Our larger degree count is that the decline from 139.26 is wave (C) and is sub-divided into a diagonal triangle i-ii-iii-iv-v with wave i - 105.44, wave ii- 123.33, wave iii - 97.03, wave iv - 111.43, followed by the final wave v as well as the end of wave (C) at 94.12, this also mark the bottom of larger degree wave B. Under this count, major rise in wave C has commenced as an impulsive wave with minor wave III ended at 145.69, wave V is still in progress for further gain to 150.00. Having said that, this so-called wave V could well be the first leg of larger degree 5-waver wave C and this wave C should bring at least a retest of wave A top at 169.97 (July 2008).
Trade Idea: AUD/USD – Hold short entered at 0.8030
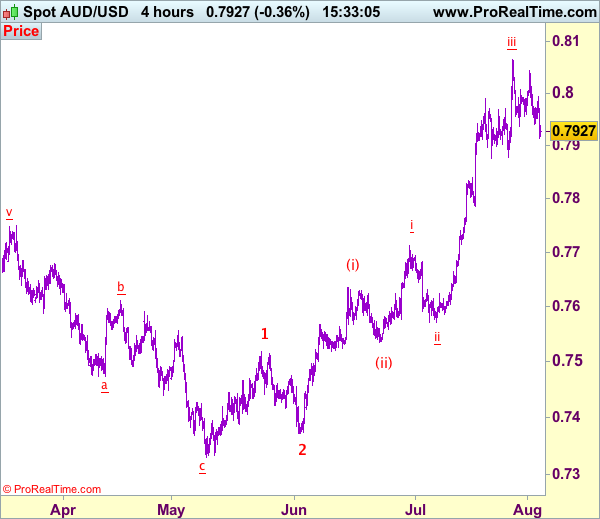
AUD/USD – 0.7928
Recent wave: Wave 5 ended at 1.1081 and major correction has commenced for fall to 0.7000 and then towards 0.6500-10
Trend: Near term up
Original strategy :
Sold at 0.8030, Target: 0.7880, Stop: 0.8030
Position: - Short at 0.8030
Target: - 0.7880
Stop: - 0.8030
New strategy :
Hold short entered at 0.8030, Target: 0.7880, Stop: 0.8000
Position: - Short at 0.8030
Target: - 0.7880
Stop:- 0.8000
As aussie has fallen again after faltering below 0.8000 level, retaining our view that further consolidation below recent high at 0.8066 (last week’s high) would be seen and the breach of indicated support at 0.7937 adds credence to our view that wave iii top is possibly formed at 0.8066, bring correction in wave iv to 0.7900, however, reckon previous support at 0.7875-78 would hold and renewed buying interest should emerge there, bring another rise later. Above said resistance at 0.8066 would signal recent upmove is still in progress for headway to 0.8100, then 0.8140-50 but overbought condition should limit upside to 0.8190-00, bring retreat later. We are keeping our latest bullish count that recent impulsive waves is unfolding as (1 2, (i)(ii), i ii) and may extend headway to aforesaid upside targets.
In view of this, we are holding on to our short position entered at 0.8030. A sustained breach below support at 0.7875 would defer and risk correction to 0.7810-20, however, still reckon downside would be limited to 0.7786 and price should stay well above wave i top at 0.7712.
On the 4-hour chart, the move from 0.8066 is the wave 5 with i: 0.8860, ii: 0.8315, wave iii is an extended move ended at 1.0183, iv: 0.9706 and wave v has ended at 1.1081 (also the top of entire wave 5). The subsequent selloff is the major correction which is unfolding as ABC-X-ABC and 2nd A leg has ended at 0.8848, followed by a-b-c wave B which ended at 0.9758, hence, 2nd C wave is now in progress and indicated downside target at 0.7000 and 0.6950 had been met, so further fall to 0.6710-20 cannot be ruled out.
EUR/GBP Candlesticks and Ichimoku Analysis
Weekly
• Last Candlesticks pattern: N/A
• ime of formation: N/A
• Trend bias: Near term up
Daily
• Last Candlesticks pattern: Doji
• Time of formation: 21 Jul 2017
• Trend bias: Up
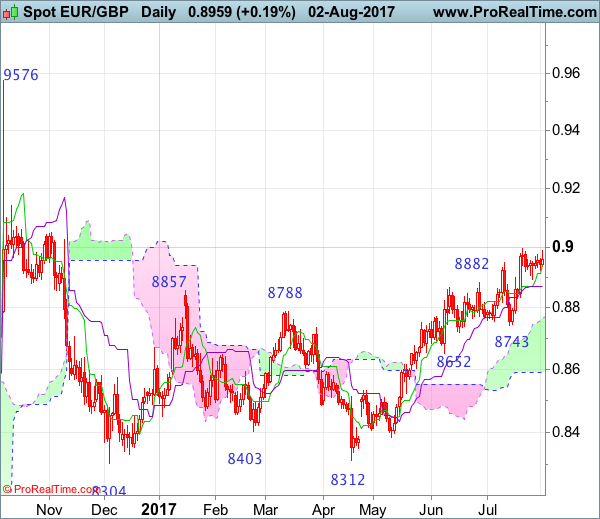
EURGBP – 0.8951
The single currency has traded narrowly after rising to 0.8995 resistance at 0.8995 and initial sideways trading would be seen, however, reckon downside would be limited to 0.8830-35 and renewed buying interest should emerge around 0.8795-00, bring another rise later to psychological resistance at 0.9000, break there would extend headway to 0.9090 (61.8% Fibonacci retracement) but loss of momentum should prevent sharp move beyond 0.9150-60, bring retreat later.
On the downside, whilst initial pullback to 0.8830-35, then 0.8800 is likely, renewed buying interest should emerge around latter level and bring another rise. A drop below indicated support at 0.8743 would defer and suggest a temporary top is possibly formed, bring correction of recent rise to 0.8690-00 and then towards previous support at 0.8652 but price should stay above the lower Kumo (now at 0.8597) and bring rebound later.
Recommendation: Buy again at 0.8795 for 0.8995 with stop below 0.8695.
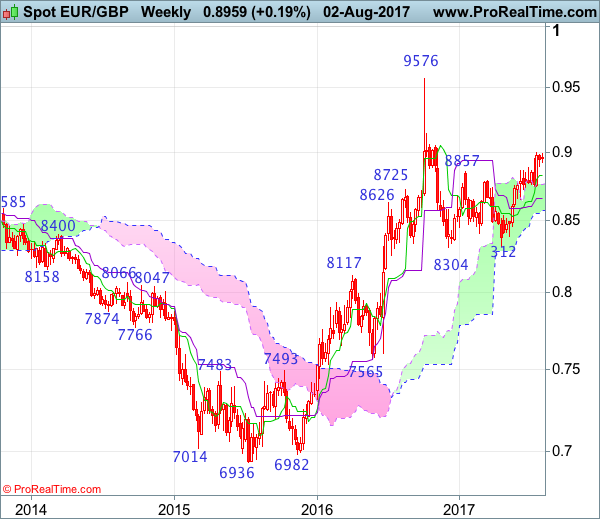
On the weekly chart, as the single currency has maintained a firm undertone after last week’s rally to 0.8995, adding credence to our bullish view that the rise from 0.8304 is still in progress and upside bias remains for this move to extend gain to 0.9000, then towards 0.9090 (61.8% Fibonacci retracement of 0.9576-0.8304) would be seen, however, a weekly close above resistance at 0.9142 is needed to retain bullishness and signal the entire correction from 0.9576 top has ended at 0.8304 and encourage for further subsequent gain to 0.9200-10.
On the downside, although pullback to the Tenkan-Sen (now at 0.8824) cannot be ruled out, reckon downside would be limited to 0.8795-00 and bring another rise later. Below support at 0.8743 support would defer and risk correction to 0.8700 but reckon downside would be limited to the Kijun-Sen (now at 0.8654) and the lower Kumo (now at 0.8751) should remain intact, bring another rally later.
Forex Technical Analysis: EUR/USD, USD/JPY, GBP/USD
EUR/USD
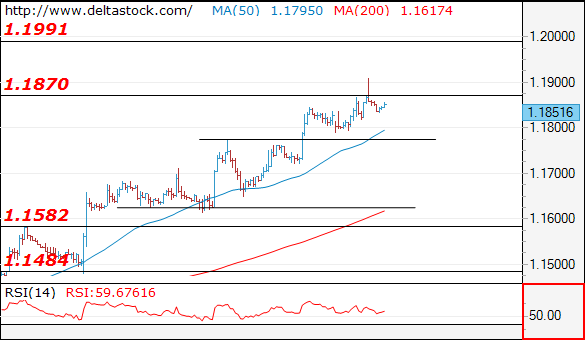
Current level - 1.1851
Yesterday's peak at 1.1910 is likely to be followed by a brief consolidation pattern, before next leg upwards, to 1.2000 sentiment area. Crucial support on the downside is projected at 1.1775.
| Resistance | Support | ||
| intraday | intraweek | intraday | intraweek |
| 1.1910 | 1.2000 | 1.1775 | 1.1580 |
| 1.2000 | 1.2240 | 1.1611 | 1.1480 |
USD/JPY
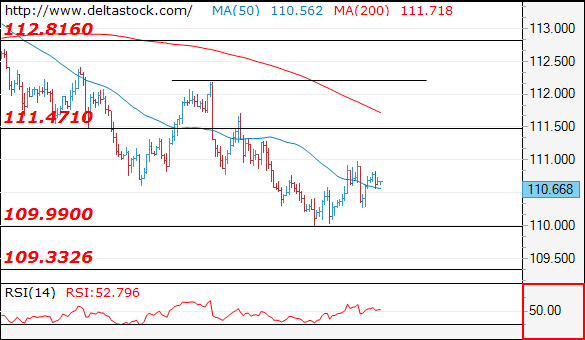
Current level - 110.66
The corrective phase is still underway and there is a risk of an intraday spike to 111.50 before drowning towards 109.30 target mark.
| Resistance | Support | ||
| intraday | intraweek | intraday | intraweek |
| 111.47 | 114.50 | 110.00 | 110.30 |
| 112.20 | 115.50 | 109.30 | 108.10 |
GBP/USD
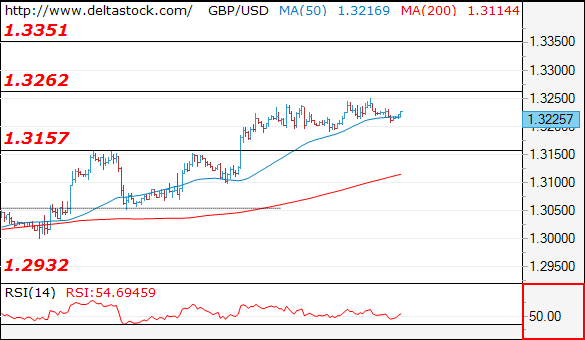
Current level - 1.3225
My outlook remains bullish above 1.3157 support, for a rise towards 1.3350 zone.
| Resistance | Support | ||
| intraday | intraweek | intraday | intraweek |
| 1.3260 | 1.3260 | 1.3157 | 1.2930 |
| 1.3350 | 1.3500 | 1.3050 | 1.2810 |
Is The BoE Ready To Hike Rates?
Sterling held above 1.32 against the dollar early Thursday as traders eagerly awaitthe Bank of England's policy meeting today. Bond yields declined from July highs but remained elevated, as some market participants believe that the BoE maysurprise, with a 25-basis point rate hike.
Although the central bank kept policy unchanged on 15 June, three MPC members voted to hike interest rates. This was followed by hawkish remarks from BoE's Governor Mark Carney and chief economist Andy Haldane, that a rate increase may be needed despite a weakening economy. The shift in policy stance led to repricing of U.K. assets, sparking the 4% rally in GBPUSD, which was also supported by a broadly weaker dollar.
I do not expect the outcome of todays' meeting to result in a rate hike. Firstly because consumer prices slipped from 2.9% to 2.6% in June, suggesting that the central bank may need to assess whether prices will ease further, after topping out in May. Secondly, there's still no clear transition deal for Britain's relationship with the E.U. after Brexit. I believe these two factors will keep the BoE on hold for now, but this does not necessarily mean the rally in GBP is over.
Kristin Forbes' departure from the BoE will likely lead to a 6-2 vote in favor of keeping interest rates unchanged today, with Ian McCafferty and Michael Saunders to remain the two dissenters. Silvana Tenreyro, who replaced Forbes is most likely to join the doves for now. The most interesting member to watch is Haldane. If he decides to join the hawks and vote for a rate hike, this would lead to further appreciation in both bond yields and the pound.
Another element traders should focus on, is the quarterly Inflation Report. If the BoE wants to prepare markets for policy normalization, this needs to be reflected in the Inflation Report, which is released along with the interest rate decision. In May, the BoE forecasted the economy will expand 1.9% in 2017, and inflation will increase to 2.7%. Since the release of the report, Q1 GDP was revised lower to 0.2% and Q3 GDP picked up only slightly by 0.3%. Real wage growth continued to decline, consumer confidence dropped, and most PMI's indicated slower activity. The only bright spot was unemployment falling further, to 4.5% from 4.6%. As a result, I think the BoE will lower their GDP forecast for the rest of the year, and probably inflation, which could dampen rate hike expectations for the months to come.
If there are no major surprises from the votes or quarterly inflation report, Carney's press conference will decide which direction the pound will take. Back in June, Mark Carney said that he was prepared to raise rates if U.K. business activity increased. If he sends a similar message at today's press conference, this would be another signal for bulls to jump in.
USDJPY Under Pressure Below Moving Averages But Maintains Neutral Outlook In Medium-Term
USDJPY maintains a bearish market structure in the short-term after retracing more than half of the uptrend that took place from the June 14 low of 108.80 to the July 11 high of 114.49. The pair is under pressure with strong resistance at 110.96 – the 61.8% Fibonacci retracement level of this recent upleg.
The risk is to the downside to target the key 110.00 level, which recently acted as support. A break here would see a re-test of the 108.80 low with scope to reach 108.00. A deeper decline below this level would start to change the bigger picture and bring about a bearish outlook from the current neutral one.
USDJPY has been in a neutral phase since April and has been trading in a range between 108.00 and 115.00 following an uptrend that took place from October 2016 until January this year.
Downside momentum in the near-term remains, giving scope for another extension lower since RSI is below 50 in bearish territory and USDJPY is trading below both the 50 and 200-day moving averages. Only a clear break above the 50% Fibonacci resistance at 111.63 would shift the focus back to the upside and dampen the bearish view.
The bearish crossover of the 50-day with the 200-day MA on July 18 is keeping the bearish short-term view in play while the medium-term outlook is still neutral.
EUR/CHF Candlesticks and Ichimoku Analysis
Weekly
• Last Candlesticks pattern: Long white candlestick
• Time of formation: 24 Jul 2017
• Trend bias: Up
Daily
• Last Candlesticks pattern: Morning doji
• Time of formation: 25 Jul 2017
• Trend bias: Up
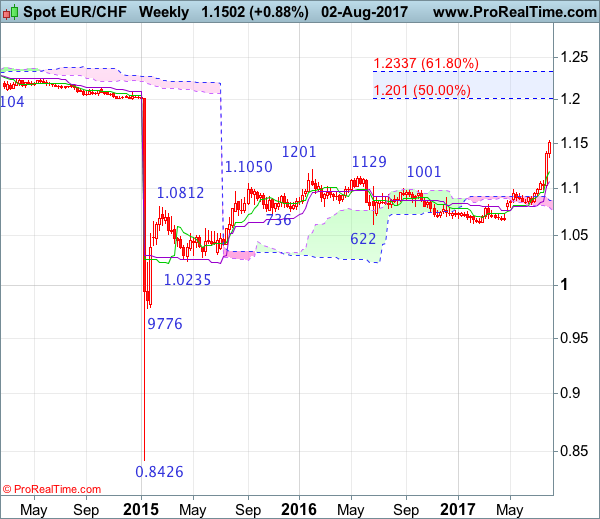
EUR/CHF – 1.1477
As recent upmove has accelerated after early anticipated resumption of medium term upmove from 1.0622 (2016 low), adding credence to our bullish view and upside bias remains for this move to extend further gain to 1.1550, then 1.1600-10, however, near term overbought condition should prevent sharp move beyond 1.1700, reckon 1.1770-80 would hold from here, risk from there has increased for a retreat to take place later this month.
On the downside, whilst initial pullback to 1.1400-10 cannot be ruled out, reckon downside would be limited to 1.1330-35 and bring another upmove later. A daily close below the Tenkan-Sen (now at 1.1266) would defer and bring test of the Kijun-Sen (now at 1.1221) but break there is needed to signal top is formed, bring retracement of recent rally to 1.1150-55, then towards 1.1100 but price should stay well above support at 1.1007 and the single currency shall head north again from there.
Recommendation: Buy again at 1.1335 for 1.1535 with stop below 1.1235.

On the weekly chart, last week’s rally formed a long white candlestick, adding credence to our bullish view that recent rise from 1.0622 is still in progress and the breach of previous resistance at 1.1201 suggests the major rise from 0.8426 low is still in progress and may extend headway to 1.1590-00, then towards 1.1700-10, however, near term overbought condition should prevent sharp move beyond 1.1800 and reckon 1.1900-10 would hold from here, risk from there has increased for a retreat to take place later this month.
On the downside, although initial pullback to 1.1400, then 1.1330-40 cannot be ruled out, reckon the Tenkan-Sen (now at 1.1179) would contain downside and bring another rise later. A weekly close below the Tenkan-Sen would defer and bring correction to 1.1100 but reckon the Kijun-Sen (now at 1.1078) would limit downside and support at 1.1007 should remain intact, bring another rise in late Q3.
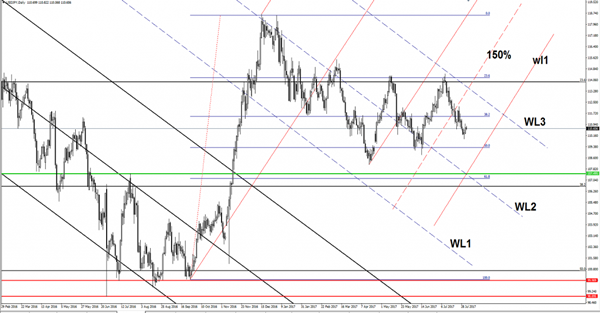
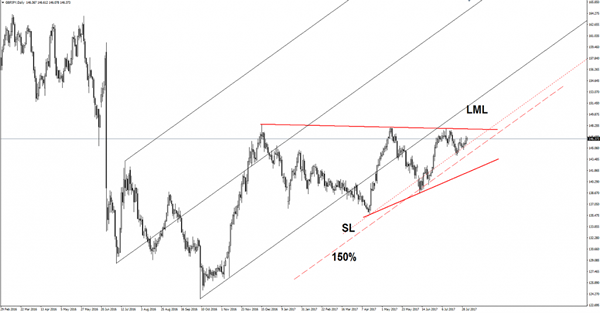
GBP/JPY Can Bears Step In?
GBP/JPY moves in range on the Daily chart, we’ll have a clear direction after a valid breakout from the chart pattern. Could start a broader drop if will fail to breakout above the down sloping red line. A valid breakdown below the 150% Fibonacci line (ascending dotted line) will confirm a sharp drop, while a valid breakout above the red line will signal an increase at least towards the lower median line (LML).
USD/JPY Undecided
USD/JPY needs a spark to be able to start a significant move. Continues to move in range on the short term, is located above the 110.50 level and is fighting hard to increase. We don’t have a clear direction because the Nikkei is narrowing near 20058 major horizontal resistance. We don’t have any trading opportunity at this moment, but we may have one if will come down to retest the 50% retracement level and the warning line (wl1).