Sample Category Title
UK’s Construction Sector Growth Hit 11-Month Low In July
For the 24 hours to 23:00 GMT, the GBP rose 0.09% against the USD and closed at 1.3221, despite data showing a sharp decline in UK's construction activity.
On the macro front, Britain's Markit construction PMI fell more-than-anticipated to a level of 51.9 in July, expanding at its weakest pace in eleven months, as heightened political uncertainty along with concerns over Brexit led to a slowdown in new orders. In the prior month, the PMI had recorded a level of 54.8, while market participants had envisaged for a fall to a level of 54.0.
In the Asian session, at GMT0300, the pair is trading at 1.3215, with the GBP trading marginally lower against the USD from yesterday's close.
The pair is expected to find support at 1.3190, and a fall through could take it to the next support level of 1.3164. The pair is expected to find its first resistance at 1.3246, and a rise through could take it to the next resistance level of 1.3276.
Looking forward, investors will pay attention to the Bank of England's (BoE) interest rate decision, scheduled later in the day. The central bank is widely expected to stand pat on monetary policy. Also, Britain's Markit services PMI for July, set to be released in a few hours, will be on investors' radar.
The currency pair is trading below its 20 Hr moving average and showing convergence with its 50 Hr moving average.

Japan’s Services Sector Expanded At A Slower Pace In July
For the 24 hours to 23:00 GMT, the USD rose 0.37% against the JPY and closed at 110.77.
On the economic front, Japan's consumer confidence index advanced to four-month high level of 43.8 in July, surpassing market expectations of a rise to a level of 43.5. In the previous month, the index had registered a level of 43.3.
In the Asian session, at GMT0300, the pair is trading at 110.64, with the USD trading 0.12% lower against the JPY from yesterday's close.
Overnight data showed that the nation's Markit services PMI declined to a level of 52.0 in July, compared to a reading of 53.3 in the previous month.
The pair is expected to find support at 110.29, and a fall through could take it to the next support level of 109.95. The pair is expected to find its first resistance at 110.98, and a rise through could take it to the next resistance level of 111.33.
The currency pair is showing convergence with its 20 Hr moving average and trading above its 50 Hr moving average.

Switzerland’s Manufacturing Sector Growth Surged To A 6-Year High In July
For the 24 hours to 23:00 GMT, the USD rose 0.53% against the CHF and closed at 0.9707.
On the data front, Switzerland's SECO consumer confidence index improved to a level of -3.0 July, meeting market expectations, reflecting greater optimism about the nation's economic growth and job market. In April, the index had registered a level of -8.0. Additionally, the nation's real retail sales rebounded 1.5% on an annual basis in June, after recording a revised drop of 0.8% in the previous month.
Another data indicated that the nation's SVME manufacturing PMI recorded an unexpected rise to a level of 60.9 in July, notching its highest level in six years. Investors had anticipated the PMI to fall to a level of 58.8, after registering a reading of 60.1 in the prior month.
In the Asian session, at GMT0300, the pair is trading at 0.9708, with the USD trading slightly higher against the CHF from yesterday's close.
The pair is expected to find support at 0.9667, and a fall through could take it to the next support level of 0.9625. The pair is expected to find its first resistance at 0.9732, and a rise through could take it to the next resistance level of 0.9755.
The currency pair is trading above its 20 Hr and 50 Hr moving averages.

Loonie Extends Its Losses In The Asian Session
For the 24 hours to 23:00 GMT, the USD rose 0.18% against the CAD and closed at 1.2571.
In the Asian session, at GMT0300, the pair is trading at 1.2591, with the USD trading 0.16% higher against the CAD from yesterday’s close.
The pair is expected to find support at 1.2555, and a fall through could take it to the next support level of 1.2518. The pair is expected to find its first resistance at 1.2612, and a rise through could take it to the next resistance level of 1.2632.
With no macroeconomic releases in Canada today, investor sentiment will be governed by global macroeconomic factors.
The currency pair is trading above its 20 Hr and 50 Hr moving averages.

Will The Bank Of England Disappoint?
Key Points:
- Inflation and Retail Sales slowing.
- Market has largely priced in the risk of hawkishness.
- Current risk profile is slanted to the downside.
The Bank of England's monetary policy committee is set to meet in the coming day to provide a decision that could prove relatively explosive for the Cable. Presently, the Cable is trading at around the 1 year high which suggests that the many within the market have already partially priced in the risk of hawkishness from the central bank. However, the question remains if the central bank will simply disappoint the wider market with a less than robust decision.
To review the current facts, the BoE met last month and surprised the market with a 5-3 vote to not raise the official bank rate. The risk of additional dissenting votes had largely not been reflected in the positioning ahead of the decision and the Cable suddenly took a bullish direction. What was particularly illuminating was Carney's statements following the event which suggested that the central bank would considering the rising inflationary pressures over the next few months. Subsequently, speculation has been rampant that the BoE is preparing to take lay out a plan for monetary tightening at the coming meeting.
However, the market could be in for some disappointment as the UK retail spending, and inflation figures, have not been particularly robust over the past month coming in at 0.6%, and 0.0%, respectively (M/M). Whether this becomes a trend or is simply an anomaly within the data will remain to be seen but it certainly complicates the central bank's looming decision. Subsequently, there is currently a disconnect between what the market is largely pricing in and the underlying economic data that the central bank is likely to make their decision upon.
Ultimately, the most likely scenario for the coming meeting is that the official bank rate will remain on hold at 0.25% and that the central bank will take a “data dependent” view moving forward. In fact, I expect that the present vote divide of 5-3 is likely to remain in play. It's clear that the bank will need to normalise policy at some stage this year but the coming MPC isn't likely to be it. However, the impact on the Cable could be relatively negative given that the market is pricing in some fairly sharp hawkishness, if not a hike, from the decision. Subsequently, keep a close watch on the Cable because the downside could be beckoning in the wake of the decision.
Daily Technical Analysis: EUR/USD Bullish Trend Reaches First Target At 1.1925
Currency pair EUR/USD
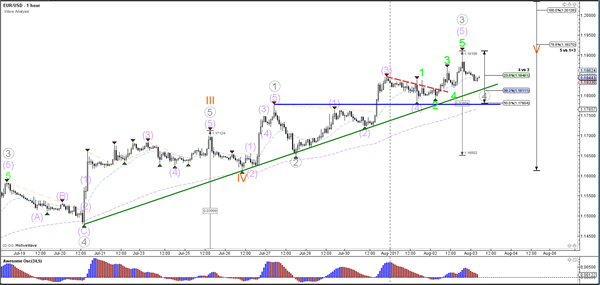
The EUR/USD has reached yesterday's first target at 1.1925. A continuation towards 1.20 is possible if price stays above the support trend lines (green/blue).
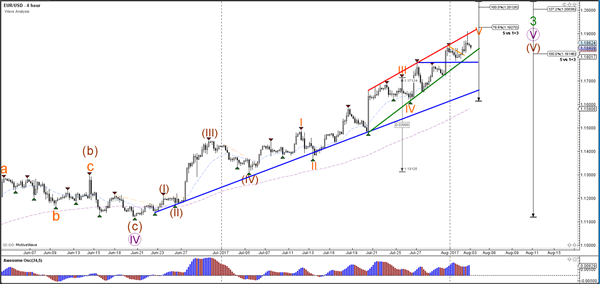
The EUR/USD completed an ending diagonal within the 5th wave (purple). The current bearish retracement could be part of a wave 4 (grey) if price manages to stay above the 50% Fibonacci level which is the invalidation spot for this wave structure.
Currency pair USD/JPY
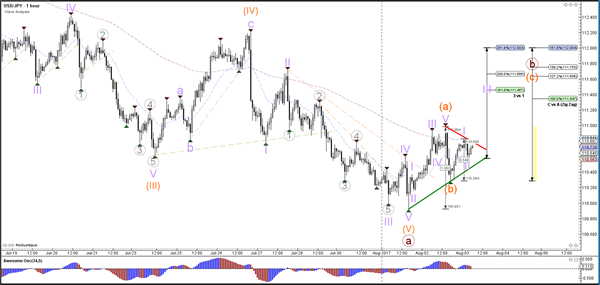
The USD/JPY failed to break the bottom and round level at 110, which was expected in yesterday's analysis due to the potential unfolding of an ABC zigzag pattern within wave B (brown). A bullish breakout above resistance (red) could signal the start of wave C (orange).
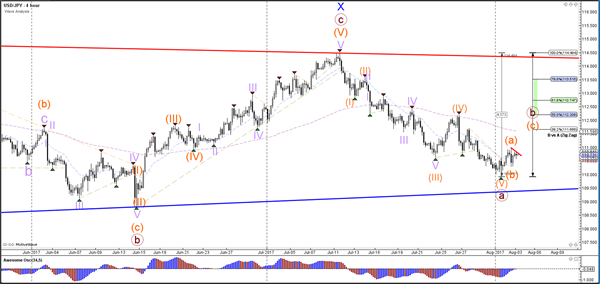
The USD/JPY potential breakout above resistance (red) could see a continuation towards the Fibonacci targets of wave 3 (purple) vs 1.
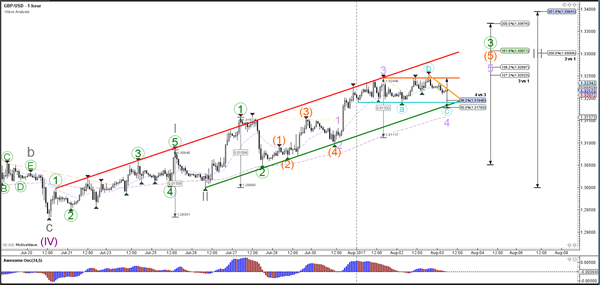
Currency pair GBP/USD
The GBP/USD did not manage as yet to break above the 1.3250 quarter level and is now building a correction. Whether the wave 3 (blue) will indeed be confirmed depends on how far the GBP/USD will move. A failure to break above the 100% Fibonacci target could indicate an ABC rather than a 123.
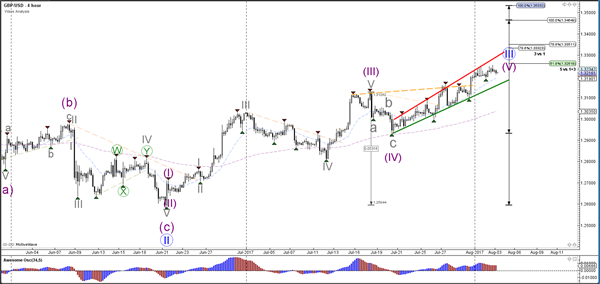
The GBP/USD could be building an extension of the wave 3 (green) with 5 internal waves (orange/purple). A pullback could be part of the wave 4 (purple) which means that the Fibonacci levels of wave 4 vs 3 could act as support.
AUD/USD Daily Outlook
Daily Pivots: (S1) 0.7941; (P) 0.7967; (R1) 0.7992; More...
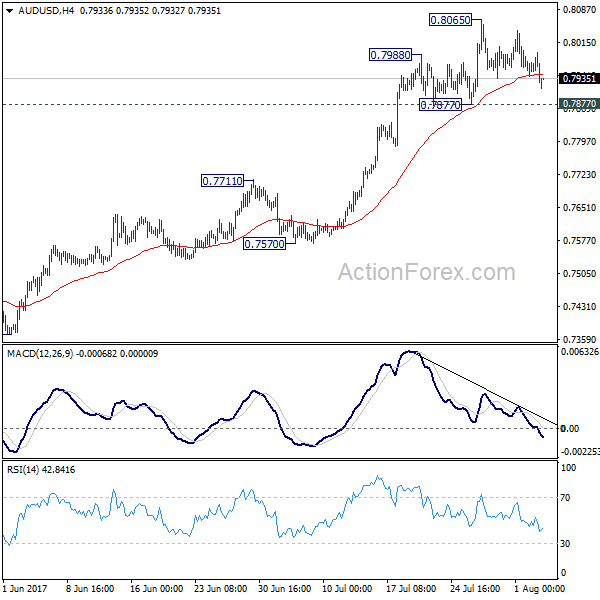
Intraday bias in AUD/USD remains neutral as consolidation from 0.8065 extends. Further rise is in favor with 0.7877 support intact. Break of 0.8065 will target 100% projection of 0.6826 to 0.7833 from 0.7328 at 0.8335. Nonetheless, break of 0.7877 will indicate short term topping, possibly with bearish divergence condition in 4 hour MACD. In such case, intraday bias will be turned back to the downside for 0.7711 resistance turned support.
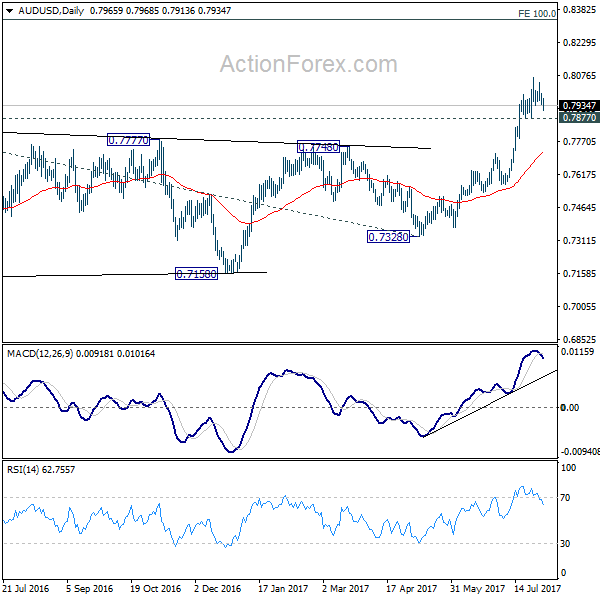
In the bigger picture, current development suggests that rebound from 0.6826 is developing into a medium term rise. There is no confirmation of trend reversal yet and we'll continue to treat such rebound as a corrective pattern. But in any case, further rise is now expected to 55 month EMA (now at 0.8100) or even further to 38.2% retracement of 1.1079 to 0.6826 at 0.8451. Break of 0.7328 support is needed to confirm completion of the rebound. Otherwise, further rise is now expected.
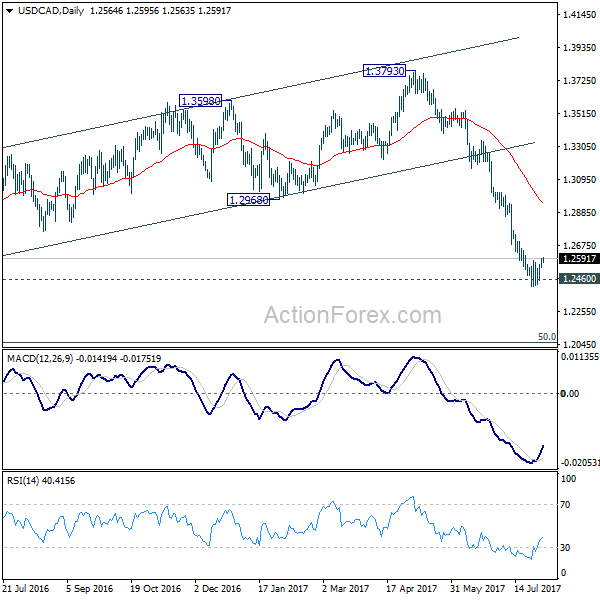
USD/CAD Daily Outlook
Daily Pivots: (S1) 1.2536; (P) 1.2564; (R1) 1.2597; More....
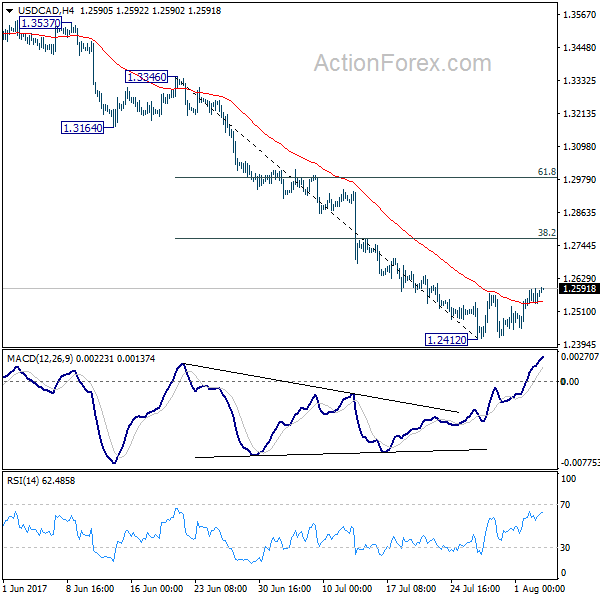
Intraday bias in USD/CAD remains mildly on the upside as correction from 1.2412 short term bottom continues. Further rise would be seen to 38.2% retracement of 1.3346 to 1.2412 at 1.2769. At this point, we'd expect upside to be limited there to bring fall resumption. On the downside, break of 1.2412 will extend recent fall from 1.3793 to next key fibonacci level at 1.2048.
In the bigger picture, price actions from 1.4689 medium term top are seen as a correction pattern. Fall from 1.3793 is seen as the third leg and should target 50% retracement of 0.9406 to 1.4869 at 1.2048. At this point, we'd look for strong support from there to contain downside and bring rebound. However, firm break there will target 100% projection of 1.4689 to 1.2460 from 1.3793 at 1.1564.
European Open Briefing: Risk Appetite Decreased Overnight
Global Markets:
- Asian stock markets: Nikkei and Hang Seng both down 0.20 %, Shanghai Composite lost 0.25 %, ASX 200 fell 0.40 %
- Commodities: Gold at $1261 (-0.85 %), Silver at $16.51 (-1.35 %), WTI Oil at $49.45 (-0.30 %), Brent Oil at $52.20 (-0.35 %)
- Rates: US 10-year yield at 2.26, UK 10-year yield at 1.23, German 10-year yield at 0.49
News & Data:
- China Caixin PMI Services Jul: 51.5 (Prev 51.6)
- China Caixin PMI Composite Jul: 51.9 (Prev 51.1)
- Australia Trade Balance (AUD) Jul: 856m (Est 1.8B Prev 2.47B)
- New Zealand ANZ Commodity Price Jul: -0.80% (Prev 2.10%)
- Japan Nikkei PMI Composite Jul: 51.8 (Prev 52.9)
- Japan Nikkei PMI Services Jul: 52 (Prev 53.3)
- Fed's Williams: Maybe 1 More Rate Hike In 2017, 3 More In 2018 Appropriate
- Fed's Williams: USD Decline Isn't a Big Factor in Inflation Outlook
- PBoC Fixes USDCNY Reference Rate At 6.7211(Prev 6.7205)
Markets Update:
Risk appetite decreased overnight following worse than expected Chinese economic data. Asian stock markets came under pressure, along with risk currencies such as the Aussie and New Zealand Dollar.
AUD/USD fell from 0.7970 to 0.7915 overnight. Support is now seen at 0.7880 and stronger at 0.7830. The outlook is still positive, and the Aussie is likely to run into decent demand below 0.79.
Meanwhile, NZD/USD fell below 0.74. The weak employment numbers from Tuesday have brought the currency under pressure. However, it should find good support around 0.7330.
USD/JPY is holding surprisingly well given the risk-off bias. The pair traded only briefly below 110 yesterday, and managed to bounce back to 110.90. While the outlook is still negative, USD/JPY is showing a lot of resilience given the broad Dollar weakness elsewhere. A break back above 111.30 resistance would signal that the recovery could extend to 112.
The Euro remains strong. While the charts suggest EUR/USD is heavily overbought in the short-term, it is not showing any signs of a reversal yet. There is little resistance until 1.20 now, and the pair is likely to test that level soon.
Upcoming Events:
- 08:45 BST – Italian Services PMI
- 08:50 BST – French Services PMI
- 08:55 BST – German Services PMI
- 09:00 BST – Euro Zone Services PMI
- 09:30 BST – UK Services PMI
- 10:00 BST – Euro Zone Retail Sales
- 12:00 BST – Bank of England Rate Decision
- 15:00 BST – US ISM Services PMI
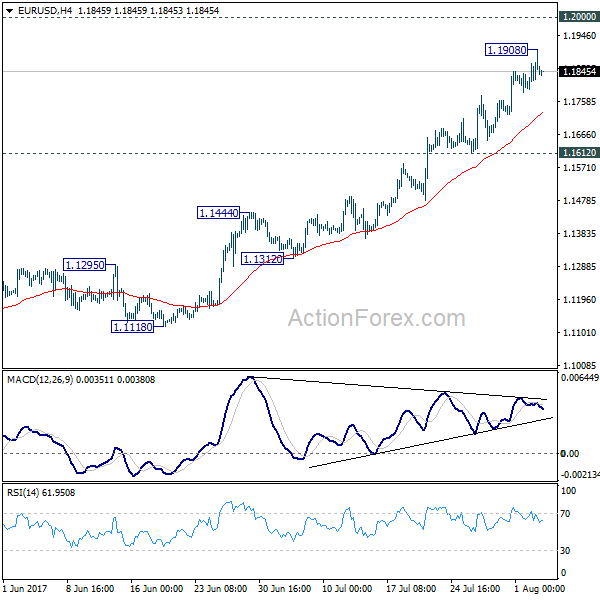
EUR/USD Daily Outlook
Daily Pivots: (S1) 1.1795; (P) 1.1853 (R1) 1.1912; More...
A temporary top is in place at 1.1908 in EUR/USD. Intraday bias is turned neutral first. Another rise is expected as long as 1.1612 support holds. Above 1.1908 will target 1.2 psychological level. Considering bearish divergence condition in 4 hour MACD, we'll be cautious on topping around there to bring correction. On the downside, break of 1.1612 will indicate short term topping and bring deeper pull back to 55 day EMA (now at 1.1379).
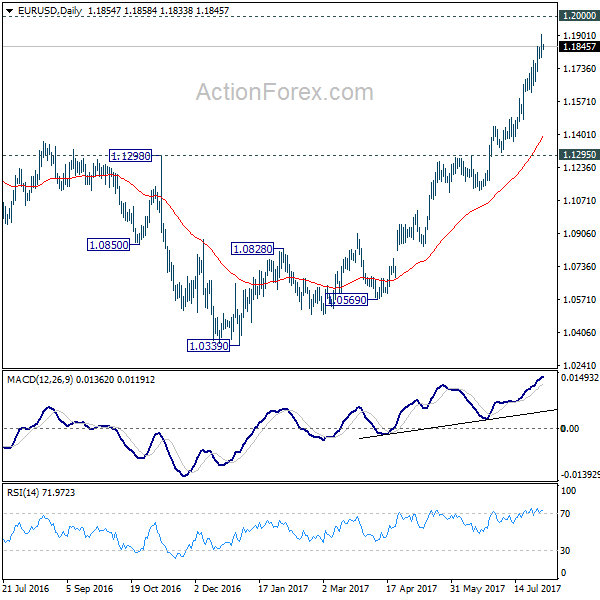
In the bigger picture, an important bottom was formed at 1.0339 on bullish convergence condition in weekly MACD. Sustained break of 55 month EMA (now at 1.1760) will pave the way to key fibonacci level at 38.2% retracement of 1.6039 (2008 high) to 1.0339 (2017 low) at 1.2516. While rise from 1.0339 is strong, there is no confirmation that it's developing into a long term up trend yet. Hence, we'll be cautious on strong resistance from 1.2516 to limit upside. But for now, medium term outlook will remain bullish as long as 1.1295 support holds, in case of pull back.