
Sample Category Title
Slower Growth Set to Keep BoE on Hold Despite Lower Unemploymen
We expect a 6-2 vote in favour of unchanged Bank Rate
Despite slower growth, the Bank of England (BoE) has turned more hawkish recently, as inflation has moved higher and the unemployment rate lower. Still, we do not expect a BoE rate hike before some time in 2019: GDP growth has slowed and has been weaker than the BoE anticipated, high inflation is temporary due to the weak GBP caused by Brexit, wage growth remains weak and does not indicate high underlying inflationary pressure and political uncertainty is high. We still view the core of the Monetary Policy Committee (including governor Mark Carney) as being tilted to the dovish side.
At this meeting, we expect the BoE to vote 6-2 in favour of keeping the Bank Rate unchanged against 5-3 on the previous occasion. The reason is mainly because Kristin Forbes, a known hawk voting for a hike, has left the committee and we do not think the new member will vote against Carney at the first meeting. Andy Haldane was leaning towards a hike in his recent speech but we think the August meeting is still too early for him to jump camp.
We expect the BoE to revise down its projection for GDP growth, reflecting that it has been too optimistic so far in 2017 and that growth is set to remain around the current level in coming quarters. The inflation path is likely to be broadly unchanged while the projection for the unemployment rate is likely to show a stabilisation around the current level of 4.5%.
When the BoE launched its big easing package in August 2016, it promised to consider whether the so-called Term Funding Scheme (TFS) should continue beyond February 2018 or not at the upcoming August 2017 meeting. As the BoE has become more worried about consumer credit growth, we expect it to announce that the TFS will end in February 2018.
6-2 vote could trigger a renewed test of the 0.90 level in EUR/GBP
EUR/GBP is trading at the high end of the 0.84-0.90 range, which we still see as the main trading range for the cross. The recent leg higher in EUR/GBP has been driven mainly by general EUR appreciation, but June's weaker-than-expected CPI figures from the UK also pushed the cross higher amid reduced expectations of a BoE rate hike in November.
The UK money market implicitly indicates around a 35% probability (9.5bp priced) of a November rate hike, while the timing of the first full 25bp rate hike has been pushed from July 2018 (as of 30 June) to December 2018. We still view the market's pricing of the BoE as slightly hawkish as we see little prospects of a rate hike this year, and given the current momentum for the euro, we maintain a cautious stance on GBP near term.
If we are right that the MPC will vote 6-2 in favour of keeping interest rates unchanged at the August meeting, it is likely to be interpreted as a modestly dovish signal and could trigger a renewed test of the 0.90 level.
What matters for GBP longer term are the Brexit terms, and the ongoing Brexit negotiations will be a source of volatility in coming years. Any turning point for the British currency would probably have to be driven by reduced uncertainty about the future agreement between the UK and the EU, which could entice foreign investors back to Britain. However, given the British government's weak parliamentary majority, we see little likelihood that skies will clear for GBP in the coming 12 months. Generally, we recommend investors and corporates hedging GBP assets/income to maintain a high hedge ratio.
35% probability of a BoE hike this year, according to market pricing
Actual inflation in line with expectations from the latest Inflation Report (IR)
Actual inflation in June was in line with the BoE's latest projection, as it fell back to 2.6% after the big jump in May to 2.9%.
The very high inflation print in May was one of the reasons why the BoE turned more hawkish, but the fall in June is likely to calm neutral BoE members.
We expect the updated inflation path to be broadly unchanged.
The BoE has consistently been too optimistic on wage growth and hence underlying inflation. This is also one reason why we do not think the BoE will hike soon.
Weaker growth than expected
UK GDP grew by 0.3% q/q in Q2 after 0.2% q/q in Q1 (which was the lowest among EU member states) and the performance in H1 17 has been the weakest since the European debt crisis.
This was 0.1pp below the BoE's forecast of 0.4% and the BoE has now underestimated growth in both Q1 and Q2.
The GDP growth path is likely to be revised down reflecting that the BoE was wrong and that growth is likely to continue at around the same pace in coming quarters.
Unemployment rate is now at NAIRU
Although the BoE revised down its projection for the unemployment rate in May, the unemployment rate continues to fall against expectations and is now at the BoE's NAIRU estimate of 4.5%.
This is another reason why the BoE has turned more hawkish, as members see only a 'small degree of spare capacity' left in the economy.
We expect the projection for the unemployment rate to be revised down in the updated projections.
The new path is likely to show the unemployment rate will stay at around the current level.
That said, the tight labour market has not translated into higher wage growth yet and given NAIRU is unobservable, the BoE may revise down its NAIRU estimate further at some point (not necessarily at this meeting).
GDP growth in H1 17 the weakest since the European debt crisis


PMIs indicated growth remained weak in Q2

Weaker GBP => higher import prices => higher inflation => eroding purchasing power
Commodity prices have also pushed up inflation
Inflation expectations have stabilised at higher level
EUR/USD Continues Rising Against a Depreciating Dollar
The EUR/USD price keeps moving within the rising trend on the background of a weaker greenback. The main factors keeping the US dollar under pressure are political tensions due to lack of progress on promised reforms by the Trump administration and investigations concerning ties between the American President with Russia. Investors are waiting for publication of the labor market report in the US on Friday. July's data on non-farm employment change from ADP came in today at 178,000, missing expectations of around 187,000.
The British pound was unable to overcome multi-month highs around 1.3250 and retreated amid disappointing statistics on construction PMI that in July decreased to 51.9 versus 54.8 in the previous period. Hawkish rhetoric of officials of the Bank of England during tomorrow's meeting on monetary policy may lead to further price growth.
The New Zealand dollar was hit by negative news on employment reducing by 0.2% in the second quarter of this year against the expected rise of 0.7%. The unemployment rate improved by 0.1% to 4.8% which met the forecasted figure.
Gold prices are consolidating after a confident rally. Investors are waiting for the release of labor market statistics in the US on Friday, which traditionally has a significant impact on the forecasts of interest rate hikes by the Fed. At the same time, the demand for safe haven assets remains strong due to uncertainty about future gains in the stock markets.
EUR/USD
The euro lost some previously gained ground but is still moving above the important level of 1.1800. Its breaking may lead to further declines to 1.1700 and 1.1620. Breaking through the lower boundary of the rising channel may become a signal to sell with potential goals at 1.1620 and 1.1500. The next upside targets are located at 1.1900 and 1.2000.
GBP/USD
The GBP/USD tested resistance near 1.3250 but was unable to gain a foothold above it. In case of success, and its overcoming, the bulls will try to approach 1.3350 and 1.3400. Descending correction is limited by the lower limit of the channel and support at 1.3150 - breaking through it may be a powerful signal to open short positions with target levels at 1.3050 and 1.2950.

NZD/USD
The kiwi quotes broke through the local support at 0.7460 and fell sharply. As a result, support at 0.7415 was approached. Breaking through this level may be a strong sell signal with objectives at 0.7200 and below. In order to resume rising dynamics, the price needs to climb above 0.7500 once again.
Gold
Demand for the precious metal remains high. Now the amplitude of price fluctuations has reduced and the quotes are moving mostly below 1270. The next upside target is near 1280, but we see a divergence between the price of gold and the MACD signal line, and that may become the basis for the start of a downward correction soon with the fall potential to 1252 and 1240.
Pound Shrugs Off Soft UK Construction PMI, BoE Rate Decision Looms
GBP/USD has inched higher in Wednesday trade. In the North American session, the pair is trading at 1.3230, up 0.18% on the day. On the release front, UK Construction PMI slowed to 51.9, well off the forecast of 54.3 points. In the US, ADP Nonfarm Employment Change rebounded with a reading of 178 thousand, but this was short of the forecast of 187 thousand. Thursday will be busy, as the UK releases Services PMI and the BoE will publish the benchmark interest rate and the inflation report. The US releases two key events – unemployment claims and ISM Non-Manufacturing PMI.
The pound continues to trade at high levels, and on Wednesday, GBP/USD touched a high of 1.3246, its highest level since September 2016. The week started off positively, as Manufacturing PMI in July improved to 55.1, beating the estimate of 54.4 points. Construction PMI could not keep pace, slowing to 51.9, its weakest reading since August 2016. The indicator reflects weakness in the construction industry, as commercial building and housing activity softened in July. With investors already jittery about what toll Brexit will take on the economy, weak numbers could push the pound to lower levels.
The US dollar has softened against its rivals, and even a strong gain from US Advance GDP last week failed to stem the greenback's slide. The first GDP report for the second quarter came in at impressive 2.6%, beating the estimate of 2.5%. This strong expansion should put to rest concerns of a second straight quarter of weak growth – Final GDP came in at just 1.4%. Still, EUR/USD soared in July, gaining 3.5%. Investors remain concerned that low inflation in the US could mean that the Fed will balk and not raise interest rates in December, despite all but promising to increase rates three times in 2017. In June, Fed Chair Janet Yellen dismissed low inflation as "transient", but she has since changed her tune, as economists remain at a loss to explain why a red-hot economy has not translated into stronger wage growth, and hence higher inflation. The markets are skeptical about a December hike, with the odds at just 42%, according to the CME Group.
Sterling at Fresh 10½-Month High ahead of BoE; Dollar Close to 15-Month Lows
Today's European session was a rather quiet one in terms of data, with forex market participants focusing on the number of jobs added by the US private sector in the preceding month, July construction PMI numbers for the UK and June eurozone producer prices. The dollar remained close to the multi-month lows from previous sessions.
In the US, the ADP report showed private employers adding 178,000 positions in the economy during July. This negatively compares to expectations for 185,000 additions, though a positive aspect of the report was the upward revision for June – 191,000 positions from the 158,000 that was previously reported. Dollar/yen rose within the first few minutes of the data release, though not by much. The eagerly-awaited non-farm payrolls report, which accounts for both public and private sector employment, will be released on Friday.
The dollar's index against a basket of major currencies was last 0.2% down on the day and marginally below the 93 handle. Earlier in the day, it fell extremely close to yesterday's 15-month low of 92.78. Meanwhile, dollar/yen was 0.1% up on the day, trading around just below 110.50.
On the political front, renewed talks of a trade dispute between the US and China also gathered attention today, with US President Donald Trump being reportedly close to a decision on how to react to what he perceives unfair trade practices on behalf of the world's second largest economy.
Back to today's economic releases, the UK Markit/CIPS construction PMI for the month of July was released at 51.9, significantly below expectations for a reading of 54.5 and the previous month's 54.8. July's figure constitutes an 11-month low and came on the back of a grimmer economic outlook and rising political uncertainty ahead of Brexit negotiations. Manufacturing PMI numbers were released yesterday at an upside surprise, while the respective figures for the services sector will be released tomorrow. Construction makes up 6% of the UK economic pie.
Sterling fell to as low as $1.3223 upon immediate release of the data from $1.3240 before the news, though it recovered soon after on those losses. Pound/dollar rose to a fresh 10½-month high of 1.3244 in today's trading – it last traded 0.2% up on the day. Relative to the euro, sterling was weaker on the day during late European trading hours with euro/pound trading at 0.8957. The Bank of England will be completing its two-day meeting tomorrow and is expected to maintain its benchmark rate at the record low of 0.25%. The British currency is expected to post gains should BoE Governor Mark Carney signal a more hawkish tone relative to the past.
Turning to eurozone-related releases, June producer prices contracted by 0.1% month-on-month as expected, while the previous month's rate was upwardly revised to -0.3% from -0.4% before. On an annual basis, prices rose by 2.5%, their slowest during the year. This was slightly above analysts' forecasts of 2.4%, but below May's 3.4% (the result of an upward revision from 3.3%). Euro/dollar was on a downward path a little before the data went public and extended losses following the release of the numbers. Still the pair last traded up on the day, while it hit a fresh 31-month high of 1.1868 earlier in the day.
The oil-linked Canadian dollar was hurt by yesterday's report by the American Petroleum Institute which showed crude stockpiles rising despite expectations for a fall. Today's Energy Information Administration's (EIA) report on US crude oil inventories added to pressure on the local dollar with dolar/loonie rising to the near two-week high of 1.2588 hit earlier in the today and attempting a move further above.
In commodities, gold initially fell on profit taking and on the rising risk appetite spurred by the bullish US stock market run. It later recovered though, last trading slightly up on the day $1270.22 an ounce, not far from the one-and-a-half-month high of $1273.96 that was recorded yesterday. The EIA weekly report showed oil inventories falling, albeit much less than expected and the previous week's drawdown. As a result, oil prices edged lower. WTI and Brent crude were last trading at $48.92 and $51.59 barrel, down 0.5% and 0.4% on the day respectively.
Cleveland and San Francisco Fed Presidents John Williams and Loretta Mester are scheduled to speak at 16:00 and 19:30 GMT respectively. They're both non-voting FOMC members.
Trade Idea Wrap-up: USD/CHF – Buy at 0.9600
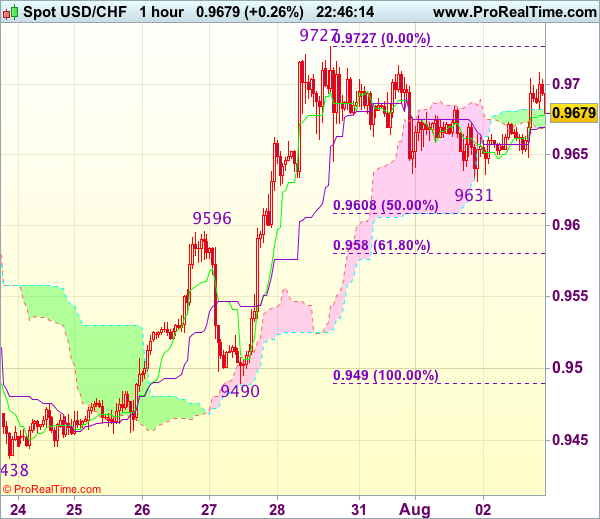
USD/CHF - 0.9668
Most recent candlesticks pattern : N/A
Trend : Near term up
Tenkan-Sen level : 0.9678
Kijun-Sen level : 0.9670
Ichimoku cloud top : 0.9680
Ichimoku cloud bottom : 0.9664
Original strategy :
Buy at 0.9600, Target: 0.9700, Stop: 0.9565
Position : -
Target : -
Stop : -
New strategy :
Buy at 0.9600, Target: 0.9700, Stop: 0.9565
Position : -
Target : -
Stop : -
Dollar has traded narrowly and near term sideways trading is likely to continue, although initial downside risk of another retreat to 0.9620-25 cannot be ruled out, reckon previous resistance at 0.9596 would turn into support and contain downside, bring another rise later, above resistance at 0.9727 would extend recent rise to 0.9750-60, then 0.9780 but reckon 0.9800 would hold from here.
In view of this, would not chase this rise here and would be prudent to buy dollar on subsequent pullback as previous resistance at 0.9596 should turn into support and contain dollar’s downside. Below 0.9580 (61.8% Fibonacci retracement of 0.9490-0.9727) would defer and suggest a temporary top is formed instead, bring correction to 0.9540-50 but price should stay well above support at 0.9490, bring another rise later.
Trade Idea Wrap-up: GBP/USD – Buy at 1.3130
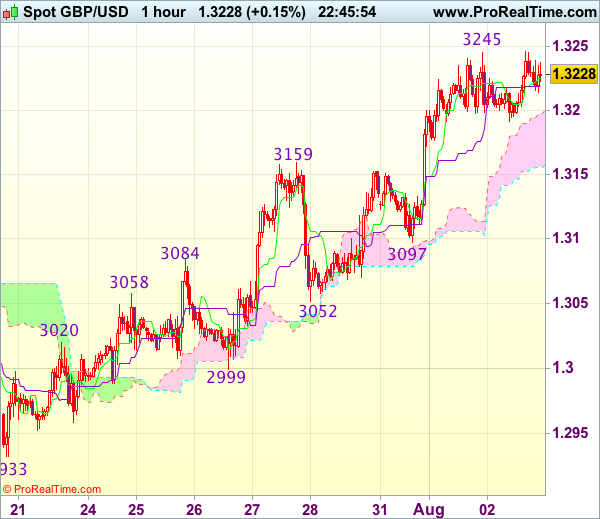
GBP/USD - 1.3236
Most recent candlesticks pattern : N/A
Trend : Near term up
Tenkan-Sen level : 1.3230
Kijun-Sen level : 1.3219
Ichimoku cloud top : 1.3197
Ichimoku cloud bottom : 1.3155
Original strategy :
Buy at 1.3130, Target: 1.3230, Stop: 1.3095
Position : -
Target : -
Stop : -
New strategy :
Buy at 1.3130, Target: 1.3230, Stop: 1.3095
Position : -
Target : -
Stop : -
Although cable eased after rising to 1.3246 earlier today and minor consolidation below tis level would be seen, reckon downside would be limited to previous resistance at 1.3159 and 1.3125-30 should hold, bring another rise later, above said resistance at 1.3245 would extend gain to 1.3275-80, however, near term overbought condition should prevent sharp move beyond there and reckon 1.3300-10 would hold from here, risk from there has increased for a retreat to take place later.
In view of this, would not chase this rise here and would be prudent to buy cable on pullback as 1.3125-30 should contain downside, bring another upmove later. Only below indicated support at 1.3097 would abort and signal a temporary top is possibly formed, bring further fall towards previous support at 1.3052.
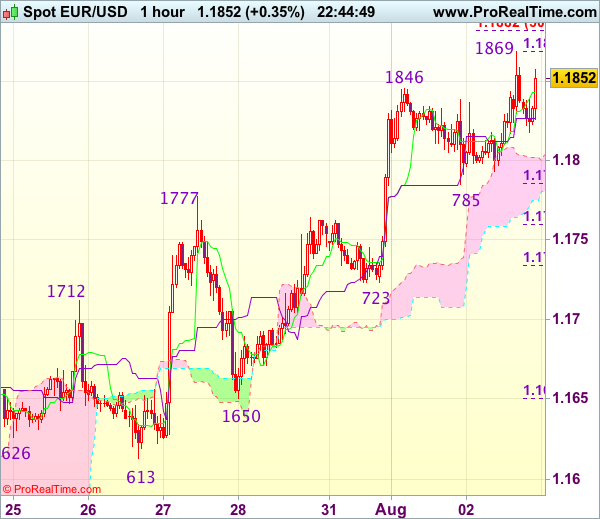
Trade Idea Wrap-up: EUR/USD – Hold short entered at 1.1850
EUR/USD - 1.1865
Most recent candlesticks pattern : N/A
Trend : Near term up
Tenkan-Sen level : 1.1844
Kijun-Sen level : 1.1827
Ichimoku cloud top : 1.1802
Ichimoku cloud bottom : 1.1775
Original strategy :
Sold at 1.1850, Target: 1.1750, Stop: 1.1885
Position : - Short at 1.1850
Target : - 1.1750
Stop : - 1.1885
New strategy :
Hold short entered at 1.1850, Target: 1.1750, Stop: 1.1885
Position : - Short at 1.1850
Target : - 1.1750
Stop : - 1.1885
The single currency retreated after intra-day rise to 1.1869, suggesting minor top is possibly formed and consolidation below this level is seen with mild downside bias for test of 11.0785 support, however, break there is needed to add credence to this view, bring retracement of recent upmove to 1.1750-60 but reckon downside would be limited to previous support at 1.1723 and bring rebound later.
In view of this, we are holding on to our short position entered at 1.1850. A break of said resistance at 1.1869 would signal recent upmove has resumed and extend gain towards 1.1900-05 (61.8% projection of 1.1370-1.1777 measuring from 1.1650) before correction takes place.
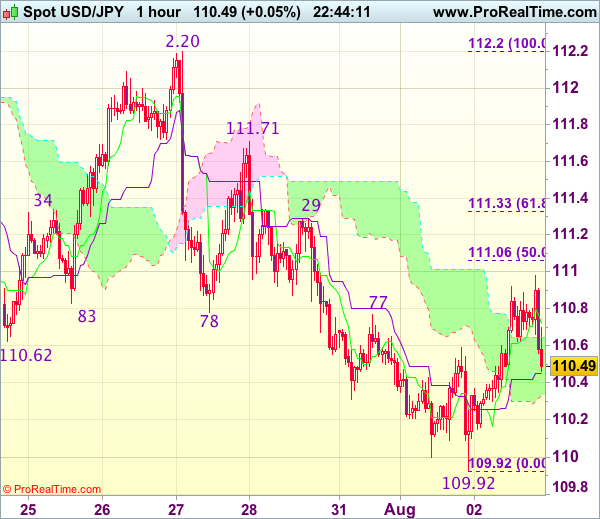
Trade Idea Wrap-up: USD/JPY – Hold short entered at 110.90
USD/JPY - 110.47
Most recent candlesticks pattern : N/A
Trend : Near term down
Tenkan-Sen level : 110.71
Kijun-Sen level : 110.45
Ichimoku cloud top : 110.65
Ichimoku cloud bottom : 110.33
Original strategy :
Sold at 110.90, Target: 109.90, Stop: 111.10
Position : - Short at 110.90
Target : - 109.90
Stop : - 111.25
New strategy :
Hold short entered at 110.90, Target: 109.90, Stop: 111.00
Position : - Short at 110.90
Target : - 109.90
Stop : - 111.00
As the greenback has retreated after faltering below 111.00, retaining our bearishness for recent decline to resume after consolidation, below 110.15-20 would signal the rebound from 109.92 has ended, bring retest of this level, break there would confirm recent selloff from 114.50 top has resumed and extend weakness to 109.70–75 but loss of downward momentum should limit downside to 109.50.
In view of this, we are holding on to our short position entered at 110.90. Above 111.05-10 (50% Fibonacci retracement of 112.20-109.92) would defer and risk test of 111.29 resistance but only break there would signal a temporary low has been formed instead, bring rebound to 111.50-55 first.
Hong Kong 50 Index Very Bullish at 2-Year High But Looking Overbought
The Hong Kong 50 index reached a 14-month high of 27731 earlier today, though it's now struggling to hold on to those gains. The index has been on an uptrend since late December, trading within an upward linear regression channel.
The near-term bias remains strongly bullish according to the MACD, which continues to rise and remains above the red signal line. However, the RSI suggests the current rally is overstretched. The RSI is currently well above the 70 overbought level and is approaching 80. A correction in the short term is therefore a strong possibility.
Further gains should see the index meeting resistance at the upper band of the regression channel at 27775. This level also acted as a resistance area in the past. Above that, the psychological 28000 handle is the next resistance level to watch, followed by the previous congestion area around 28300. A successful break above these levels would open the way towards the April 2015 high of 28616, which was a 7-year peak.
Alternatively, a downside correction would see the index finding support at the tenkan-sen line just below the 27200 level, while further declines would bring into scope the middle of the regression channel at 26800. A drop into the lower channel would weaken the bullish bias, with support coming from the kijun-sen line at 26450 and the 50-day moving average at 26000. A breach of these levels would leave the index exposed to the lower channel band, which if broken, would shift the bias to negative.
In the medium-term, the outlook is also bullish, with price action firmly above the upward sloping moving averages and the Ichimoku cloud.
Yen Ticks Higher as Japanese Consumer Confidence Beats Estimate
USD/JPY continues to have an uneventful week. In North American trade, the pair is trading at 110.50, up 0.14% on the day. In Japan, Consumer Confidence improved to 43.8 points, beating the estimate of 43.5 points. In the US, ADP Nonfarm Employment Change rebounded with a reading of 178 thousand, but this was short of the forecast of 187 thousand. On Thursday, the US releases two key events - unemployment claims and ISM Non-Manufacturing PMI.
The Japanese consumer remains pessimistic about economic conditions, although Consumer Confidence did move higher in July, with a reading of 43.8 points. This marked a 4-month high. The lack of confidence in the economy has resulted in soft borrowing and spending levels. At the same time, manufacturing and housing indicators looked sharp earlier this week. Preliminary Industrial Production rebounded with a strong gain of 1.6%, after a decline of 3.3% in the May. As well, Housing Starts gained 1.7%, compared to a reading of -0.3% in May. These numbers underscore a stronger Japanese economy, buoyed by stronger demand for Japanese exports. However, weak inflation levels remain a serious concern. The BoJ's ultra-loose monetary policy has failed to coax inflation upward. At its recent policy meeting, the BoJ again extended its time-frame for reaching its inflation target of 2%. The bank is reluctant to scale back its asset-purchase program, which means that it will likely lag behind other central banks, such as the ECB, in reducing its stimulus program.
The US dollar has softened against its rivals, and even a strong gain from US Advance GDP last week failed to stem the greenback's slide. The first GDP report for the second quarter came in at impressive 2.6%, beating the estimate of 2.5%. This strong expansion should put to rest concerns of a second straight quarter of weak growth - Final GDP came in at just 1.4%. Still, EUR/USD soared in July, gaining 3.5%. Investors remain concerned that low inflation in the US could mean that the Fed will balk and not raise interest rates in December, despite all but promising to increase rates three times in 2017. In June, Fed Chair Janet Yellen dismissed low inflation as "transient", but she has since changed her tune, as economists remain at a loss to explain why a red-hot economy has not translated into stronger wage growth, and hence higher inflation. The markets are skeptical about a December hike, with the odds at just 42%, according to the CME Group.