Sample Category Title
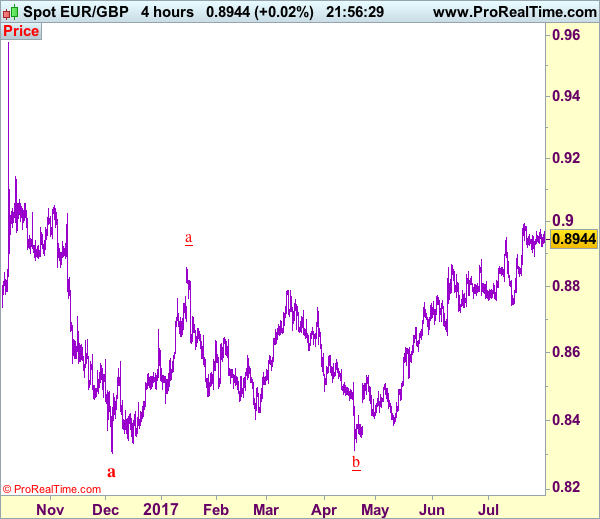
Trade Idea: EUR/GBP – Hold long entered at 0.8925
EUR/GBP - 0.8957
Recent wave: Major double three (A)-(B)-(C)-(X)-(A)-(B)-(C) is unfolding and 2nd (A) has possibly ended at 0.6936.
Trend: Near term up
Original strategy :
Bought at 0.8925, Target: 0.9025, Stop: 0.8885
Position : - Long at 0.8925
Target : - 0.9025
Stop : - 0.8885
New strategy :
Hold long entered at 0.8925, Target: 0.9025, Stop: 0.8885
Position : - Long at 0.8925
Target : - 0.9025
Stop : - 0.8885
As the single currency found support at 0.8922 and has rebounded, retaining our bullishness and test of resistance at 0.8976 is likely, however, break there is needed to signal the pullback from 0.8995 has ended, bring retest of this level but break there is needed to confirm upmove has resumed for test of psychological resistance at 0.9000, then 0.9020 but reckon upside would be limited to 0.9050 due to overbought condition, risk from there has increased for a retreat later.
In view of this, we are holding on to our long position entered at 0.8925. A break of said support at 0.8891 would defer and suggest a temporary top is formed instead, bring correction to 0.8860-65 but only break of support at 0.8829 would provide confirmation, bring correction to 0.8800 first.
Our preferred count is that, after forming a major top at 0.9805 (wave V), (A)-(B)-(C) correction is unfolding with (A) leg ended at 0.8400 (A: 0.8637, B: 0.9491 and 5-waver C ended at 0.8400. Wave (B) has ended at 0.9413 and impulsive wave (C) has either ended at 0.8067 or may extend one more fall to 0.8000 before prospect of another rally. Current breach of indicated resistance at 0.9043 confirms our view that the (C) leg has ended and bring stronger rebound towards 0.9150/54, then towards 0.9240/50.
Spot Gold Dipped to $1262 after Solid US Private Sector Jobs Data
Spot Gold dipped to $1262 on Wednesday, after solid US private sector jobs data but regained traction quickly and retuned close to session high at $1270. Fresh acceleration higher sidelined immediate downside risk, sparked by double-Doji left on Mon/Tue which suggests that recent strong rally might be running out of steam. Gold hit fresh seven-week high on Tuesday at $1274, but was unable to hold gains. Strong rise in US stock markets encourages investors into riskier assets which could further weigh on gold's price, but on the other side, doubts about US interest rate increase this year supports the yellow metal. US non-farm payroll data on Friday will be closely watched for further signals. Daily technicals remain firmly bullish but overbought conditions warn of pullback. Extended consolidation could be expected while the price holds within current $1262/$1274 range, while stronger bearish signal could be expected on break lower. Daily cloud that twists next week may also attract the price lower. Rising 10SMA (currently at $1260) underpins the action and marks significant support. At the upside, sustained break above $1274 (also Fibo 76.4% of $1296/$1204) would open next target at $1280.
Res: 1271; 1274; 1280; 1288
Sup: 1262; 1260; 1257; 1255
Weakening Dollar Helps US Exporters; Lack of Trump Reforms Disappoints Domestic-Orientated Firms
US companies with large revenue exposure to exports could get a significant boost to their top-line amid the weakening dollar. At the same time, investors could start losing interest in companies that have a limited international footprint and are mostly focused on the US market as Trump-promised business reforms and fiscal stimulus get delayed. The percentage of S&P 500 companies' sales from foreign countries was 43% in 2016, with the energy and technology services sectors topping the list.
The US dollar fell following last week's failed attempt to pass the "skinny repeal" of Obamacare in Senate, when all the Democrat and three Republican Senators voted against it. The collapse of the repeal of the Affordable Care Act raises questions about the Trump administration's ability to pass through major legislation and casts doubts whether the promised tax reforms will be realized. In addition, the recent shake-up of key White House staff members along with political controversies and investigations surrounding Trump's family and close aids, adds to the uncertainty over the US political outlook.
The current economic and geopolitical events are a headwind for the greenback, suggesting further depreciation of the US currency is possible. However, even if the dollar stays where it is now, the forex translationtailwind will be stronger in the second half of the year, especially in the fourth quarter, due to the dollar surge last year following the US presidential elections.
Europe accounts for the largest share of revenues that S&P 500 companies generate abroad, standing at 7.8% in 2016. The recent euro/dollar appreciation will be especially beneficial to the companies with large exposure to the eurozone as revenues generated there will be higher when translated to dollars. Apple, Exxon, GE, Walgreens and J&J have the highest exposure to the region, among the S&P 500 companies that disclose revenues from Europe.
Among sectors with the largest foreign footprint, energy at 57.9% and information technology at 57.8% top the list, according to the S&P Dow Jones Indices 2016 report.
Trump's November election victory induced a stock market rally as both investors and chief executives expected promised tax reform to unleash corporate profits. President Trump proposed to reduce the maximum corporate profit tax rate from 35% to 15% as a key element of his reform. However, recent political developments have brought into question the feasibility of this change. Initially, it was thought that the highest tax-payers in the S&P 500 that generate all of their revenues domestically would benefit the most. The share price of companies such as Anthem (up 18%), AutoNation (25%), Humana (up 31%) and Nordstrom (22%) rallied post November 8, 2016, as these companies had one of the highest five-year average tax-rates among S&P 500 members. Current political woes signal that tax reform should not be expected in the near term. In addition, due to little or no foreign exposure these companies will not benefit from the forextranslationeffect.
Furthermore, a delay in passing through promised tax reforms is already hurting the US economy with around 55% of CFOs, surveyed by Taxand, postponing their investment decisions and locking up the capital that could have been circulating and lifting economic activity.
US companies that are heavily domestic dependent and reliant on tourists such as luxury goods and travel service companies, could finally start seeing a lift in their domestic revenues as visitors return to spend in the US. This could cushion some of the translationopportunity these companies will miss due to little or no international footprint. Luxury goods companies such as Coach, Tiffany and Ralph Lauren had their domestic sales hammered during the past year as tourists- especially Chinese- decided to spend elsewhere. With the yuan strengthening against the dollar, these companies could boost revenues if mainland travelers spend in the US.
In case tax reform does go through, the chances of this happening in 2017 are small, considering the complexity of the matter and the time it took to discuss the healthcare bill, which failed to see day-light at the end. At the same time, the dollar is weakening and consequently awarding companies that were considered losers after Trump's win in November.
Trade Idea: USD/CAD – Sell at 1.2690
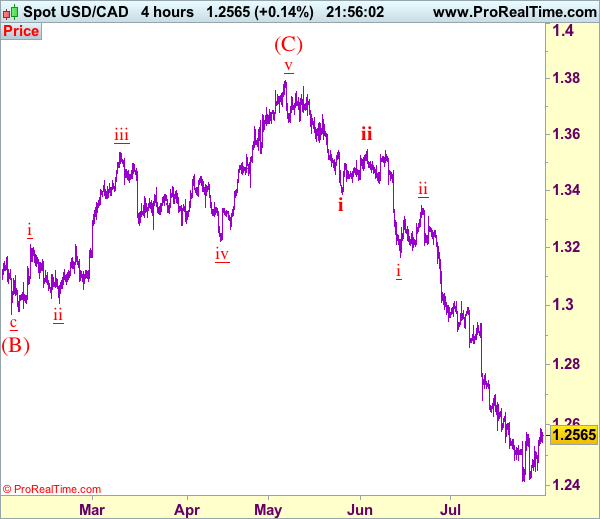
USD/CAD - 1.2565
Recent wave: Only wave v of c has ended at 0.9407 and wave C of major A-B-C correction is underway with wave iii ended at 1.4690, wave v of C may bring one more marginal rise probably in 2018
Trend: Down
Original strategy :
Sell at 1.2690, Target: 1.2490, Stop: 1.2750
Position: -
Target: -
Stop: -
New strategy :
Sell at 1.2690, Target: 1.2400, Stop: 1.2750
Position: -
Target: -
Stop:-
As the greenback has rebounded after holding above last week’s low at 1.2414, retaining our view that further consolidation would take place and another corrective bounce to 1.2605-10 is likely, above there would bring retracement of recent decline to 1.2640-50 but reckon 1.2700-05 would limit upside and bring another decline later, below 1.2500 would bring test of said support at 1.2414 but break there is needed to signal downtrend has resumed and extend weakness to 1.2400, then towards 1.2350-60. We are keeping our count that wave v as well as wave (C) ended at 1.3794 and impulsive wave (i ii, i ii) is now unfolding with minor wave iii still in progress, hence bearishness remains for this fall to extend weakness to aforesaid downside targets.
In view of this, would not chase this fall here and would be prudent to sell the pair again on recovery as 1.2690-95 should limit upside. Above 1.2745-50 would defer and risk a stronger rebound to 1.2800-10 but only break of latter level would signal a temporary low is formed instead, bring retracement of recent decline to 1.2850, then 1.2900, however, price should falter below 1.3000 and the greenback shall head south again from there.
To recap, wave B from 1.3066 is unfolding as an a-b-c and is sub-divided as a: 1.2192, b: 1.2716 and wave c is a 5-waver with i: 1.1983, ii: 1.2506, extended wave iii with minor iii at 1.0206, wave iv ended at 1.0781 and wave v as well as wave iii has ended at 0.9931, hence the subsequent choppy trading is the wave iv which is unfolding as (a)-(b)-(c) with (a) leg of iv ended at 1.0854, followed by (b) leg at 1.0108 and (c) leg as well as the wave iv ended at 1.0674. The wave v is sub-divided by minor wave (i): 0.9980, (ii): 1.0374, (iii): 0.9446, (iv): 0.9913 and (v) as well as v has possibly ended at 0.9407, therefore, consolidation with upside bias is seen for major correction, indicated target at 1.3700 and 1.4000 had been met and further gain to 1.4700 would be seen later.
Trade Idea Update: USD/CHF – Buy at 0.9600
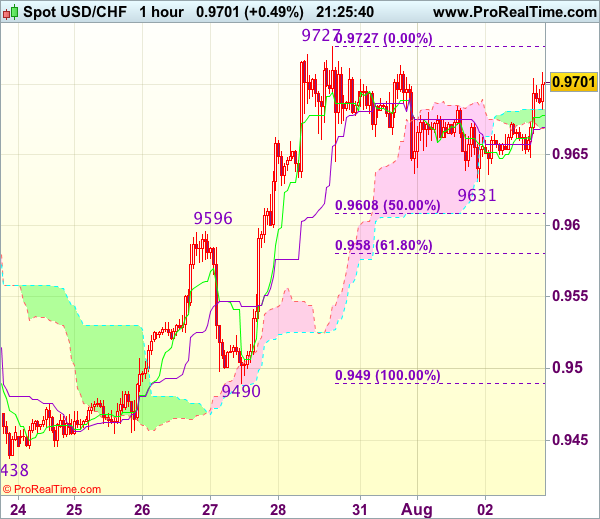
USD/CHF - 0.9693
Original strategy :
Buy at 0.9600, Target: 0.9700, Stop: 0.9565
Position : -
Target : -
Stop : -
New strategy :
Buy at 0.9600, Target: 0.9700, Stop: 0.9565
Position : -
Target : -
Stop : -
Dollar has traded narrowly and near term sideways trading is likely to continue, although initial downside risk of another retreat to 0.9620-25 cannot be ruled out, reckon previous resistance at 0.9596 would turn into support and contain downside, bring another rise later, above resistance at 0.9727 would extend recent rise to 0.9750-60, then 0.9780 but reckon 0.9800 would hold from here.
In view of this, would not chase this rise here and would be prudent to buy dollar on subsequent pullback as previous resistance at 0.9596 should turn into support and contain dollar’s downside. Below 0.9580 (61.8% Fibonacci retracement of 0.9490-0.9727) would defer and suggest a temporary top is formed instead, bring correction to 0.9540-50 but price should stay well above support at 0.9490, bring another rise later.
Trade Idea Update: GBP/USD – Buy at 1.3130
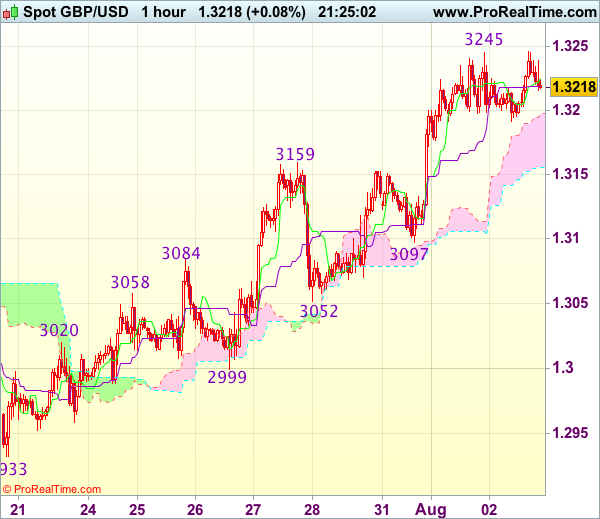
GBP/USD - 1.3226
Original strategy :
Buy at 1.3130, Target: 1.3230, Stop: 1.3095
Position : -
Target : -
Stop : -
New strategy :
Buy at 1.3130, Target: 1.3230, Stop: 1.3095
Position : -
Target : -
Stop : -
Although cable eased after rising to 1.3245 yesterday and minor consolidation below tis level would be seen, reckon downside would be limited to previous resistance at 1.3159 and 1.3125-30 should hold, bring another rise later, above said resistance at 1.3245 would extend gain to 1.3275-80, however, near term overbought condition should prevent sharp move beyond there and reckon 1.3300-10 would hold from here, risk from there has increased for a retreat to take place later.
In view of this, would not chase this rise here and would be prudent to buy cable on pullback as 1.3125-30 should contain downside, bring another upmove later. Only below indicated support at 1.3097 would abort and signal a temporary top is possibly formed, bring further fall towards previous support at 1.3052.
Trade Idea Update: EUR/USD – Sell at 1.1850
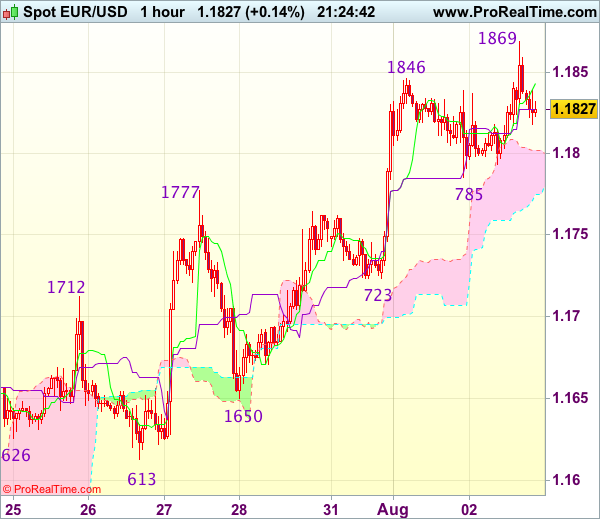
EUR/USD - 1.1826
Original strategy :
Buy at 1.1765, Target: 1.1865, Stop: 1.1730
Position : -
Target : -
Stop : -
New strategy :
Sell at 1.1850, Target: 1.1750, Stop: 1.1885
Position : -
Target : -
Stop : -
As the single currency has retreated after intra-day rise to 1.1869, suggesting minor top is formed and consolidation below this level is seen with mild downside bias for test of 11.0785 support, however, break there is needed to add credence to this view, bring retracement of recent upmove to 1.1750-60 but reckon downside would be limited to previous support at 1.1723 and bring rebound later.
In view of this, we are looking to sell euro on recovery as 1.1850 should limit upside. A break of said resistance at 1.1869 would signal recent upmove has resumed and extend gain towards 1.1900-05 (61.8% projection of 1.1370-1.1777 measuring from 1.1650) before correction takes place.
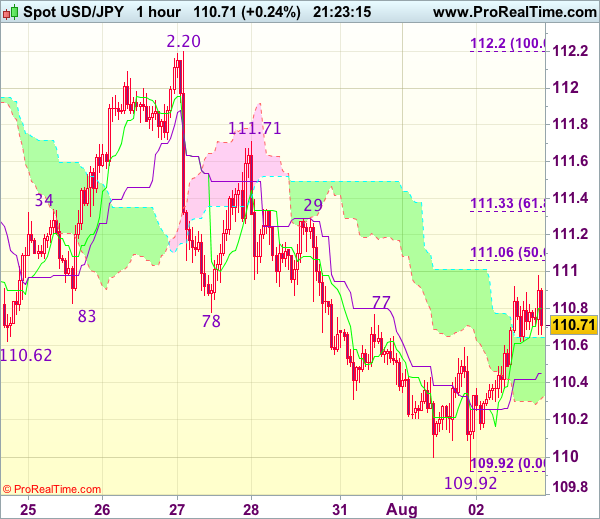
Trade Idea Update: USD/JPY – Hold short entered at 110.90
USD/JPY - 110.72
Original strategy :
Sold at 110.90, Target: 109.90, Stop: 111.25
Position : - Short at 110.90
Target : - 109.90
Stop : - 111.25
New strategy :
Hold short entered at 110.90, Target: 109.90, Stop: 111.10
Position : - Short at 110.90
Target : - 109.90
Stop : - 111.10
Although the greenback has rebounded after marginal fall to 109.92 and consolidation above this level would be seen, reckon upside would be limited to 111.05-10 (50% Fibonacci retracement of 112.20-109.92) and bring retreat, below the lower Kumo (now at 110.32) would signal the rebound from 109.92 has ended, bring retest of this level, break there would confirm recent selloff from 114.50 top has resumed and extend weakness to 109.70–75 but loss of downward momentum should limit downside to 109.50.
In view of this, we are holding on to our short position entered at 110.90. Above 111.05-10 would defer and risk test of 111.29 resistance but only break there would signal a temporary low has been formed instead, bring rebound to 111.50-55 first.
USDCHF: Risk Of Trend Resumption Builds Up
USDCHF: With the pair seeing price follow through on the back of its Tuesday recover, more strength is likely in the days ahead. On the downside, support lies at the 0.9600 level. A turn below here will open the door for more weakness towards the 0.9550 level and then the 0.9500 level. On the upside, resistance resides at the 0.9700 level where a break will clear the way for more strength to occur towards the 0.9750 level. Further out, resistance comes in at the 0.9800 level. Threatening further upside pressure. Its daily RSI is bullish and pointing higher suggesting further upside pressure. All in all, USDCHF faces trend resumption threats.
Elliott Wave Analysis: Aussie Pushing Higher
AUDUSD is unfolding a bigger bullish impulse since May of 2017. We see an overlapping activity within first wave 1), folowed by a minor correction within red wave 2) and now a strong and sharp wave 3), which looks to have found a top near the 0.8100 region. That said current wave 4) may unfold a minor three wave setback as in a A-B-C manner and can search for support near the Fibonacci ratio of 38.2. Once wave 4) fully unfolds, a new push higher into red wave 5) may start to unfold.
AUDUSD, 4H