Sample Category Title
AUD/USD Elliott Wave Analysis
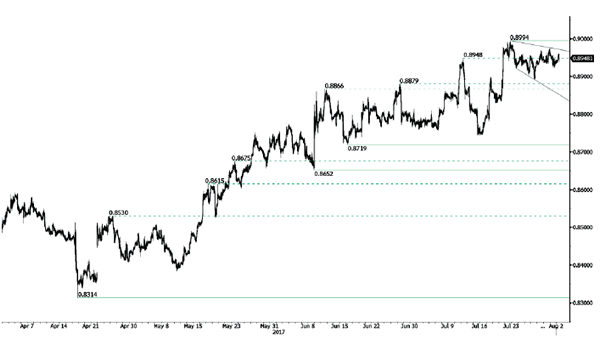
AUD/USD – 0.7957
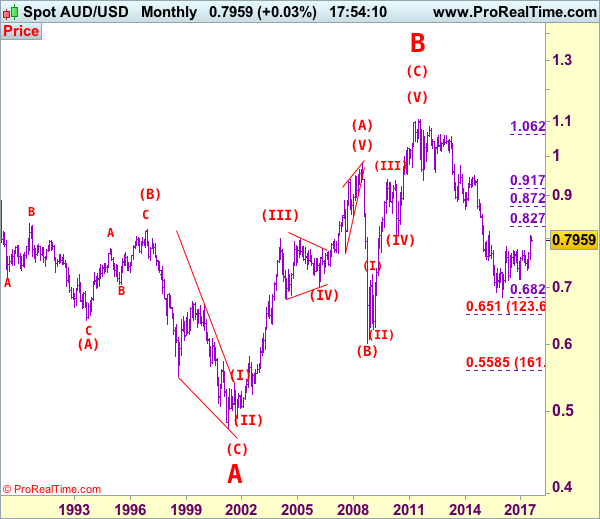
AUD/USD – Wave 5 of C and (B) has possibly ended at 1.1081
Aussie has eased after surging to 0.8066 last week, suggesting minor consolidation would be seen and initial pullback to 0.7875-80 is likely, however, reckon downside would be limited to 0.7800 and bring another rise later, above said resistance at 0.8066 would extend medium term erratic rise from 0.6827 (2016 low) for retracement of early downtrend to 0.8100, then towards previous resistance at 0.8163 which is likely to hold from here due to near term overbought condition.
We are keeping our count that top has been formed at 1.1081 (wave 5 of V) and major correction (A-B-C-X-A-B-C) has commenced, indicated downside targets at 0.7945 (61.8% Fibonacci retracement of entire rise from 0.6007-1.1081) and 0.7750 had been met and downside bias is seen for further weakness to 0.6800, then 0.6700 but reckon 0.6500 would hold from here.
Our preferred count is that the rally from 0.6007 to 0.7270 (7 Jan 2009) is marked as wave A, the retreat to 0.6248 (2 Feb 2009) is wave B and the subsequent upmove is labeled as wave C with wave (iii) and wave (iv) ended at 0.8265 and 0.7700 respectively and wave (v) as well as 3 ended at 0.9407, then wave 4 ended at 0.8066 (instead of 0.8578). The wave 5 has met our indicated projection target of 1.1060 and could ended at 1.1081, this level is now treated as the peak of wave (C) as well as larger degree wave B, hence major fall in wave C has commenced, our initial downside target at psychological support at 0.7000 has just been met and further weakness to 0.6500 would be seen later.
On the downside, whilst initial pullback to 0.7875-80 cannot be ruled out, reckon 0.7800 would limit downside and bring another rise later. Below 0.7760 (61.8% Fibonacci retracement of 0.7571-0.8066) would defer and suggest a temporary top is possibly formed, bring test of previous resistance at 0.7712 but only break there would provide confirmation, bring retracement of recent rise to 0.7650 first.
Recommendation: Buy at 0.7800 for 0.8000 with stop below 0.7700.

Our alternate count on the daily chart treated the top formed in 2008 at 0.9851 could be a larger degree wave I and was followed by a deep and sharp correction in wave II to 0.6007 and wave III is unfolding from there.
The long-term uptrend started from 0.4775 (2 Apr 2001) with an impulsive structure. Wave I is labeled as 0.4775 to 0.9851 (15 Jul 2008), wave II has ended at 0.6007 (Oct 2008) and wave III is still in progress which may extend further gain to 1.1265.
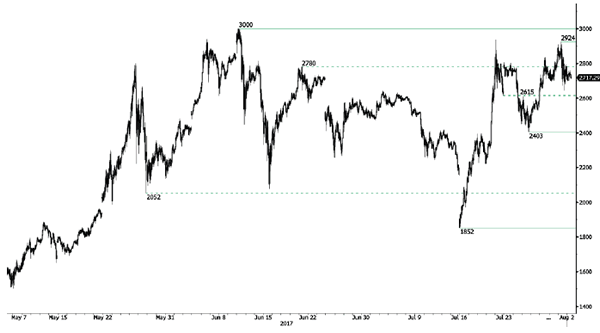
Bitcoin’ Sideways Price Action
Bitcoin's volatility has declined despite the fork. Strong resistance can be found at 3000 (12/06/2017 high) and hourly support lies at 2403 (26/07/2017 low). Further retracement are expected. For the time being, the cryptocurrency keeps on trading between 2700 and 2800
In the long-term, the digital currency has had an exponential growth. There are decent likelihood that the asset will consolidate above $1500. Long-term support is given at $1464 (04/05/2017 low).
Oil Slips on Weaker Data
- Oil slips on weaker data
- Sterling up on manufacturing data
- NZ employment data disappoints
Oil prices fell 2 to 3 percent yesterday after a report showing OPEC output rose last month. That would normally strengthen the US Dollar, but we have not really seen that. A slump in car sales in America, plus flat lining wages statistics caused the USD to pause for thought. Consumer spending did rise in spite of the poor wages data, so that may be a positive, but the Federal Reserve is going to be wary of considering interest rate hikes if people aren't earning more. The Sterling – US Dollar rate is above $1.32 and that's the highest since September 2016. This pair is testing a trend line that goes all the way back to June 2014, so it is a major blockade. Sterling could well top out here, just as it did when it hit this line seven times before.
The other side of that equation is the growth of UK exports as manufacturers gained extra overseas orders and the weakened Pound has to be a factor there. The data was better than forecast and that explains the strength we saw in the Pound yesterday. Tomorrow's Bank of England (BoE) activity will drive the Pound over the coming 30 hours. Whilst the BoE is expected to leave everything on hold, their thought process and expectations could be the catalysts for a change in the Pound's value.
We also had Canadian manufacturing data yesterday and the figures were better than forecast. An index reading above 50 denotes growth in the manufacturing sector and the Canadian Purchasing Managers' Index (PMI) was 55.5 last month; up from 54.7 in June. The Canadian Dollar is looking strong as a result, although the Pound did make some gains yesterday as it recovers from a very low point in the latter part of July.
Overnight The New Zealand Dollar depreciated across the board after a mostly disappointing second quarter jobs report. The unemployment rate did improve marginally to its lowest reading since Q4 2008.
However, annual jobs growth was just 3.1% against predictions of 4.1% growth. That somewhat disappointing NZ employment data has now dampened expectations of any interest rate rise in New Zealand over the next 12 months.
Quote
Worrying is like wearing a ski suit the whole year in London just in case it snows.
Anon
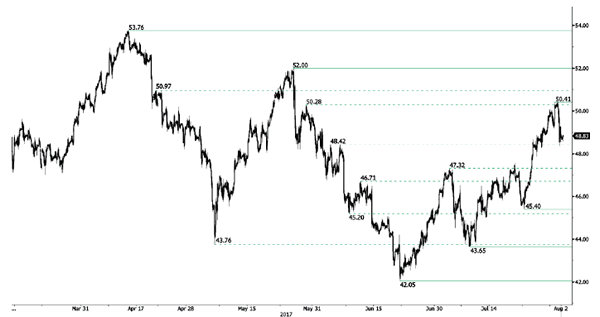
Crude Oil Bouncing Lower
Crude oil is consolidating lower on profit taking. Hourly support is given at 45.40 (24/07/2017 low). Strong resistance can be found at 50.28 (29/05/2017). Expected to show further consolidation before another leg higher.
In the long-term, crude oil has recovered after its sharp decline last year. However, we consider that further weakness are very likely. Strong support lies at 35.24 (05/04/2016) while resistance can now be found at 55.24 (03/01/2017 high).
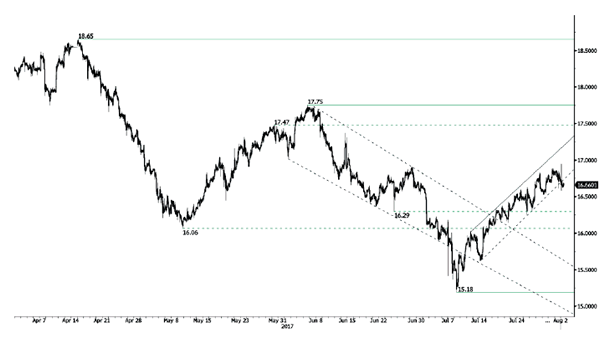
Silver Bullish Pressures Are Fading
Silver's bullish pressures are fading after the bounce from hourly support given at 15.18 (10/07/2017 low). Key resistance is given at a distance at 17.75 (06/06/2017 high). The commodity continues its short-term bullish increase.
In the long-term, the death cross indicates that further downsides are very likely. Resistance is located at 25.11 (28/08/2013 high). Strong support can be found at 11.75 (20/04/2009).
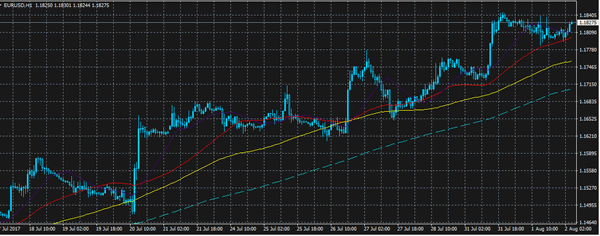
Euro Bulls Holding 1.1800
The euro has rebounded strongly in early Wednesday trading, moving towards the 1.1830 level, after falling to 1.1785 during Tuesday's U.S session, following a strong ISM manufacturing reading and better than expected U.S personal consumption expenditure data.
Later today the EURUSD pair will look to the U.S ADP job report for its next directional move, with analysts expecting that the United States economy created 188,000 jobs during the month of July.
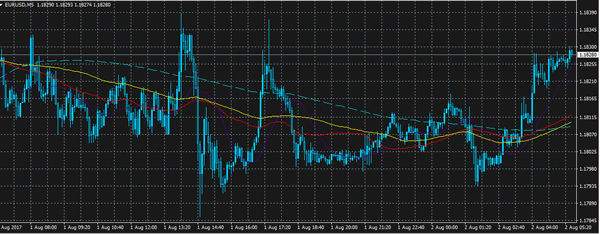
The EURUSD pair remains strongly bullish on all time frames, with short term bullish momentum intact whilst trading above the 1.1800 level.
Key intraday support for the EURUSD is found at the daily pivot point, at 1.1810, then the 200-week moving average offers critical support, at 1.1793.
Below the 1.1793 level, EURUSD support is found at 1.1775 and the 200-hour moving average, at 1.1713.
Looking at the EURUSD upside, intraday resistance is found at the current yearly price high, at 1.1845, whilst the June 2010 monthly swing low offers further resistance, at 1.1875. Above 1.1875, the monthly time frame, 50 period moving average sits at, 1.1933.
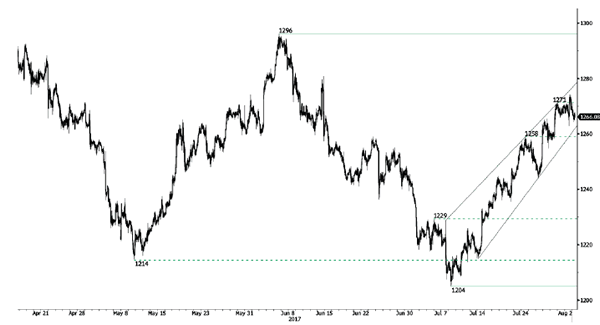
Gold Riding Uptrend Channel
Gold continues to grow. Strong support is given at 1204 10/07/2017 high). Hourly resistance is given at 1271 (31/07/2017 high). Expected to show continued strengthening.
In the long-term, the technical structure suggests that there is a growing upside momentum. A break of 1392 (17/03/2014) is necessary ton confirm it, A major support can be found at 1045 (05/02/2010 low)
USDJPY Testing Critical Resistance
The USDJPY pair is staging a strong recovery, with price moving towards the key 111.00 level, after yesterday's strong ISM manufacturing report and upbeat United States core PCE data, helped lift the trading sentiment surround the U.S dollar index.
At present the USDJPY pair is testing the critical 110.79 resistance level, after printing a fresh weekly trading high of 110.91 during the Asian. USDJPY traders now look to the release of the July ADP jobs report.
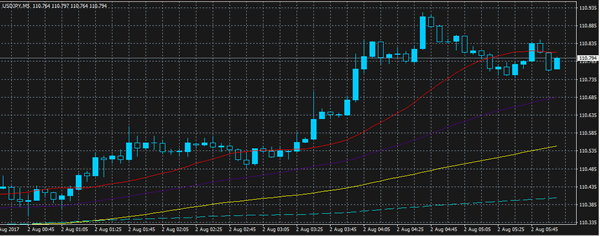
The USDJPY pair remains bearish in the long and medium term, however the pair is currently bullish on a short-term trading basis.
Key technical support is found at the H1 time frame 100 period moving average, at 110.71 and the weekly time frame 50 period moving average, at 100.45. The USDJPY daily pivot point also offers further intraday support, at 110.33.
As the USDJPY moves towards the 111 level, a cluster of critical resistance awaits the pair. The H1 time frame 200 hour moving average is found at 111.05.
Above the 111.05 level, the USDJPY weekly pivot point is found at 111.15, with the 200-week moving average offering further resistance, at 111.32.
EUR/CHF Consolidating Around 1.14
EUR/CHF's buying pressures are very important and is trading below 1.14. Hourly support is located at a distance at 1.0984 (13/07/2017 low). Road is wide-open for further strengthening.
In the longer term, the technical structure is mixed. Resistance can be found at 1.1200 (04/02/2015 high). Yet,the ECB's QE programme is likely to cause persistent selling pressures on the euro, which should weigh on EUR/CHF. Supports can be found at 1.0184 (28/01/2015 low) and 1.0082 (27/01/2015 low).
EUR/GBP Selling Pressures Are Weak
EUR/GBP is trading around its highest levels of the year. The pair is consolidating. Hourly support is given at a distance at 0.8742 (16/06/2017 low). Downside risks are nonetheless important.
In the long-term, the pair has largely recovered from recent lows in 2015. The technical structure suggests a growing upside momentum. The pair is trading above from its 200 DMA. Strong resistance can be found at 0.9500 psychological level.