Sample Category Title
Foreign Exchange Market Commentary: EUR/USD, USD/JPY, GBP/USD, GOLD, WTI CRUDE, DJIA, FTSE100, DAX
EUR/USD
The EUR/USD pair settled lower this Tuesday, but not far below a fresh 2017 high of 1.1845, on a pretty busy macroeconomic day. Data coming from both economies was mixed, with some ups and some downs, nothing however, defining. In the EU, preliminary Q2 GDP came as expected at 06%, up from a previously revised 0.5%, recording the strongest annual growth in six years. The final Markit manufacturing PMI for the region index came in at 56.6 from a flash estimate of 56.8 and June final reading of 57.4, growing at a slower pace, but still indicating expansion in the region.
In the US, personal spending decreased by 0.1% in June, while incomes remained flat when compared to a month earlier, although the PCE index, brought some relief to the greenback posting an annual growth of 1.4%, whilst the core figure resulted at 1.5%, matching previous, but above the expected 1.3%. Given the poor quarterly released attached to GDP last Friday, the inflation component was almost dollar's supportive. More relevant, the ISM manufacturing PMI for July ended at 56.3, down from previous 57.8, a sign of steady growth in the country.
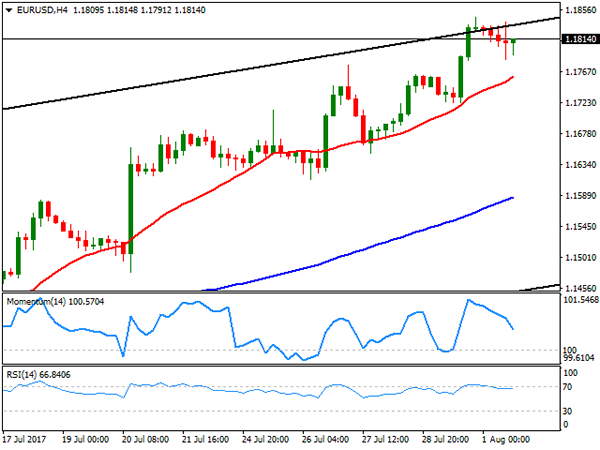
From a technical point of view, the 4 hours chart shows that the pair remained contained below the roof of the ascendant channel, but above bullish moving averages, with the 20 SMA currently around 1.1760. The Momentum indicator pulled sharply lower from overbought territory, while the RSI indicator also heads modestly lower, but holding around 65, yet given the shallow price retracement, chances remain towards the upside, with a bullish breakout of the daily high favoring an extension towards 1.1900 and beyond for this Wednesday.
Support levels: 1.1780 1.1750 1.1715
Resistance levels: 1.1845 1.1870 1.1910
USD/JPY
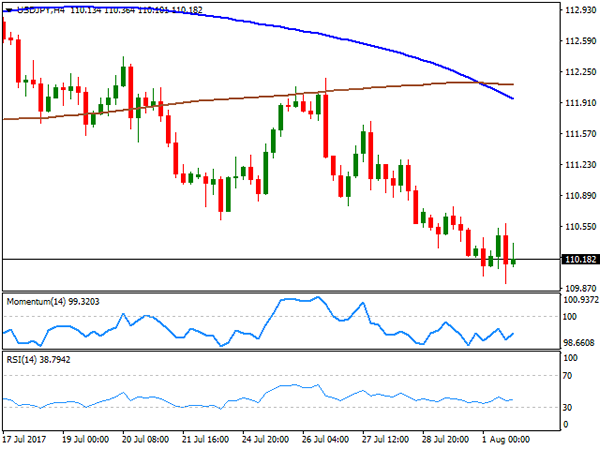
The USD/JPY pair fell for a third consecutive day, reaching a daily low of 109.91 before settling a few pips above the 110.00 threshold, its lowest settlement since mid June. The pair took little cues from US mixed data, lead mostly by a decline in US Treasury yields. After struggling around their Friday's closing levels, yields turned south this Tuesday, with the 10-year note benchmark down to 2.26% from previous 2.29%. Japan will release its July consumer confidence index for July during the upcoming Asian session, expected at 43.6 from previous 43.3. The pair has been posting lower lows and lower highs daily basis since July 26th, which keeps the risk towards the downside. In the shorter term, and according to the 4 hours chart, the risk is also towards the downside, given that the 100 SMA has crossed below the 200 SMA well above the current level, while technical indicators hover directionless within negative territory. June's low of 108.80 is still a possible bearish target, with speculative interest probably taking some profits out of the table once reached.
Support levels: 109.90 109.40 108.80
Resistance levels: 110.35 110.80 111.20
GBP/USD
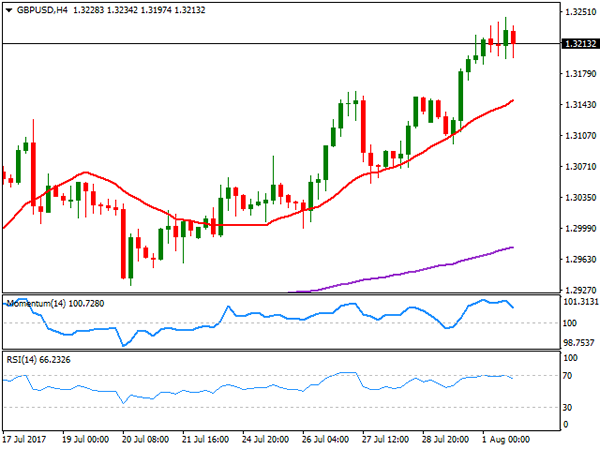
The GBP/USD pair maintained the positive tone, extending its advance up to 1.3243 in a mixture of dollar's weakness and strong local data. The UK manufacturing sector grew at a faster-than-expected pace in July, with the Markit PMI up to 55.1 in the month, beating expectations of 54.3 and above previous 54.2, boosted by stronger inflows of new work, higher levels of production, improved job creation, longer supplier delivery times and a slight increase in inventory holdings, according to the official report. Intraday pullbacks met buying interest at the 1.3190 region, the immediate support, with the downward potential limited to a corrective movement, as in the 4 hours chart, technical indicators are retreating modestly from overbought territory, whilst the price remains firmly above a bullish 20 SMA. Additional gains beyond the mentioned daily high will have an immediate target at 1.3280, where the pair presents multiple daily highs from last August, with a break above it favoring an extension pass 1.3300.
Support levels: 1.3190 1.3150 1.3120
Resistance levels: 1.3245 1.3280 1.3310
GOLD
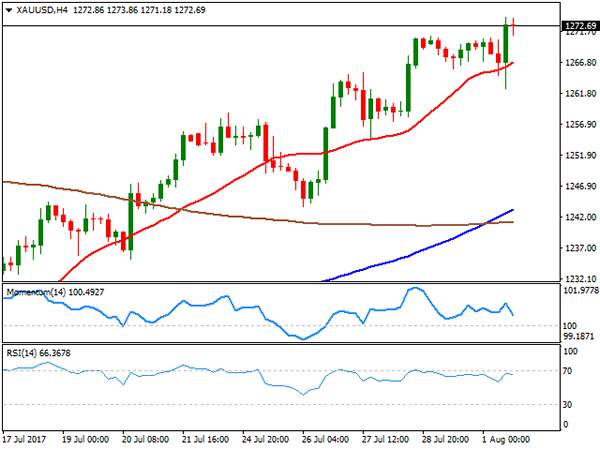
Gold prices extended their advances to near 2-month highs, with spot settling at $1,272.80 a troy ounce, not far from a daily high of 1,274.04. The bright metal gained most ground during the US session, as despite not negative, US data released earlier on the day failed to back the case for another rate hike ahead. Also, backing the advance of the metal were easing equities at the end all of the day, as despite closing in the green, US indexes spent most of the session retreating from their early peaks. Spot's daily chart shows that it's still biased north, extending further its advance above all of its moving average, and with the shortest gaining upward momentum well below the current level, whilst technical indicators present a neutral-to-bullish stance within overbought territory. In the 4 hours chart, the price remains above a bullish 20 SMA, with a short-lived slide below it being quickly reverted, and technical indicators retreating within positive territory, hardly enough to confirm a downward move.
Support levels: 1,266.90 1,257.30 1,246.40
Resistance levels: 1,274.05 1,283.30 1,290.10
WTI CRUDE OIL
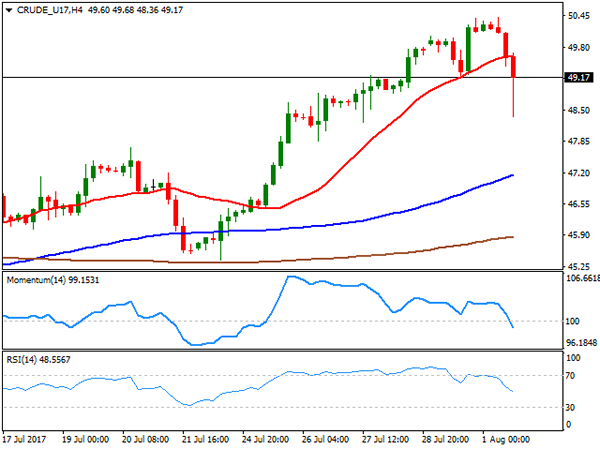
West Texas Intermediate crude oil futures advanced up to $50.41 a barrel at the beginning of the day, but ended the day lower around 49.15, on another report indicating that OPEC's output rose in July, despite the organization output cut deal. After Reuters reported a 90,000 barrels per day increase on Monday, Bloomberg estimated this Thursday that the cartel's output rose by 210,000 barrels a day, while Petro-Logistics said the producer group's output was up by 145,000 barrels a day last month. Ahead of the US stockpiles reports, WTI plunged to 48.36 intraday, retreating from its 200 DMA in the daily chart after flirting with it late Monday, whilst technical indicators in the same chart have turned sharply lower from overbought readings. Still, the price holds above its 20 and 100 SMAs, with the shortest maintaining its bullish slope. In the 4 hours chart, the commodity has turned short-term bearish as technical indicators head south within negative territory, whilst the price broke below a now flat 20 SMA.
Support levels: 48.80 48.30 47.70
Resistance levels: 49.60 50.20 50.85
DJIA
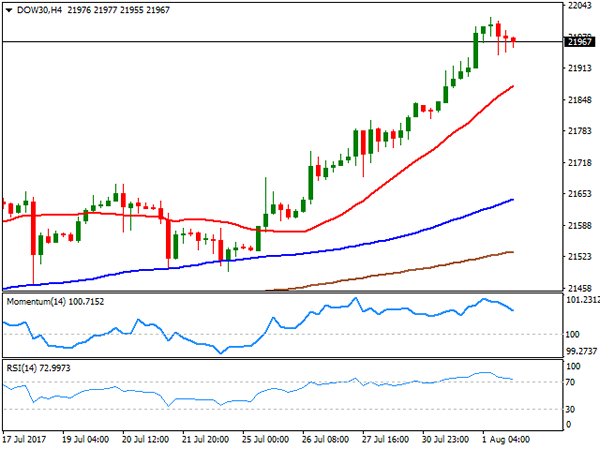
US indexes closed in the green, with the Dow Jones Industrial Average reaching an all-time intraday high of 22,018 early session, and settling at 21,963.92, up 72 points or 0.33%. The Nasdaq Composite added 14 points, to settle at 6,362.94, while the S&P gained points to 2,476.35. Within the Dow, Intel Corp was the best performer up 2.48%, followed by Chevron that added 1.46%. Boeing was the worst performer, down 1.25%, followed by Caterpillar that shed 0.75%. Up for a sixth consecutive session , the daily chart for the Dow shows that the RSI indicator advanced further within overbought territory, currently heading north around 74, whilst the Momentum indicator keeps consolidating well above its mid-line, lacking upward strength. In the same chart, the 20 DMA has accelerated its advance, but stands well below the current level, around 21,660. In the 4 hours chart, technical indicators are easing from extreme oversold readings, but the RSI indicator remains above 70, while the 20 SMA advanced further below the current level, all of which maintains the risk towards the upside for the upcoming sessions.
Support levels: 21,940 21,895 21,841
Resistance levels: 21,977 22,030 22,070
FTSE100
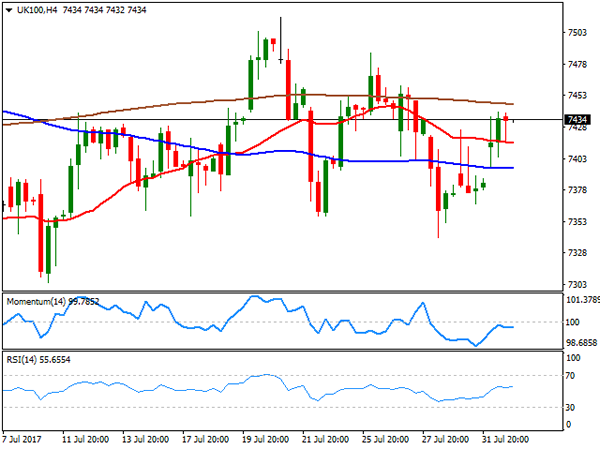
The FTSE 100 closed at 7,423.66, up 52 points this Tuesday, boosted by a positive mood among investors, and strong earnings reports. Rolls Royce was the best performer, up 10.25% after the company reported a 12% raise in revenues to £7.57bn for the first six months of the year, helped by a 27% increase in large engine deliveries. Intertek Group followed, up 9.16% on news that its half-year profits rose more than 20% to £210.3m. Fresnillo was the worst performer, down 2.60%, followed by Mediclinic International that shed 2.03%. The index recovered above its 20 and 100 SMAs in the daily chart, but remains previous highs and with moving averages still lacking directional strength, mostly in a consolidative phase. Technical indicators in the mentioned chart stuck around their mid-lines, also confirm the neutral stance. In the shorter term, and according to the 4 hours chart, the index continues developing between horizontal moving averages, whilst technical indicators continued recovering from near oversold levels before turning flat right below their mid-lines, in line with the longer term perspective.
Support levels: 7,340 7,294 7,257
Resistance levels: 7,440 7,587 7,610
DAX
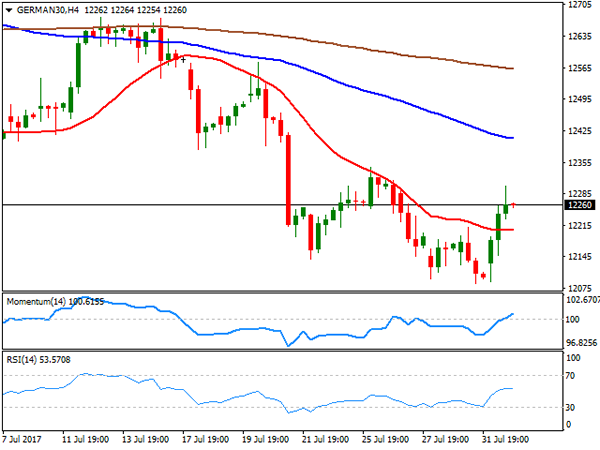
The German DAX added 134 points or 1.10%, to close at 12,251.29, backed by solid local growth reports and the positive momentum among Asian equities. According to Markit, German manufacturing remained in a strong expansionary phase at the start of the second half of 2017, with the PMI printing 58.1 in July, slightly below previous. The best performer was Deutsche Lufthansa, up 3.30%, followed by E.ON that gained 2.79%. Only two members closed lower, Adidas that lost 0.62% and Merck, which closed down 0.61%. In the daily chart, the index remains well below its 20 and 100 DMAs, with the shortest extending below the larger, while technical indicators are barely bouncing from oversold territory, not enough to indicate a steadier recovery ahead. In the 4 hours chart, the upside looks a bit more constructive, as the index settled above its 20 SMA, whilst the Momentum indicator heads north above its 100 level and the RSI consolidates around 53.
Support levels: 12,215 12,161 12,120
Resistance levels: 12,302 12,347 12,383
Technical Outlook: EURUSD Holds Steady Near Fresh Highs Ahead Of US Jobs Data
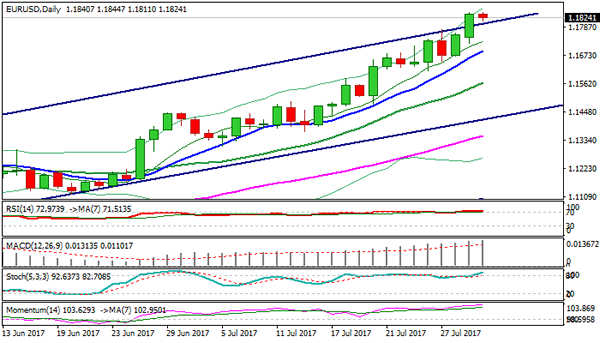
The Euro stays firm on Wednesday and holding just under Mon/Tue fresh highs at 1.1845 and target at 1.1848 (FE 161.8% of the wave C from 1.1312 trough).
Easing after repeated rejection at 1.1845 on Tuesday was short-lived and contained at 1.1785, with fresh acceleration higher on Wednesday, keeping near-term bulls intact.
Lift above 1.1850 zone would trigger stops parked just above and spark fresh upside extension towards 1.1900 zone (FE 176.4%) and key targets at 1.1950 (monthly cloud base) and psychological 1.2000 barrier.
Overbought daily studies warn of pullback but so far without clearer signal.
Tuesday's low at 1.1785 marks initial support, followed by rising 10SMA at 1.1728, which guards 20SMA at 1.1586.
US jobs data (ADP report today and NFP on Friday) are eyed for signals.
Res: 1.1850, 1.1900, 1.1950, 1.1975
Sup: 1.1785, 1.1728, 1.1671, 1.1638
Dollar Punished By Political Drama In Washington
The battered Dollar licked its wounds after reaching a 15-month low against a basket of global currencies during early trading on Wednesday, as investors repositioned ahead of a multitude of key risk events this week. It has certainly been a rough trading year for the Greenback, with sentiment turning increasingly bearish as political drama in Washington clouds the prospect of another US interest rate hike in the coming months. Waning confidence in Washington over Trump’s ability to move forward with tax reforms, and the fiscal stimulithat markets have been heavily betting on have made the Greenback vulnerable to further losses. As August gets underway, the unsavory combination of political risk and concerns over stubbornly low inflation rates in the US are likely to put more pressure the Greenback and -further weaken its position against other major currencies.
As the Dollar sulks near a 15-month low, investors may direct their attention towards the ADP Employment Report for July that is being released later today and which should offer further insight into the health of the US economy. A figure below the market consensus of 185k is likely to entice bears to attack the vulnerable Dollar further. From a technical standpoint, the Dollar Index is heavily bearish on the Daily charts. Repeated weakness below 93.00 should encourage a further deprecation towards the 92.00 support level.
Sterling marches to 11-month high
Sterling ventured to its highest level in 11 months against the Dollar on Tuesday, after the UK Manufacturing Purchasing Manager’s Index rose to 55.1 in July. With UK manufacturing growth rebounding from a seven-month low in July, some fears have receded over a deceleration in economic momentum and this was reflected in Sterling’s appreciation. Although Sterling has started the trading week on a firm footing, with Tuesday’s positive economic data keeping the currency buoyed, the key driver behind the GBPUSD’s resurgence remains Dollar weakness.
This is a big week for the British Pound, with volatility expected as investors brace for Thursday’s UK Services PMI report, as well as the BoE’s policy decision and the release of its latest quarterly inflation report. A vulnerable Dollar has elevated the GBPUSD to above 1.3200 and further upside is on the cards if bulls secure another daily close above the 1.3200 level.
Commodity Spotlight – Gold
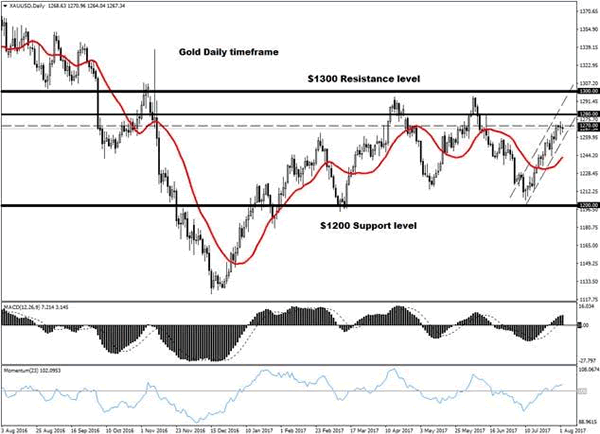
July was a remarkable trading month for Gold, with bulls thrown a lifeline after the Federal Reserve’s cautious outlook on inflation punished the US Dollar and weighed heavily on the prospects for higher US rates. Although the yellow metal edged lower during Wednesday’s trading session as the Dollar attempted to stabilize, buyers still remain in control on the daily charts above $1260. Gold traders will be paying very close attention towards the ADP report later in the day and NFP for Friday which is likely to impact US rate hike expectations consequently affecting Gold’s trajectory. A disappointing ADP Employment Report for July may instill bulls with enough inspiration to attack $1270. From a technical standpoint, the yellow metal remains bullish on the daily charts and a decisive breakout above $1270 should encourage a further appreciation towards $1280.
EURJPY Turns Bullish After Breaking Out Of Recent Range
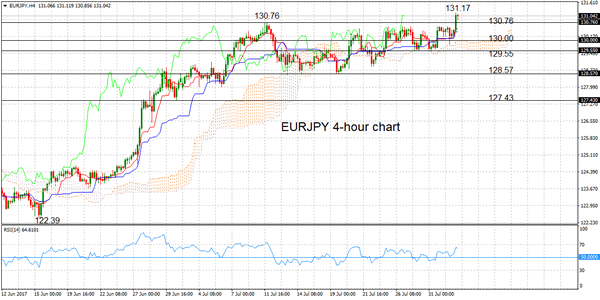
EURJPY turned bullish on the 4-hour chart after breaking out of a recent range and above the July 11 high of 130.76.
Following a consolidation phase that took place around the key psychological level of 130.00 during July 20 until today, prices jumped into the 131.00 handle to hit as high as 131.17 so far.
EURJPY gained upside momentum after RSI started rising yesterday. The short-term outlook is bullish as the uptrend from the June 15 low of 122.39 remains intact and there are no signs of a reversal in the uptrend yet.
A continued move to the upside would target the next major resistance level at 132.00, a level not seen since early 2016. Such a move would strengthen the bullish bias and open the way towards 134.00.
Only a drop back below 130.76 would bring the bias back to neutral. A further decline below the Ichimoku cloud and below recent support at 129.55 would give scope to target support at 128.57 (July 19 low) and 127.43 (June 30 low).
In the short-term, the risk is to the upside based on the bullish market structure. The Tenkan-sen line is above the Kijun-sen line and the market is above the Ichimoku cloud. Meanwhile, RSI remains above 50 in bullish territory.
Asian Currencies Weaken Against Dollar As Euro, Sterling Firm Up, Oil Under Pressure
As traders in Europe were about to start the day, the dollar managed to retrace some of its losses against Asian currencies. However, the dollar index was moderately down at 93.01 as the euro and sterling strengthened.
A weak labor market drove the New Zealand dollar lower during the Asian session, as the figures curbed the possibility of a shift in the central bank’s neutral guidance on monetary policy. Change in employment fell 0.2% in the second quarter, faring worse than the expected 0.7% expansion and well below 1.2% reported in the prior quarter. Quarterly (0.4%) and annual wage inflation (1.6%) mirrored expectations and prior periods. However, at 1.6% expansion in the second quarter, annual wage inflation stands below consumer price inflation at 1.7%. Kiwi/dollar fell half a percent to last trade at 0.7426 ahead of European trading.
The aussie lost ground against its US counterpart during the first session of the day, with the pair last trading at 0.7963.
With the increasing divergence between the European Central Bank and the Bank of Japan on their monetary policy outlook, the euro surged against the yen hitting an intra-day high of 131.17; a level last seen in February 2016. Traders are placing bets that the ECB will announce monetary policy tightening in autumn, while the probability of Japan’s central bank doing the same has lessened.
The euro continued strengthening against the dollar, with the pair last trading at 1.1830 ahead of the European open. Dollar traders are likely starting to position for key events this week, notably Friday’s US employment report. For potential impact on the dollar, the market is also awaiting the US ADP jobs report and comments by San Francisco Fed President John Williams and Cleveland Fed chief Loretta Mester due later in the session. Dollar/yen was last up a third-of-a-percent at 110.70.
In other forex moves, sterling rose against the greenback to last trade at $1.3211 ahead of the key construction PMI data due at 9:30 GMT and tomorrow’s Bank of England meeting.
Looking at commodities, oil was under pressure during the Asian session with WTI falling further below the $50-mark. The American Petroleum Institute’s (API) reported that US crude stocks rose by 1.8 million barrels in the week ending July 28 to 488.8 million. This has pushed back hopes that the recent inventory pullback was a sign of a tightening US market. WTI was last trading at $48.80 a barrel and Brent was at $51.45 a barrel.
As the greenback strengthened against the yen, gold lost ground with the precious metal under slight pressure today. Gold was last trading at $1,267.14 an ounce.
EUR/USD Analysis: Prepares To Start From Weekly R1
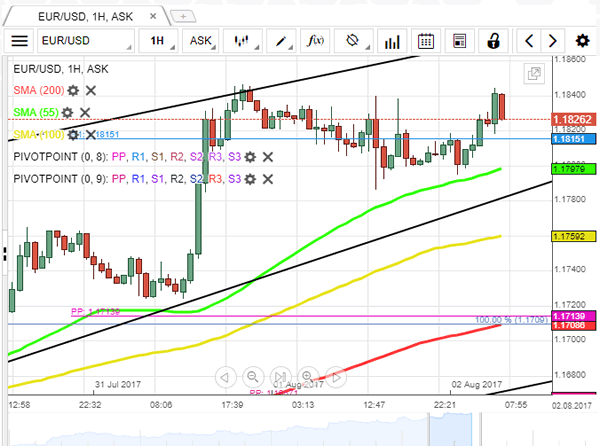
Contrary to expectations, an announcement of the US Manufacturing PMI caused only an eight basis points market reaction. Thus, due to absence of any sizable fundamental events, the currency exchange rate spent previous trading session in a flat and steady movement along the weekly R1 at 1.1815, crossing it multiple times in both directions. Today the pair is expected to use an upside momentum provided by the approaching 55-hour SMA in conjunction with the lower support line of a rising wedge and try to climb to the weekly R1 located at the 1.1878 level. A number of technical indicators support this scenario, sending signals to buy the pair. On the other hand, SWFX traders continue to remain bearish on the pair even though not as strong as yesterday.
GBP/USD Analysis: Finds Support At Weekly R1
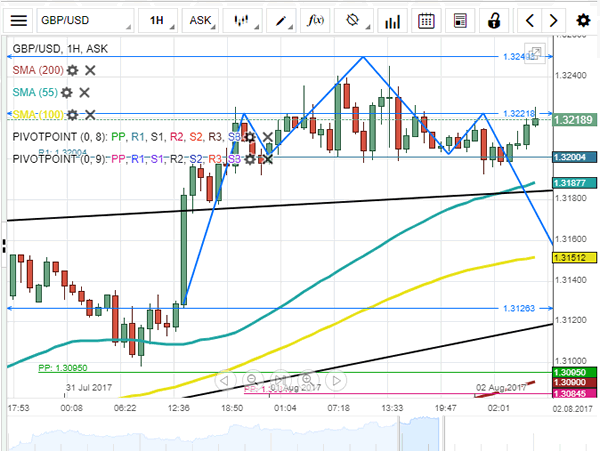
Even though both British and the US Manufacturing PMIs matched with experts' forecasts, the currency exchange rate did not manage to reach the weekly R2 located at the 1.3264 level. On the other hand, a strong support barrier set up by the weekly R1 at 1.3200 also did not let the pair to slip to the bottom. Thus, during the whole previous trading day the currency rate was moving along the above pivot point, basically, forming a head and shoulders pattern. From a technical perspective, the rate should leave the formation downwards and try to target the 1.3128 level. In order to do that, it would have to bypass the rising 55- and 100-hour SMAs. For this reason, the successful slip downstairs is doubtful. Most probably, the pair will continue attempts to climb upstairs.
USD/JPY Analysis: Encounters Strong Support Level
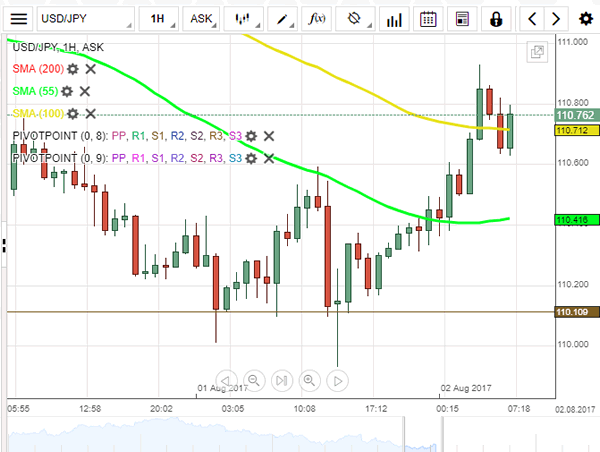
Contrary to expectations, the weekly S1 located at the 110.11 level proved to be a very strong support barrier. Namely, it managed to neutralize multiple attempts of the currency exchange rate to slide downwards, including the 34-pip fall that happened in the middle of the day, under pressure from the 55-hour SMA. As soon as the pair made a fully-fledged rebound, it started to climb upstairs, crossing the above 55- and 100-hour SMAs. Most likely, the surge will be stopped somewhere between the 111.00 – 111.20 levels, as they represent a location of the combined resistance level formed by the 200-hour SMA and the weekly PP. On gradual decay of the upside momentum also point out certain technical indicators, suggesting that strength of the uptrend is coming to an end.
XAU/USD Analysis: Slips To 100-Hour SMA
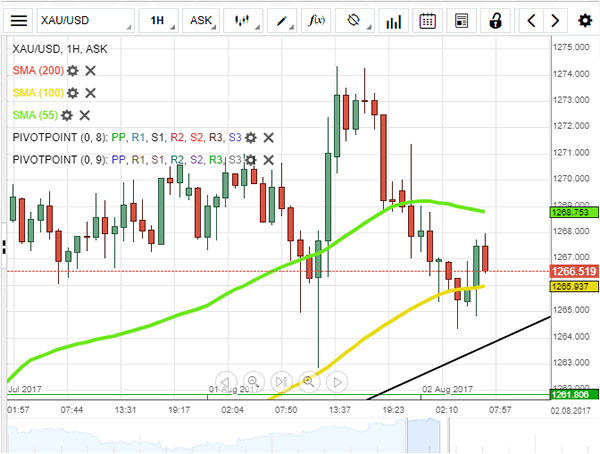
The first half of previous trading day the yellow metal spent in a confident upward movement, supported by the 55-hour SMA near 1,267.26 as well as the release of a number of disappointing US macroeconomic data. Once an upside momentum was over, the buck started to restore lost positions and dragged the rate to the bottom, passing through the 20-, 55- and 100-hour SMAs. Given that SWFX traders remain slightly bearish on the pair, it might slip a little bit further towards the bottom trend-line of an ascending channel that is backed up by the weekly PP at 1,261.80 and the approaching 200-hour SMA. On the other hand, certain technical indicators send a signal that the bullion is already oversold and, thus, might start the surge without reaching the pattern's boundary.
NZD/USD Candlesticks and Ichimoku Analysis
Weekly
• Last Candlesticks pattern: Long white candlestick
• Time of formation: 22 May 2017
• Trend bias: Up
Daily
• Last Candlesticks pattern: Hammer
• Time of formation: 14 Mar 2017
• Trend bias: Up
NZD/USD – 0.74
25
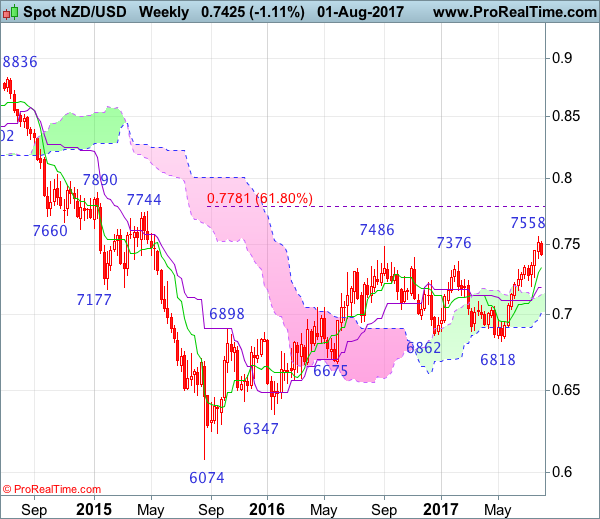
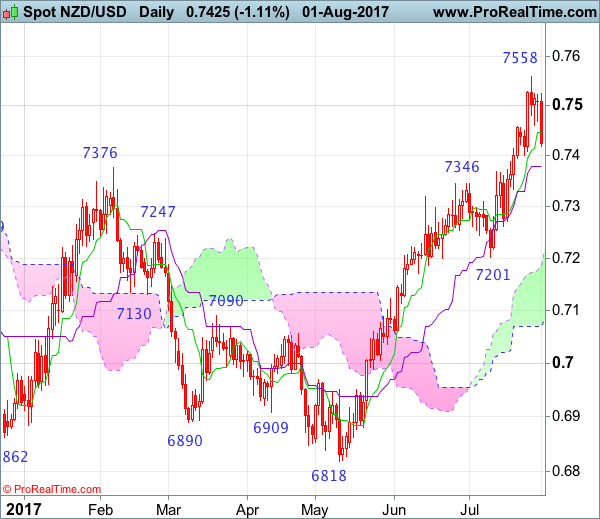
Kiwi has continued heading north in part due to broad-based weakness in the greenback and price just broke above previous resistance at 0.7486 , adding credence to our bullish view medium term erratic upmove from 0.6074 (2015 low) has resumed and upside bias remains for this move to extend gain to 0.7610-20, then towards 0.7690-00 (61.8% projection of 0.6074-0.7486 measuring from 0.6818), however, near term overbought condition should prevent sharp move beyond 0.7750 and reckon 0.7800-10 would hold from here, bring retreat later.
On the downside, whilst initial pullback to the Tenkan-Sen (now at 0.7440) is likely, reckon downside would be limited to 0.7401 support) and the Kijun-Sen (now at 0.7380) would hold, bring another upmove later. A daily close below the Kijun-Sen would defer and suggest a temporary top is possibly formed, bring retracement of recent rise to 0.7330-35, however, still reckon downside would be limited to support at 0.7262 and price should stay well above support at 0.7201, bring another rally.
Recommendation: Buy at 0.7400 for 0.7600 with stop below 0.7300.
On the weekly chart, kiwi extended recent upmove and has finally penetrated indicated previous resistance at 0.7486, adding credence to our bullish view that medium term erratic upmove from 0.6074 (2015 low) has resumed and may extend gain to 0.7690-00 (61.8% projection of 0.6074-0.7485 measuring from 0.6818) and later towards 0.7780-85 (61.8% Fibonacci retracement of 0.8836-0.6074), however, reckon upside would be limited to 0.7890 and price should falter well below resistance at 0.8035.
On the downside, although initial pullback to 0.7400-10 is likely, reckon the Tenkan-Sen (now at 0.7336) would limit downside and bring another rise later. Below support at 0.7201 would defer and suggest top is possibly formed, risk test of the Kijun-Sen (now at 0.7188) first, however, a weekly close below there is needed to add credence to this view, bring correction of recent rise to the upper Kumo (now at 0.7140), then 0.7090-00 but reckon support at 0.7035 would hold from here.