

Sample Category Title
NZD/USD Candlesticks and Ichimoku Analysis
Weekly
• Last Candlesticks pattern: Long white candlestick
• Time of formation: 22 May 2017
• Trend bias: Up
Daily
• Last Candlesticks pattern: Hammer
• Time of formation: 14 Mar 2017
• Trend bias: Up
NZD/USD – 0.74
25
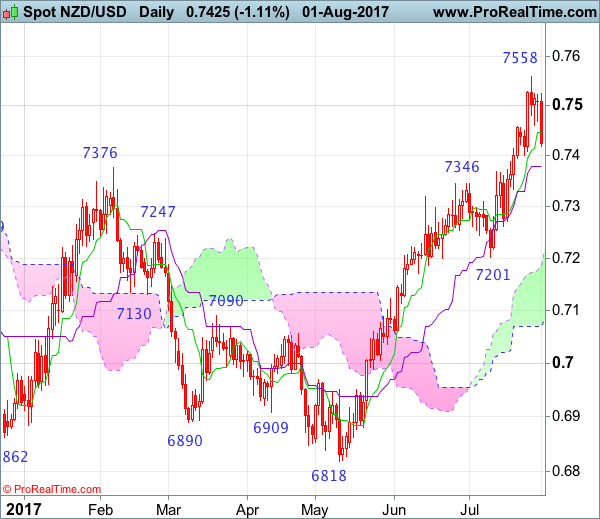
Kiwi has continued heading north in part due to broad-based weakness in the greenback and price just broke above previous resistance at 0.7486 , adding credence to our bullish view medium term erratic upmove from 0.6074 (2015 low) has resumed and upside bias remains for this move to extend gain to 0.7610-20, then towards 0.7690-00 (61.8% projection of 0.6074-0.7486 measuring from 0.6818), however, near term overbought condition should prevent sharp move beyond 0.7750 and reckon 0.7800-10 would hold from here, bring retreat later.
On the downside, whilst initial pullback to the Tenkan-Sen (now at 0.7440) is likely, reckon downside would be limited to 0.7401 support) and the Kijun-Sen (now at 0.7380) would hold, bring another upmove later. A daily close below the Kijun-Sen would defer and suggest a temporary top is possibly formed, bring retracement of recent rise to 0.7330-35, however, still reckon downside would be limited to support at 0.7262 and price should stay well above support at 0.7201, bring another rally.
Recommendation: Buy at 0.7400 for 0.7600 with stop below 0.7300.
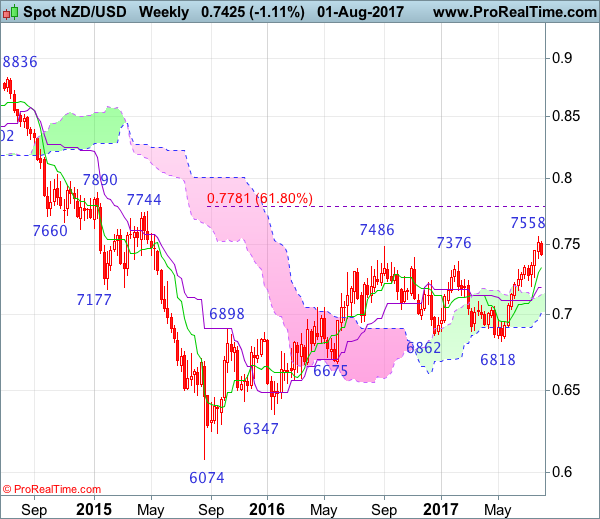
On the weekly chart, kiwi extended recent upmove and has finally penetrated indicated previous resistance at 0.7486, adding credence to our bullish view that medium term erratic upmove from 0.6074 (2015 low) has resumed and may extend gain to 0.7690-00 (61.8% projection of 0.6074-0.7485 measuring from 0.6818) and later towards 0.7780-85 (61.8% Fibonacci retracement of 0.8836-0.6074), however, reckon upside would be limited to 0.7890 and price should falter well below resistance at 0.8035.
On the downside, although initial pullback to 0.7400-10 is likely, reckon the Tenkan-Sen (now at 0.7336) would limit downside and bring another rise later. Below support at 0.7201 would defer and suggest top is possibly formed, risk test of the Kijun-Sen (now at 0.7188) first, however, a weekly close below there is needed to add credence to this view, bring correction of recent rise to the upper Kumo (now at 0.7140), then 0.7090-00 but reckon support at 0.7035 would hold from here.
AUD/USD Candlesticks and Ichimoku Analysis
Weekly
• Last Candlesticks pattern: Long white candlestick
• Time of formation: 10 Jul 2017
• Trend bias: Up
Daily
• Last Candlesticks pattern: Long white candlestick
• Time of formation: 18 Jul 2017
• Trend bias: Up
Although aussie edged higher to 0.8066 late last week, lack of follow through suggests consolidation would be seen and minor consolidation would be seen with initial downside bias and pullback to support at 0.7878 cannot be ruled out, however, reckon the Kijun-Sen (now at 0.7819) would limit downside and bring another rise later. Above said resistance at 0.8066 would signal upmove has once again resumed and extend the medium term erratic rise from 0.6827 to 0.8163 resistance, then 0.8200, however, loss of near term upward momentum should limit upside and reckon another previous resistance at 0.8295 would hold from here.
On the downside, whilst initial pullback to 0.7935-40 and possibly 0.7878 cannot be ruled out, reckon the Kijun-Sen (now at 0.7819) would limit downside and bring another upmove later. A daily close below the Kijun-Sen would dampen this bullish view and suggest a temporary top is possibly formed, risk test of 0.7785-90 but break of previous resistance at 0.7712 is needed to add credence to this view, bring retracement of recent rise to 0.7650-60 first.
Recommendation: Buy at 0.7840 for 0.8040 with stop below 0.7740.

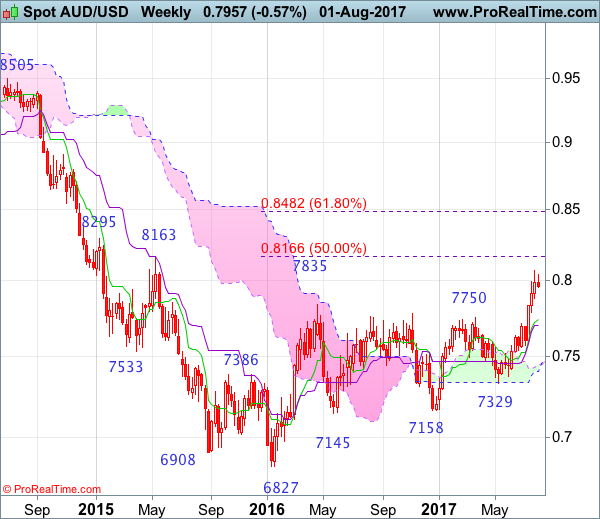
On the weekly chart, aussie’s upmove has gathered momentum after breaking above previous resistance at 0.7835, adding credence to our bullish view that the erratic rise from 0.6827 low is still in progress and upside bias remains for this move to extend headway to previous resistance at 0.8163, then 0.8250, however, near term overbought condition should limit upside to another previous resistance at 0.8295 and price should falter below 0.8390-00, bring retreat later.
On the downside, although pullback to 0.7900 is likely, reckon downside would be limited to previous resistance at 0.7835 (now support) and bring another rise later. Below 0.7785-90 would bring pullback towards previous resistance at 0.7712, break there would suggest top is possibly formed, bring test of the Kijun-Sen (now at 0.7698) but break there is needed to provide confirmation, bring further fall towards said support at 0.7571 which should remain intact.
Trade Idea : USD/CHF – Buy at 0.9600
USD/CHF - 0.9662
Most recent candlesticks pattern : N/A
Trend : Near term up
Tenkan-Sen level : 0.9662
Kijun-Sen level : 0.9658
Ichimoku cloud top : 0.9682
Ichimoku cloud bottom : 0.9672
Original strategy :
Buy at 0.9600, Target: 0.9700, Stop: 0.9565
Position : -
Target : -
Stop : -
New strategy :
Buy at 0.9600, Target: 0.9700, Stop: 0.9565
Position : -
Target : -
Stop : -
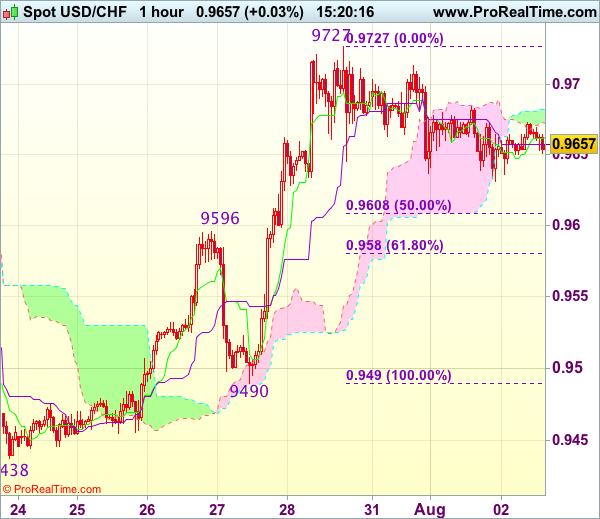
Dollar has traded narrowly and near term sideways trading is likely to continue, although initial downside risk of another retreat to 0.9620-25 cannot be ruled out, reckon previous resistance at 0.9596 would turn into support and contain downside, bring another rise later, above resistance at 0.9727 would extend recent rise to 0.9750-60, then 0.9780 but reckon 0.9800 would hold from here.
In view of this, would not chase this rise here and would be prudent to buy dollar on subsequent pullback as previous resistance at 0.9596 should turn into support and contain dollar’s downside. Below 0.9580 (61.8% Fibonacci retracement of 0.9490-0.9727) would defer and suggest a temporary top is formed instead, bring correction to 0.9540-50 but price should stay well above support at 0.9490, bring another rise later.
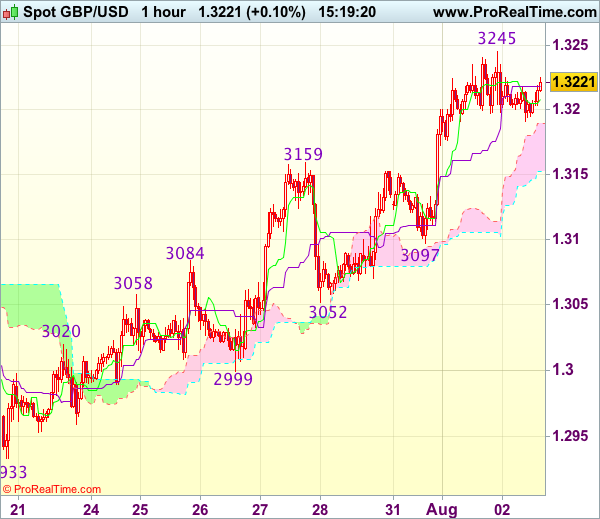
Trade Idea : GBP/USD – Buy at 1.3130
GBP/USD - 1.3218
Most recent candlesticks pattern : N/A
Trend : Near term up
Tenkan-Sen level : 1.3208
Kijun-Sen level : 1.3218
Ichimoku cloud top : 1.3190
Ichimoku cloud bottom : 1.3152
Original strategy :
Buy at 1.3130, Target: 1.3230, Stop: 1.3095
Position : -
Target : -
Stop : -
New strategy :
Buy at 1.3130, Target: 1.3230, Stop: 1.3095
Position : -
Target : -
Stop : -
Although cable eased after rising to 1.3245 yesterday and minor consolidation below this level would be seen, reckon downside would be limited to previous resistance at 1.3159 and 1.3125-30 should hold, bring another rise later, above said resistance at 1.3245 would extend gain to 1.3275-80, however, near term overbought condition should prevent sharp move beyond there and reckon 1.3300-10 would hold from here, risk from there has increased for a retreat to take place later.
In view of this, would not chase this rise here and would be prudent to buy cable on pullback as 1.3125-30 should contain downside, bring another upmove later. Only below indicated support at 1.3097 would abort and signal a temporary top is possibly formed, bring further fall towards previous support at 1.3052.
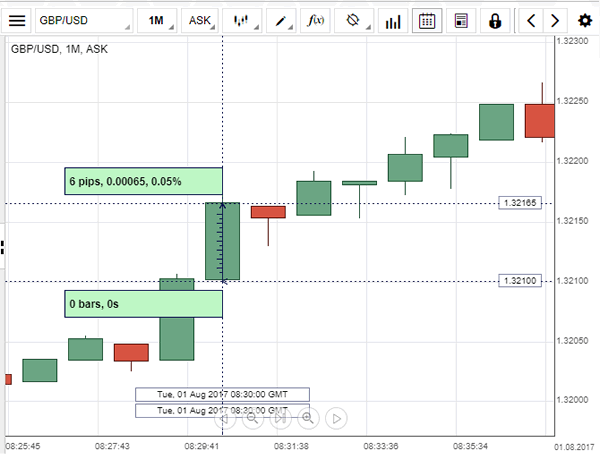
GBP/USD: UK Manufacturing PMI
GBP gained solid ground on the back of reports showing Britain's manufacturing activity expanding more than anticipated in July. After the release, the Pound appreciated against the US Dollar by 0.05% to hit the 1.3215 mark. According to Markit, the UK Manufacturing PMI rose to 55.1 points in the reported month, surpassing expectations for a 54.3 reading. Manufacturing expanded for the first time in three months, being mainly driven by strong gains in new orders that were encouraged by higher exports. Furthermore, the overall expansion in the industry resulted in the strongest increase in job creation within the manufacturing sector in recent years. However, the data is still not likely to have a big impact on the BoE's policy decision due on Thursday.
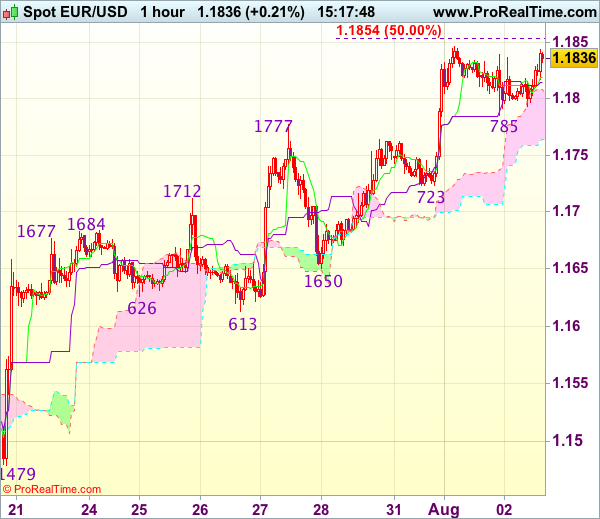
Trade Idea : EUR/USD – Buy at 1.1765
EUR/USD - 1.1832
Most recent candlesticks pattern : N/A
Trend : Near term up
Tenkan-Sen level : 1.1819
Kijun-Sen level : 1.1815
Ichimoku cloud top : 1.1808
Ichimoku cloud bottom : 1.1764
Original strategy :
Buy at 1.1725, Target: 1.1840, Stop: 1.1690
Position : -
Target : -
Stop : -
New strategy :
Buy at 1.1765, Target: 1.1865, Stop: 1.1730
Position : -
Target : -
Stop : -
As the single currency has maintained a firm undertone after recent rally above last week’s high at 1.1777, adding credence to our bullish view that recent upmove from 1.0340 low is still in progress and upside bias remains for further gain to 1.1850-55 (50% projection of 1.1370-1.1777 measuring from 1.1650), then 1.1875-80 but loss of near term upward momentum should prevent sharp move beyond 1.1900-05 (61.8% projection) and price should falter below 1.1940-50, risk from there has increased for a retreat later.
In view of this, would not chase this rise here and would be prudent to buy euro on pullback as 1.1760-65 should limit downside. Only below indicated support at 1.1723 would abort and suggest top is possibly formed, bring retracement of recent rise to 1.1680-85 first.
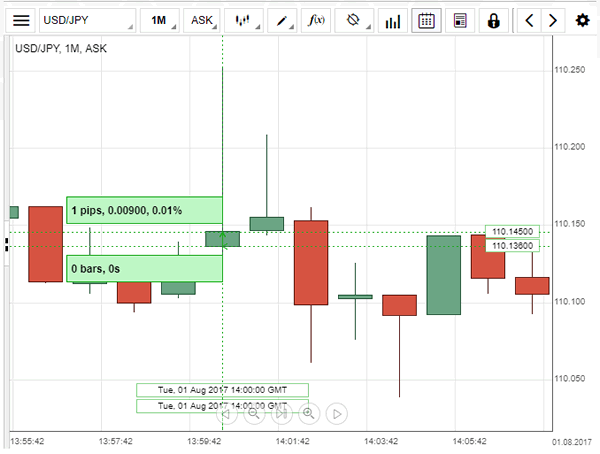
USD/JPY: ISM Manufacturing PMI
Manufacturing growth in the US almost matched growth forecasts, but slightly weaker-than-expected figures failed to support the Greenback significantly. Right after the data were released, the USD/JPY currency pair went to the 110.145 area, or 0.01% higher, but paired gains after that. The Institute for Supply Management stated that its Manufacturing Activity Index came in at 56.3 in July, compared with 57.8 registered in the prior month, though 15 out of 18 industries still indicated expansion. Although production, employment and new orders rose at a slightly weaker pace, they kept pointing to stable economic growth in the US. In addition, experts suggested that some weakness in recent reports is unlikely to affect the normalisation of the Fed's monetary policy.
Trade Idea : USD/JPY – Hold short entered at 110.90
USD/JPY - 110.72
Most recent candlesticks pattern : N/A
Trend : Near term down
Tenkan-Sen level : 110.62
Kijun-Sen level : 110.42
Ichimoku cloud top : 110.65
Ichimoku cloud bottom : 110.30
Original strategy :
Sold at 110.90, Target: 109.90, Stop: 111.25
Position : - Short at 110.90
Target : - 109.90
Stop : - 111.25
New strategy :
Hold short entered at 110.90, Target: 109.90, Stop: 111.25
Position : - Short at 110.90
Target : - 109.90
Stop : - 111.25
Although the greenback has rebounded after marginal fall to 109.92 and consolidation above this level would be seen, reckon upside would be limited to 111.05-10 (50% Fibonacci retracement of 112.20-109.92) and bring retreat, below the lower Kumo (now at 110.30) would signal the rebound from 109.92 has ended, bring retest of tis level, break there would confirm recent selloff from 114.50 top has resumed and extend weakness to 109.70–75 but loss of downward momentum should limit downside to 109.50.
In view of this, we are holding on to our short position entered at 110.90. Above 111.05-10 would defer and risk test of 111.29 resistance but only break there would signal a temporary low has been formed instead, bring rebound to 111.50-55 first.

USDCAD Strongly Bearish At 2-Year Lows
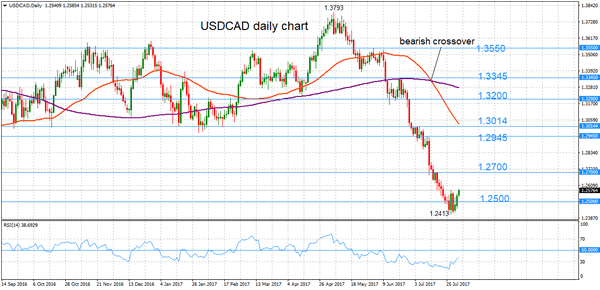
USDCAD is in a clear downtrend on the daily chart, making lower highs and lower lows since falling from the May 5 peak of 1.3793. This marked the highest level since February 2016.
After falling below the 200-day moving average (MA) on June 13, prices accelerated their decline to touch a 2-year low of 1.2413 on July 26. The market made a corrective move and bounced from these lows after becoming overextended, as indicated by RSI falling into oversold territory below 30. A consolidation phase is expected in the near term around the key 1.2500 level. There are no signs of a reversal in the trend yet and the bearish market structure remains intact.
USDCAD is trading below the 200-day MA, which asserts a bearish view. The cross of the 50-day MA below the 200-day MA on July 13 gave a bearish signal. Meanwhile the downward sloping 50-day MA is suggesting there is downside pressure in the market.
A further decline in USDCAD from current levels would target the next major lows at 1.2127 and 1.1919.
If RSI continues to move higher and further away from oversold levels, USDCAD could pick up momentum and rise. But the pair could find immediate resistance at 1.2700, which also acted as a barrier last month. A successful break above this level would bring into view an important zone between 1.2945 and 1.3014 – an area where there was significant congestion and which previously acted as support and resistance. From here, further resistance is located at 1.3200 and 1.3345. A break above 1.3550 would shift the bias to a more bullish one and open the way to retest the May 5 high of 1.3793.
The outlook remains strongly bearish unless USDCAD rises above 1.3000. Above this level the bias would shift to a more neutral one.
Global Manufacturing Grows
Recent data releases have shown that global manufacturing saw an increase in July, further confirming global economic momentum has carried into H2, as many central banks are preparing to start scaling back years of massive stimulus. Eurozone growth remained buoyant, UK manufacturing in July has recovered from a 7-month low and Chinese factory activity grew despite concerns that it would slow down. Even US data is showing that US manufacturing, although tepid, is growing at a modest pace.
However, recent data also showed Americans' spending barely grew in June. The markets are expecting the ECB to scale back its extremely easy policy in the next month or so and China is expected to reach its target of 6.5% growth by year end. These 2 economies are likely to drive global economic growth whilst the US, suffering from political turmoil, insipid wage growth and lacklustre CPI, is likely to cause more concerns for US economic growth as 2017 ends. The recent IMF growth forecast saw both Eurozone & China growth upgraded for the remainder of 2017 and a downgrade in growth for the US.
EURUSD retraced 0.4% from Tuesday's 2-and-a-half-year peak of 1.1844 to currently trade around 1.1825.
USDJPY was little changed on Tuesday but has crept higher overnight to currently trade around 110.85.
GBPUSD, whilst trading in a narrow range on Tuesday, appears to be holding above 1.3200 and is currently trading around 1.3210.
AUDUSD strengthened, following the RBS announcement to keep rates unchanged, to reach 0.80423, before giving back its gains to trade as low as 0.7941 today. Currently, AUDUSD is trading around 0.7960.
Gold has maintained its strength against USD, gaining nearly 0.4% on Tuesday, when it reached a high of $1,273.97. Currently, Gold is trading around $1,266.
WTI quickly retreated from $50pb on Tuesday, as ample global supplies countered strong demand. OPEC output rose in July by 90,000 bpd to a 2017 high, led by Libya, one of the exempt producers, further adding to the fears of oversupply. WTI is currently trading around $48.80pb.
At 08:00 BST the European Central Bank will hold its “6-weekly” Non-monetary policy meeting in Frankfurt.
At 10:00 BST Eurostat releases Eurozone Producer Price Index (YoY) & (MoM) for June. The consensus is calling for a decline to 2.4%, from the previous reading of 3.3% for YoY data. With the ECB making it very clear that its inflation target of 2% needs to be maintained, a poor PPI reading is likely to cause further delays in rate hikes.
At 13:15 BST, Automatic Data Processing Inc. in the US will release ADP Employment Change for July. Market consensus is calling for a rise to 185,000 from the previous 158,000 reading. A stronger number could signal a future rise in consumer spending, which could assist the Fed when it comes to justifying any rate hikes, although the lack of wage growth remains a concern for the US economy.
At 15:30, the EIA will release Crude Oil Stock change for the week ending July 28th. With recent larger than expected drawdowns, the consensus figure of -2.9 Million could be larger than forecast, which would, therefore, result in Oil prices firming. Needless to say, any increase in inventories would see Oil move lower.