Sample Category Title
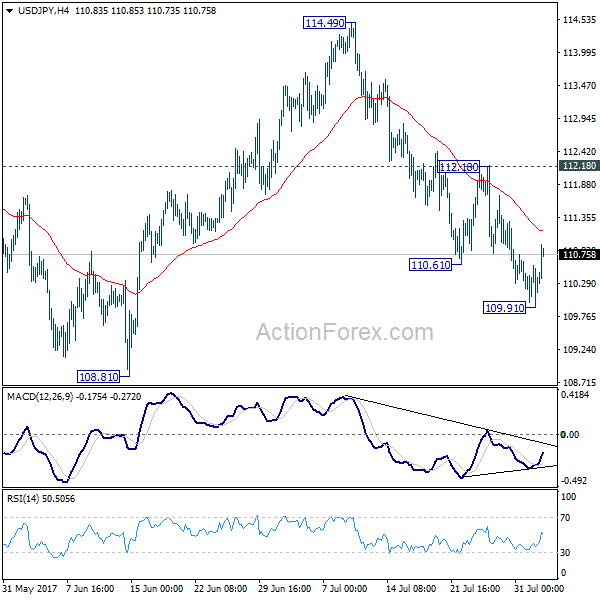
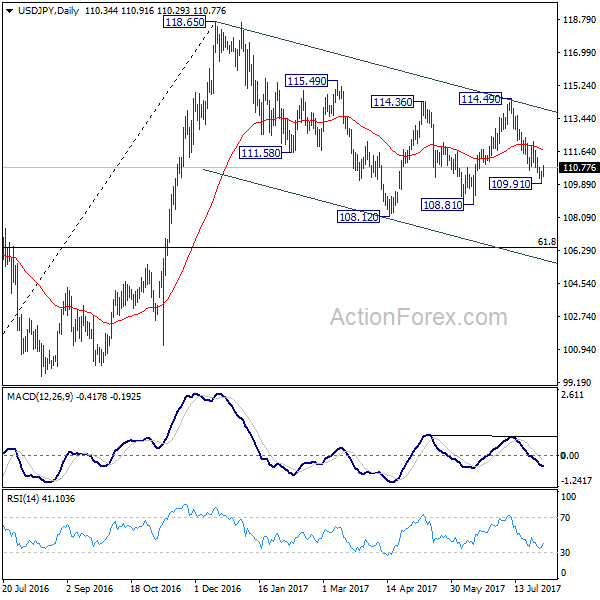
USD/JPY Daily Outlook
Daily Pivots: (S1) 110.00; (P) 110.29; (R1) 110.67; More...
A temporary low is in place at 109.91 in USD/JPY with the current recovery. Intraday bias is turned neutral first. Outlook remains bearish as long as 112.18 resistance holds and another fall is expected. Below 109.91 will target 108.81 support first. Break there will resume whole correction from 118.65 and target 61.8% retracement of 98.97 to 118.65 at 106.48. Nonetheless, break of 112.18 resistance will dampen this bearish view and turn focus back to 114.49 resistance instead.
In the bigger picture, the corrective structure of the fall from 118.65 suggests that rise from 98.97 is not completed yet. Break of 118.65 will target a test on 125.85 high. At this point, it's uncertain whether rise from 98.97 is resuming the long term up trend from 75.56, or it's a leg in the consolidation from 125.85. Hence, we'll be cautious on topping as it approaches 125.85. If fall from 118.65 extends lower, down side should be contained by 61.8% retracement of 98.97 to 118.65 at 106.48 and bring rebound.
Elliott Wave View: USDCAD Wave (4) In Progress
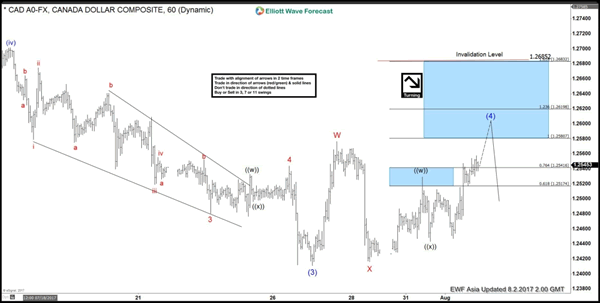
Short term USDCAD Elliott Wave view suggests the decline to 1.2411 ended Intermediate wave (3) of an Elliott Wave impulse structure from 6/2 peak. Intermediate wave (4) bounce is in progress as a double three Elliott wave structure where Minor wave W ended at 1.2576 and Minor wave X ended at 1.2416. Minor wave Y is subdivided also as a double three Elliott Wave structure. Up from 1.2416 low, Minute wave ((w)) ended at 1.253 and Minute wave ((x)) ended at 1.2443. Near term focus is on 1.258 – 1.262 area to complete Intermediate wave (4). Afterwards, pair should either resume to new low or at least pullback in 3 waves. We don't like buying the proposed bounce.
USDCAD 1 Hour Elliott Wave Chart
NZD Wobbles At The Highs | NZDUSD, AUDNZD
Employment data helped to extend losses for the Kiwi from recent highs and we ponder if it, along with other commodity currencies, could be the canary in the coal mine for a rebound in the USD.
Dairy prices contracted by -1.6% overnight, their fastest rate of contraction since March and the first data set over the next 23 hrs which were to weigh on the flying Kiwi. The employment report was received with a glum tone, despite not being that bad overall, although it could also be argued the NZ Dollar was due for a correction of some sort anyway.
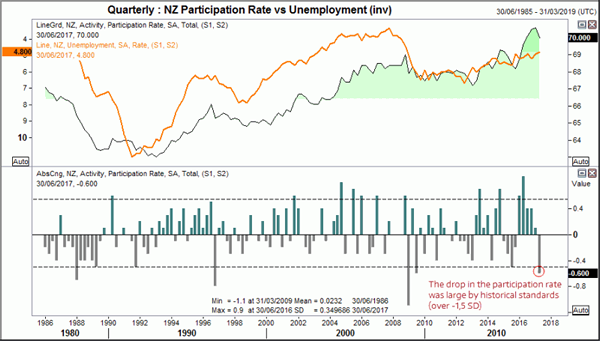
Unemployment softened to 4.8% as forecast, down 1 percentage point from 4.9%. This now takes it to its lowest point since December quarter 2018. The employment change fell below expectations of 0.7% to contract -0.2%, its first negative quarterly print since September 2015. This has now dragged the annual employment increase to 3.1%, its lowest level since March ’16. Yet it was the participation rate which likely caused the biggest stir as it has moved down from a record high of 76 to drop 6 percentage points. By historical standards this is an extreme fall as it has only been matched or beaten three quarters since the data’s inception.
At this stage, the employment reads are of no great concern to RBNZ, as these remains to be low inflation and the high New Zealand Dollar. Whilst there has been a softening of the NZD, it is too early to expect RBNZ to celebrate their trade weighted index remains about 6% higher than they’d like it. Still, it is possible that some NZD crosses are technically overbought, and we see potential for AUDNZD to strengthen over the near-term as price action on is constructively bullish.
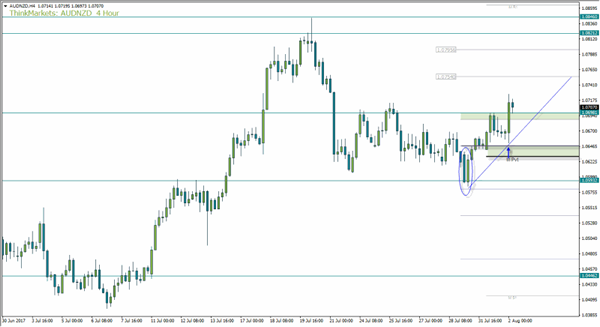
AUDNZD is a currency pair which sometimes requires patience as there can be lots of overlaps between candles. This in turn requires patience not to move the stop too quickly but, when a trend is caught, it can be sudden and fast moving.
The bullish piercing pattern rejected the weekly S1 and has since broken through and respected the weekly pivot as support. The fact we now have price above the weekly and monthly pivot and the zones has since provided a bullish engulfing candle suggests bullish momentum is beginning to build. The weekly R1 and 1.070 high may now provide a zone of support, although we remain bullish if we remain above the blue rising support which allows for a sizable retracement within the prior H4 candle.
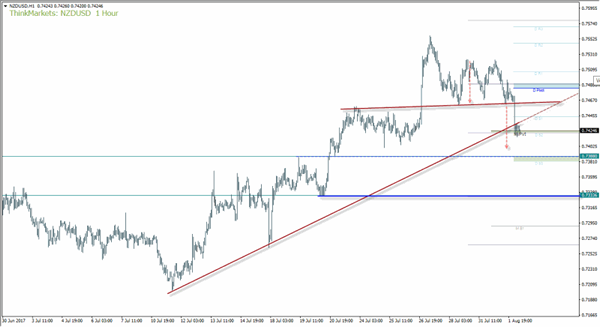
Price action on NZDUSD has also taken a dramatic twist and we wonder if it could be the canary in the coal-mine for a USD rebound from multi-year lows. The drop following today’s employment data confirmed a double top which projects an approximate target just above 0.7388 support. Yet we also broke beneath a rising support line and today’s session has so far remained beneath it. It we are to extend the decline beyond today’s low whilst remaining beneath the rising resistant line then we expect losses to be direct and there is hope for a run towards 0.7333. If we are to rebound from the pivot and respect the broken neckline then we can consider a bearish swing trade and remove the broken trendline from our analysis.
Is The AUDUSD About To Move To The Short Side?
Key Points:
- Price action reaches the upper channel constraint and shows signs of stalling.
- RSI and Stochastic Oscillators showing a move to the downside.
- Watch for a move lower in the coming days.
The Aussie Dollar has been on a bullish rampage of late as the currency pair has been buoyed by a range of technical and fundamental factors. In particular, the recent weakness of the greenback has proven to be a boon for the Aussie Dollar as the pair has moved sharply higher to test the bounds of the 0.8100 handle. However, some interesting technical factors could potentially be about to influence price action's direction. Subsequently, it remains to be seen if the pair will retain its current directional bias.
From a purely technical perspective, the momentum has largely evaporated from the pair's recent rally and failure to break through the 0.8100 handle. Subsequently, price action has started to drift lower over the past few days whilst the RSI Oscillator is in pull-back mode away from over bought territory. Additionally, the Stochastic Oscillator is largely supportive of a potential pullback as is the MACD.
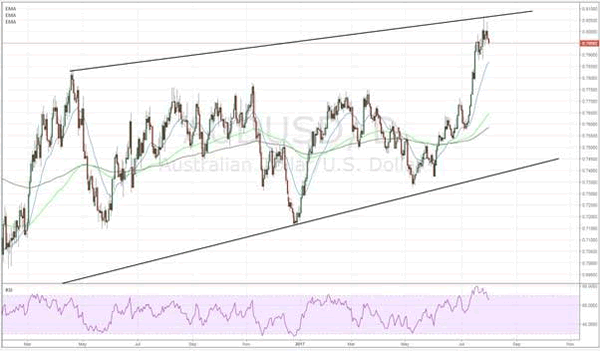
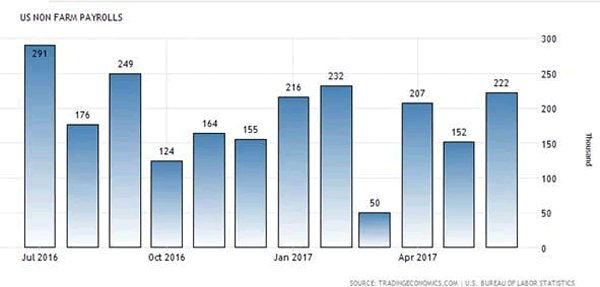
Fundamentally, the RBA's decision to not move rates, whilst also hinting at some of the sectoral problems with the Australian economy, has sought to stall the Aussie Dollar's advance. Additionally, there is little fundamental reason for the pair's current valuation given the huge divergence between the U.S. and Australian economies. Subsequently, as we move towards the Non-Farm Payroll figures, a bounce back in the greenback's sentiment is likely in the coming days.
Ultimately, the most likely scenario for the next few days is a gradual drift lower for the Aussie Dollar until it breaches near term support at 0.7939. At this point, anything could be on the cards for the pair and a sharp downside push back towards the 78 cent handle could be highly likely. However, despite the negative technical factors, the looming NFP event is likely to be the one that sets the near term trend. Subsequently, monitor the event closely as a result above 180k could see the pair rally strongly.
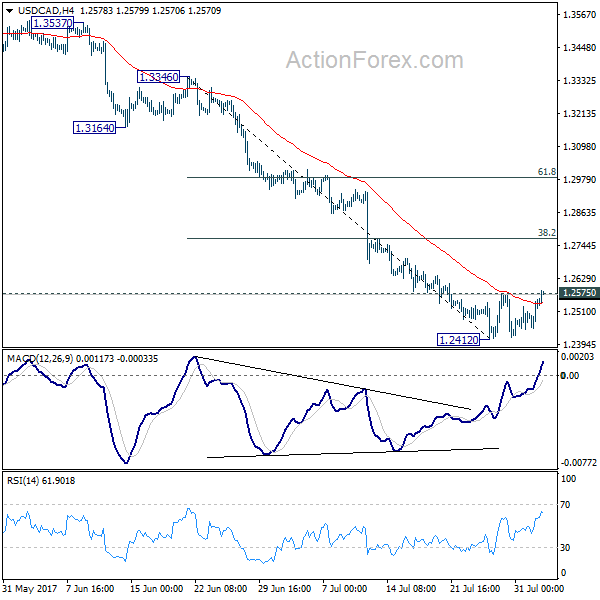
USD/CAD Daily Outlook
Daily Pivots: (S1) 1.2474; (P) 1.2514; (R1) 1.2577; More....
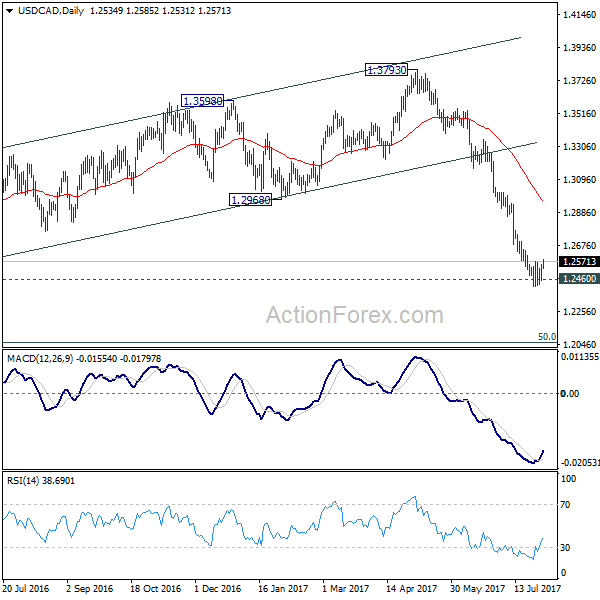
Break of 1.2575 minor resistance suggests that correction from 1.2412 short term bottom is extending higher. Intraday bias is back on the upside for 38.2% retracement of 1.3346 to 1.2412 at 1.2769. At this point, we'd expect upside to be limited there to bring fall resumption. On the downside, break of 1.2412 will extend recent fall from 1.3793 to next key fibonacci level at 1.2048.
In the bigger picture, price actions from 1.4689 medium term top are seen as a correction pattern. Fall from 1.3793 is seen as the third leg and should target 50% retracement of 0.9406 to 1.4869 at 1.2048. At this point, we'd look for strong support from there to contain downside and bring rebound. However, firm break there will target 100% projection of 1.4689 to 1.2460 from 1.3793 at 1.1564.
AUD/USD Daily Outlook
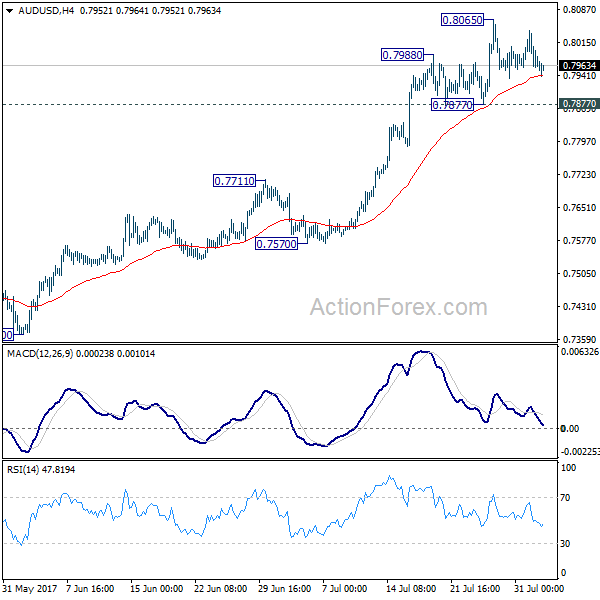
Daily Pivots: (S1) 0.7938; (P) 0.7990; (R1) 0.8020; More...
AUD/USD is staying in consolidation below 0.8065 and intraday bias remains neutral at this point. Another rally is expected as long as 0.7877 support holds. Break of 0.8065 will target 100% projection of 0.6826 to 0.7833 from 0.7328 at 0.8335. Nonetheless, break of 0.7877 will indicate short term topping, possibly with bearish divergence condition in 4 hour MACD. In such case, intraday bias will be turned back to the downside for 0.7711 resistance turned support.
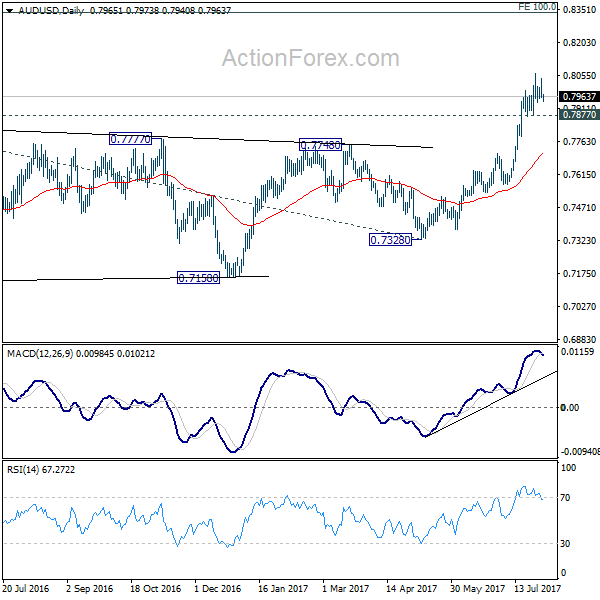
In the bigger picture, current development suggests that rebound from 0.6826 is developing into a medium term rise. There is no confirmation of trend reversal yet and we'll continue to treat such rebound as a corrective pattern. But in any case, further rise is now expected to 55 month EMA (now at 0.8100) or even further to 38.2% retracement of 1.1079 to 0.6826 at 0.8451. Break of 0.7328 support is needed to confirm completion of the rebound. Otherwise, further rise is now expected.
EUR/CHF Daily Outlook
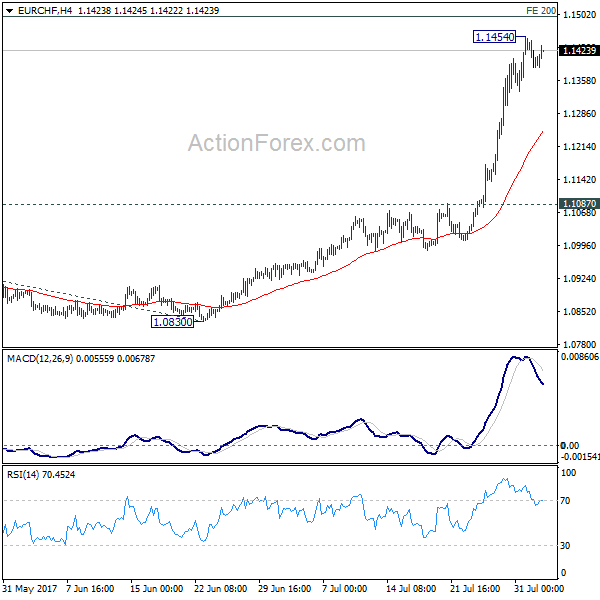
Daily Pivots: (S1) 1.1372; (P) 1.1410; (R1) 1.1435; More...
A temporary top is likely in place at 1.1454 in EUR/CHF with 4 hour MACD staying well below signal line. Intraday bias is turned neutral first and deeper retreat could be seen. But downside should be contained by 4 hour 55 EMA (now at 1.1248) and bring rise resumption. Above 1.1454 will extend recent rise from 1.0629 to 200% projection of 1.0652 to 1.0986 from 1.0830 at 1.1498. Break will target 261.8% projection at 1.1704 next. Nonetheless, sustained break of 1.1248 will indicate short term topping and bring lengthier consolidation first.
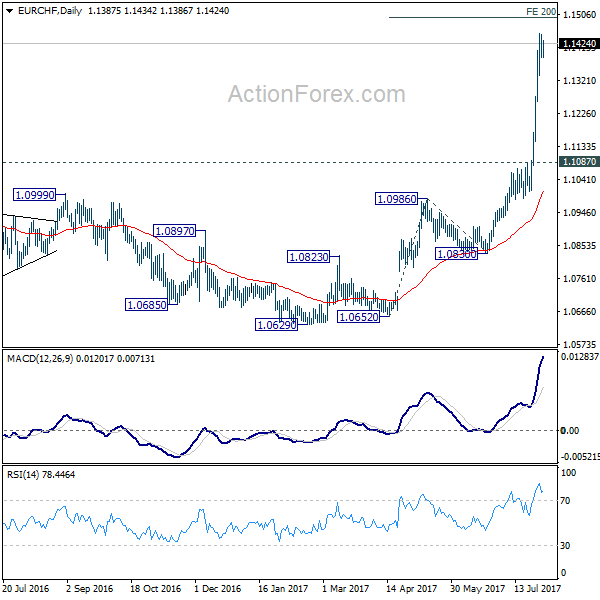
In the bigger picture, sustained break of 1.1198 key resistance confirms resumption of the long term rise from SNB spike low back in 2015. In this case, EUR/CHF would eventually head back to prior SNB imposed floor at 1.2000. For now, this will be the favored case as long as 1.1087 resistance turned support holds.
EUR/GBP Daily Outlook
Daily Pivots: (S1) 0.8918; (P) 0.8940; (R1) 0.8959; More
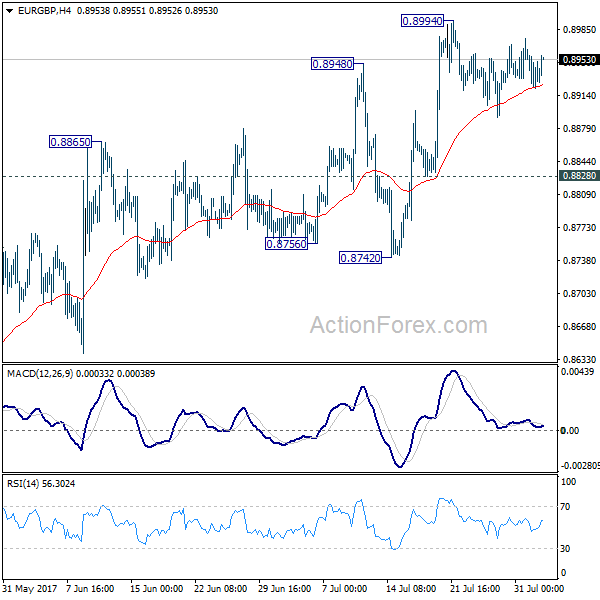
EUR/GBP's consolidation from 0.8994 is still in progress and intraday bias stays neutral for the moment. In case of another retreat, downside should be contained by 0.8828 to bring rise resumption. Whole rally from 0.8312 is still in progress and break of 0.8994 will target 0.9304 key high. There is no clear sign of up trend resumption yet. Hence, we'll be cautious on strong resistance from 0.9304 to limit upside and bring another fall. However, break of 0.8828 will turn focus back to 0.8742 support. Break there will indicate near term reversal.
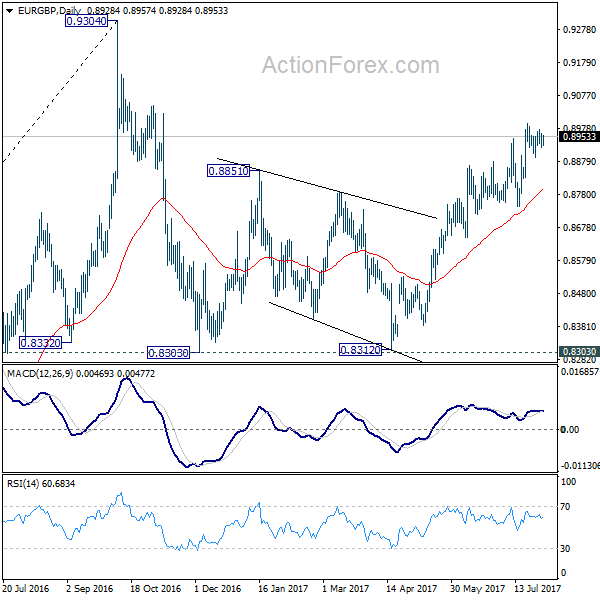
In the bigger picture, price actions from 0.9304 are viewed as a medium term corrective pattern. It's uncertain whether it is finished yet. But in case of another fall, we'd expect strong support from 0.8116 cluster support (50% retracement of 0.6935 to 0.9304 at 0.8120) to contain downside and bring rebound. Whole up trend from 0.6935 is expected to resume after consolidation from 0.9304 completes.
EUR/AUD Daily Outlook
Daily Pivots: (S1) 1.4726; (P) 1.4781; (R1) 1.4863; More...
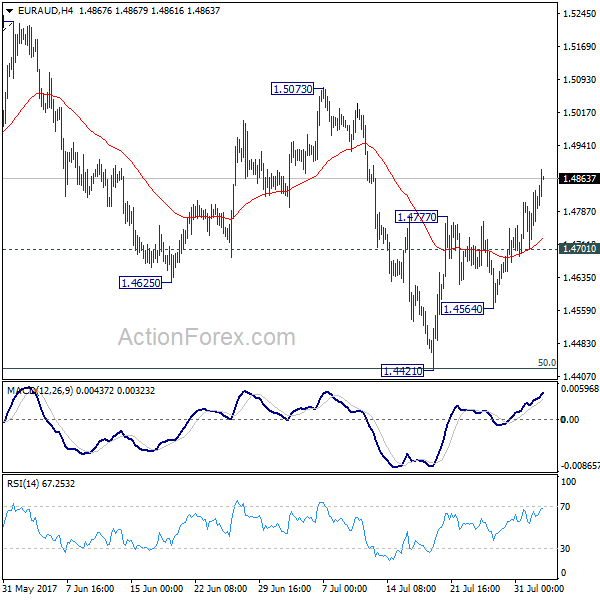
EUR/AUD's rise from 1.4421 continues today and reaches as high as 1.4883 so far. Intraday bias remains on the upside for 1.5073 resistance. As noted before, correction from 1.5226 should have completed with three waves down to 1.4421 already. Break of 1.5037 will resume the rise from 1.3624 and target 61.8% projection of 1.3624 to 1.5226 from 1.4421 at 1.5411 next. On the downside, below 1.4701 minor support will turn intraday bias neutral first. But outlook will stay cautiously bullish as long as 1.4564 support holds.
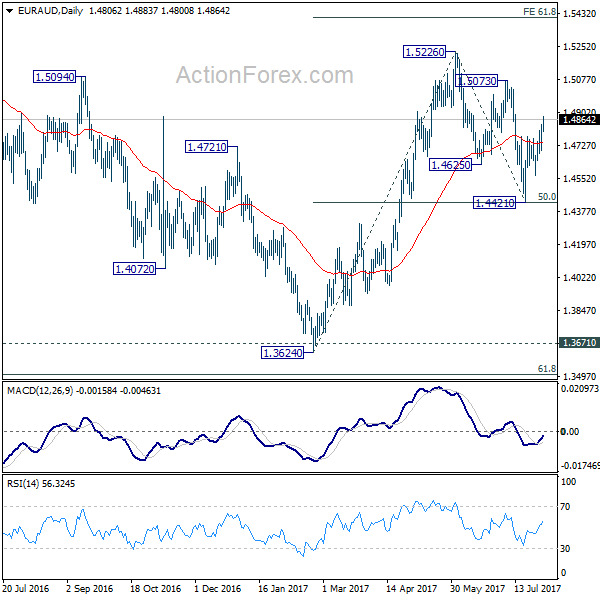
In the bigger picture, we're holding on to the view that corrective decline from 1.6587 medium term has completed at 1.3624. Rise from 1.3624 is expected to resume to retest 1.6587. The corrective structure of the fall from 1.5226 is affirming this view. Above 1.5226 will target a test on 1.6587 key resistance. However, another decline will dampen our view and would drag EUR/AUD lower to retest key support zone around 1.3624.
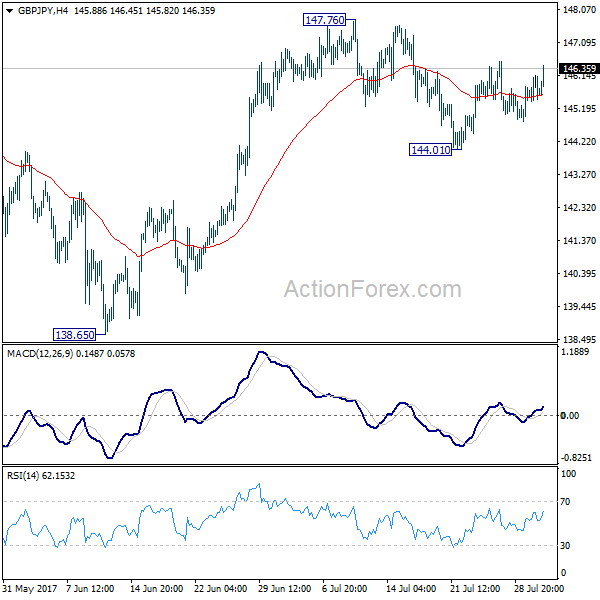
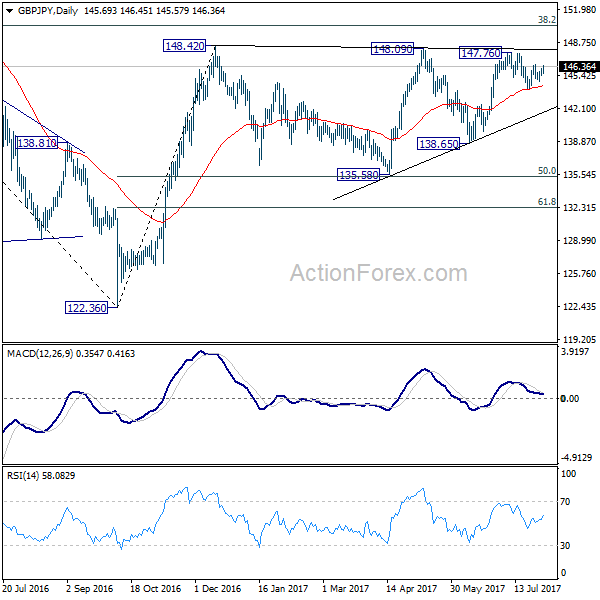
GBP/JPY Daily Outlook
Daily Pivots: (S1) 145.37; (P) 145.76; (R1) 146.13; More
GBP/JPY rebounds today but it's staying in range of 144.01/147.76. Intraday bias remains neutral for the moment. On the upside, break of 147.76/148.42 key resistance zone will resume larger rebound from 122.36. On the downside, break of 144.01 will extend the sideway pattern from 148.20 with another fall back to 135.58/65 support zone.
In the bigger picture, rise from medium term bottom at 122.36 is expected to continue to 38.2% retracement of 196.85 to 122.36 at 150.43. Decisive break there will carry long term bullish implications and pave the way to 61.8% retracement at 167.78. In case the sideway pattern from 148.42 extends, we'd be looking for strong support from 135.58 and 50% retracement of 122.36 to 148.42 at 135.39 to contain downside.