Sample Category Title
Australia’s Building Approvals Surged At The Fastest Pace In 11 Months In June
For the 24 hours to 23:00 GMT, the AUD declined 0.5% against the USD and closed at 0.7962.
LME Copper prices declined 0.7% or $46.5/MT to $6300.5/MT. Aluminium prices declined 0.9% or $17.0/MT to $1887.0/MT.
In the Asian session, at GMT0300, the pair is trading at 0.7947, with the AUD trading 0.19% lower against the USD from yesterday's close.
Earlier in the session, data indicated that Australia's seasonally adjusted building approvals rebounded more-than-expected by 10.9% on a monthly basis in June, rising at the fastest pace since July 2016. Building approvals had registered a revised fall of 5.4% in the prior month, while markets expected for a gain of 1.0%.
The pair is expected to find support at 0.7912, and a fall through could take it to the next support level of 0.7876. The pair is expected to find its first resistance at 0.8013, and a rise through could take it to the next resistance level of 0.8078.
Looking forward, market participants will keep a close watch on Australia's AiG performance of service index for July, due to release overnight, followed by the nation's trade balance for June, slated in the early hours of tomorrow.
The currency pair is trading below its 20 Hr and 50 Hr moving averages.

Euro-Zone’s Economy Expanded 0.6% In The Second Quarter
For the 24 hours to 23:00 GMT, the EUR declined 0.17% against the USD and closed at 1.1808, shrugging off robust GDP report from the Euro-zone.
Data showed that the Euro-zone's seasonally adjusted flash gross domestic product (GDP) advanced 0.6% on a quarterly basis in the second quarter of 2017, meeting market expectations, thus painting a bright picture of the region's economy that could allow the European Central Bank (ECB) to scale back its monetary stimulus programme before the end of the year. In the previous quarter, the region's GDP had registered a revised rise of 0.5%.
On the other hand, the region's final Markit manufacturing PMI was revised lower to a level of 56.6 in July, compared to a preliminary print indicating a fall to a level of 56.8. In the previous month, the PMI had registered a reading of 57.4.
Separately, Germany's manufacturing sector growth slowed more than initially estimated, after the final Markit manufacturing PMI fell to a level of 58.1 in July, compared to a drop to a level of 58.3 recorded in the flash estimate. In the prior month, the PMI had registered a reading of 59.6.
Meanwhile, the nation's seasonally adjusted unemployment rate remained steady at 5.7% in July, meeting market expectations.
Macroeconomic data revealed that the US ISM manufacturing activity index dropped more-than-expected to a level of 56.3 in July, amid a slowdown in new orders. The index had recorded a reading of 57.8 in the prior month, while investors had envisaged for a decline to a level of 56.4. Also, the nation's construction spending unexpectedly eased 1.3% on a monthly basis in June, as spending on government projects plummeted by the most in 15 years. Construction spending had registered a revised advance of 0.3% in the prior month, compared to market consensus for an increase of 0.4%.
On the other hand, the nation's personal spending rose 0.1% in June, at par with market expectations. In the prior month, personal spending had risen by a revised 0.2%. Meanwhile, the nation's personal income surprisingly remained flat in June, compared to market expectations for a gain of 0.4%. In the prior month, personal income had risen by a revised 0.3%. Further, the nation's final Markit manufacturing PMI was revised higher to a level of 53.3 in July, compared to an advance to a level of 53.2 reported in the flash estimate. The PMI had recorded a reading of 52.0 in the prior month.
In the Asian session, at GMT0300, the pair is trading at 1.1805, with the EUR trading marginally lower against the USD from yesterday's close.
The pair is expected to find support at 1.1780, and a fall through could take it to the next support level of 1.1756. The pair is expected to find its first resistance at 1.1834, and a rise through could take it to the next resistance level of 1.1864.
Going ahead, investors will look forward to the Euro-zone's producer price index for June, slated to release in a few hours. Additionally, the US ADP jobs report for July, scheduled to release later in the day, will pique significant amount of investor attention.
The currency pair is trading below its 20 Hr moving average and showing convergence with its 50 Hr moving average.

UK’s Manufacturing Sector Activity Jumped From A 7-Month Low Level In July
For the 24 hours to 23:00 GMT, the GBP rose 0.06% against the USD and closed at 1.3209, after data showed UK's manufacturing sector grew better-than-expected in July.
The Markit manufacturing PMI in the UK expanded more-than-expected to a level of 55.1 in July, as export orders surged to a seven-year high, thus hinting that the nation's manufacturing sector gathered momentum in the third quarter of 2017. The PMI had recorded a revised level of 54.2 in the previous month, while markets were expecting for a rise to a level of 54.5.
Additionally, the nation's seasonally adjusted Nationwide house prices unexpectedly rose 0.3% MoM in July, confounding market expectations for a fall of 0.1%. In the previous month, house prices had risen 1.1%.
In the Asian session, at GMT0300, the pair is trading at 1.3201, with the GBP trading 0.06% lower against the USD from yesterday's close.
The pair is expected to find support at 1.3180, and a fall through could take it to the next support level of 1.3158. The pair is expected to find its first resistance at 1.3234, and a rise through could take it to the next resistance level of 1.3266.
Moving ahead, market participants will focus on Britain's Markit construction PMI for July, slated to release in a few hours.
The currency pair is showing convergence with its 20 Hr moving average and trading above its 50 Hr moving average.

Japanese Yen Trading Lower In The Asian Session
For the 24 hours to 23:00 GMT, the USD marginally rose against the JPY and closed at 110.36.
In the Asian session, at GMT0300, the pair is trading at 110.54, with the USD trading 0.16% higher against the JPY from yesterday’s close.
Overnight data indicated that Japan’s monetary base climbed 15.6% on an annual basis in July. The monetary base had risen 17.0% in the prior month.
The pair is expected to find support at 110.11, and a fall through could take it to the next support level of 109.69. The pair is expected to find its first resistance at 110.78, and a rise through could take it to the next resistance level of 111.03.
Going ahead, Japan’s Nikkei services PMI for July, set to be released overnight, will be on investors’ radar.
The currency pair is trading above its 20 Hr and 50 Hr moving averages.

Swiss Franc Trading On A Weaker Footing, Ahead Of Key Economic Releases In Switzerland
For the 24 hours to 23:00 GMT, the USD declined 0.18% against the CHF and closed at 0.9656.
In the Asian session, at GMT0300, the pair is trading at 0.9668, with the USD trading 0.12% higher against the CHF from yesterday’s close.
The pair is expected to find support at 0.9638, and a fall through could take it to the next support level of 0.9609. The pair is expected to find its first resistance at 0.969, and a rise through could take it to the next resistance level of 0.9713.
Ahead in the day, traders will closely monitor Switzerland’s SECO consumer confidence and SVME–PMI, both for July along with retail sales data for June.
The currency pair is trading above its 20 Hr moving average and showing convergence with its 50 Hr moving average.

Canada’s Manufacturing Sector Activity Rose In July
For the 24 hours to 23:00 GMT, the USD rose 0.42% against the CAD and closed at 1.2549.
On the data front, Canada's Markit manufacturing PMI advanced to a level of 55.5 in July, after recording a level of 54.7 in the preceding month.
In the Asian session, at GMT0300, the pair is trading at 1.2573, with the USD trading 0.19% higher against the CAD from yesterday's close.
The pair is expected to find support at 1.2491, and a fall through could take it to the next support level of 1.2410. The pair is expected to find its first resistance at 1.2614, and a rise through could take it to the next resistance level of 1.2656.
The currency pair is trading above its 20 Hr and 50 Hr moving averages.

EUR/USD Daily Outlook
Daily Pivots: (S1) 1.1775; (P) 1.1810 (R1) 1.1835; More...
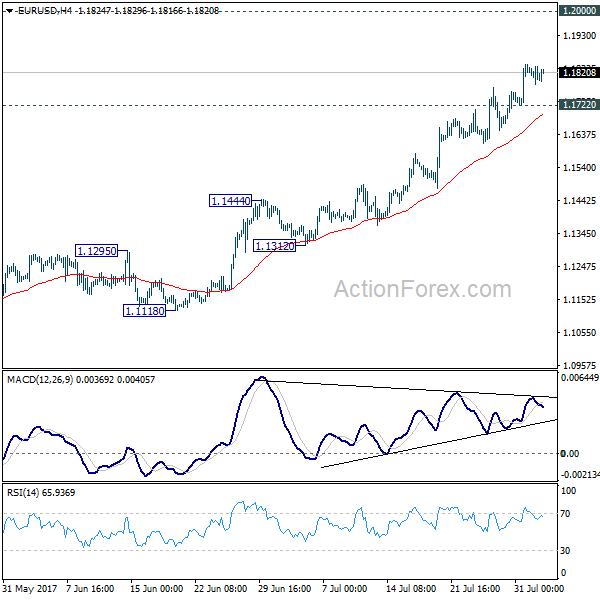
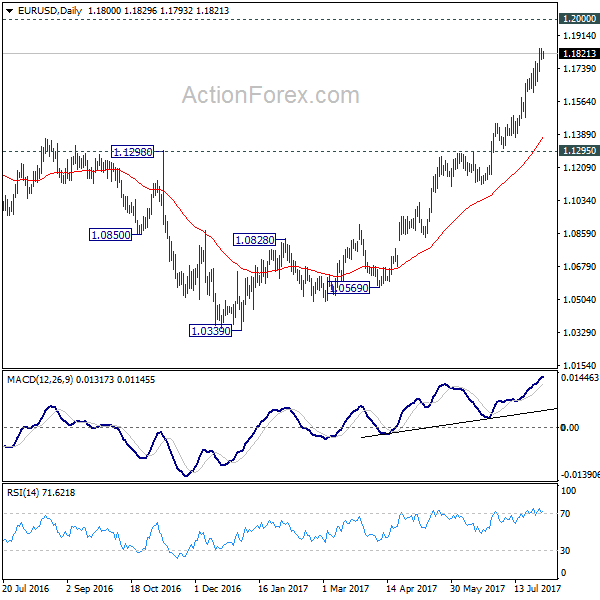
EUR/USD's rally is still in progress and intraday bias stays on the upside. Current rise 1.0339 should target 1.2 handle next. Firm break there will pave the way to next key fibonacci level at 1.2516. On the downside, below 1.1722 minor support will turn intraday bias neutral and bring consolidation before staying another rally.
In the bigger picture, an important bottom was formed at 1.0339 on bullish convergence condition in weekly MACD. Sustained break of 55 month EMA (now at 1.1760) will pave the way to key fibonacci level at 38.2% retracement of 1.6039 (2008 high) to 1.0339 (2017 low) at 1.2516. While rise from 1.0339 is strong, there is no confirmation that it's developing into a long term up trend yet. Hence, we'll be cautious on strong resistance from 1.2516 to limit upside. But for now, medium term outlook will remain bullish as long as 1.1295 support holds, in case of pull back.
GBP/USD Daily Outlook
Daily Pivots: (S1) 1.3181; (P) 1.3213; (R1) 1.3235; More...
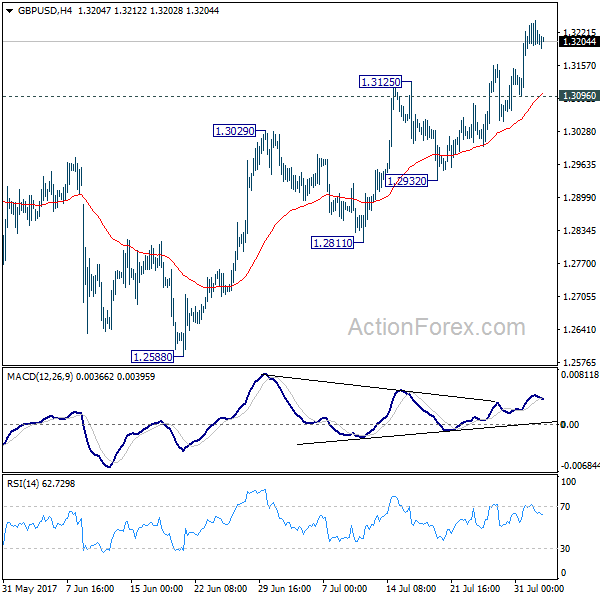
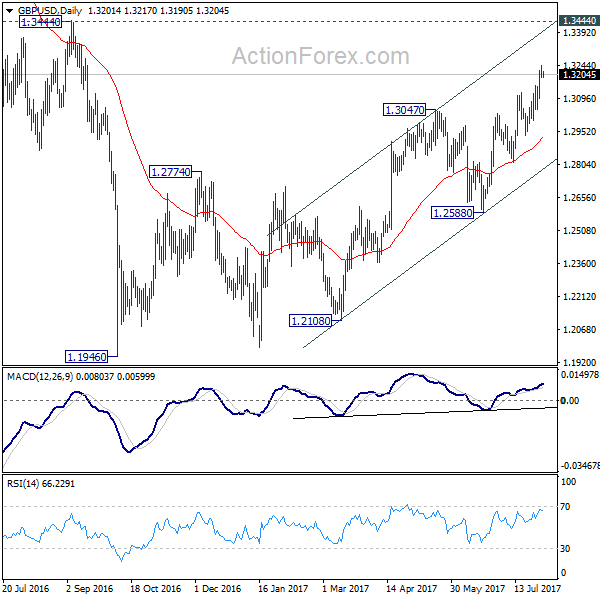
GBP/USD's rally is still in progress and intraday bias remains on the upside. Current rise could extend towards 1.3444 key resistance. But still, price actions from 1.1946 are viewed as a corrective pattern. Hence, we'll look for topping signal again around 1.3444. On the downside, below 1.3096 minor support will turn bias neutral first. Further break of 1.2932 support will indicate reversal and will turn bias to the downside to target 1.2588 key support next.
In the bigger picture, overall, price actions from 1.1946 medium term low are seen as a corrective pattern that is still in progress. While further upside is expected, larger outlook remains bearish as long as 1.3444 key resistance holds. Down trend from 1.7190 (2014 high) is expected to resume later after the correction completes. And break of 1.2588 will indicate that such down trend is resuming.
USD/CHF Daily Outlook
Daily Pivots: (S1) 0.9630; (P) 0.9657; (R1) 0.9682; More...
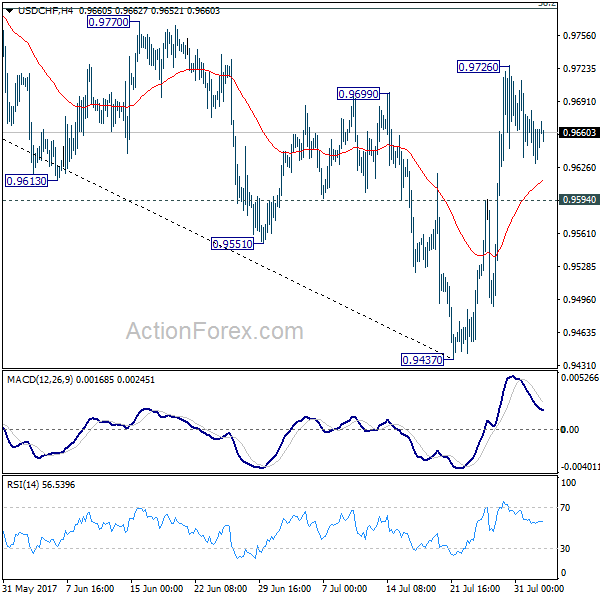
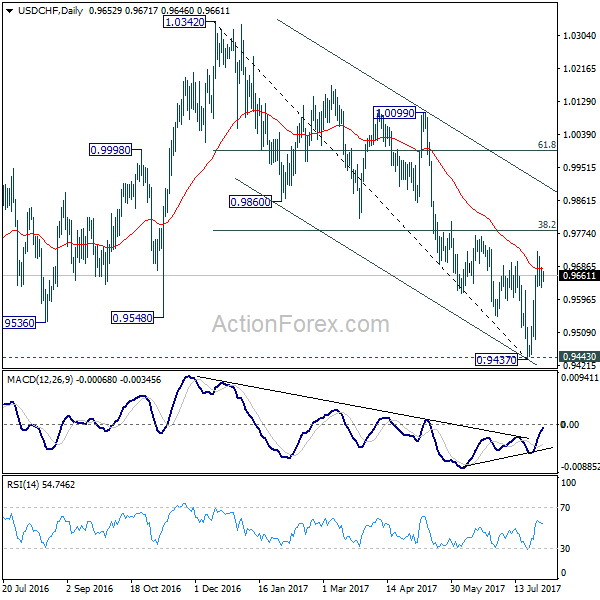
USD/CHF is staying in consolidation below 0.9726 and intraday bias remains neutral. Another rise is expected as long as 0.9594 support holds. Prior break of 0.9699 resistance suggests near term reversal after defending 0.9443 key support. Above 0.9726 will target 38.2% retracement of 1.0342 to 0.9437 at 0.9783 first. Break will target channel resistance (now at 0.9899). However, firm break of 0.9594 will dampen this bullish view and turn bias back to the downside for 0.9437.
In the bigger picture, current development argues that USD/CHF has successfully defended 0.9443 key support level. And long term range trading in 0.9443/1.0342 is extending with another rise. At this point, there is no sign of an up trend yet. Hence, while further rise is expected in USD/CHF, we'll start to be cautious on loss of momentum above 61.8% retracement of 1.0342 to 0.9437 at 0.9996.
USD/JPY Daily Outlook
Daily Pivots: (S1) 110.00; (P) 110.29; (R1) 110.67; More...
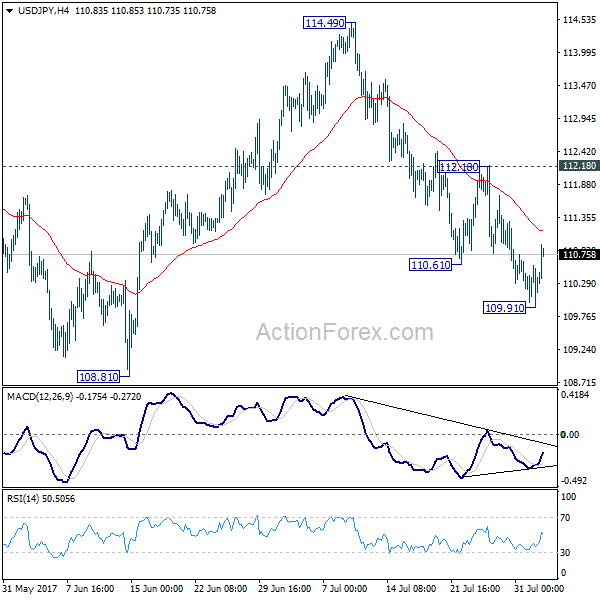
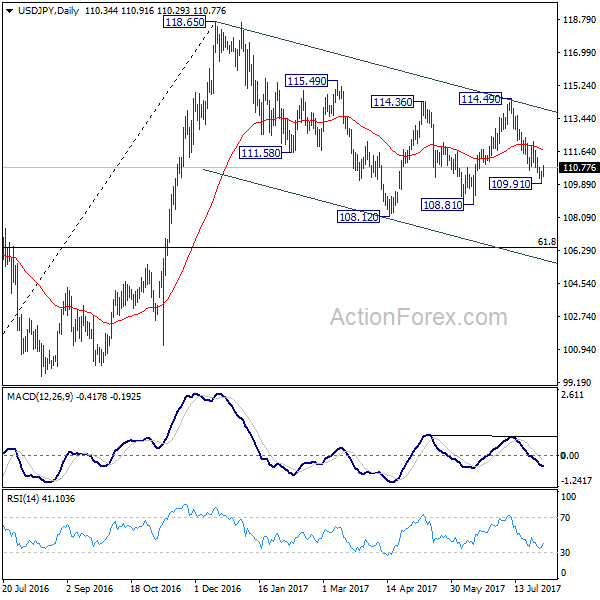
A temporary low is in place at 109.91 in USD/JPY with the current recovery. Intraday bias is turned neutral first. Outlook remains bearish as long as 112.18 resistance holds and another fall is expected. Below 109.91 will target 108.81 support first. Break there will resume whole correction from 118.65 and target 61.8% retracement of 98.97 to 118.65 at 106.48. Nonetheless, break of 112.18 resistance will dampen this bearish view and turn focus back to 114.49 resistance instead.
In the bigger picture, the corrective structure of the fall from 118.65 suggests that rise from 98.97 is not completed yet. Break of 118.65 will target a test on 125.85 high. At this point, it's uncertain whether rise from 98.97 is resuming the long term up trend from 75.56, or it's a leg in the consolidation from 125.85. Hence, we'll be cautious on topping as it approaches 125.85. If fall from 118.65 extends lower, down side should be contained by 61.8% retracement of 98.97 to 118.65 at 106.48 and bring rebound.