
Sample Category Title
Dollar Steady Despite ADP Employment Missed Expectations, Euro Remains the Strongest One
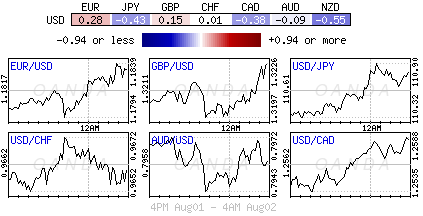
Dollar is steady in early US session and is little affected by job data miss. The ADP employment report showed 178k growth in private sector jobs in July, below expectation of 190k. DOW futures also stay steady and the index could have a go at 22000 handle today as recent rally extends. Non-farm payroll to be released on Friday is a key event to watch. And it's expected to show 180k growth overall in July. But the fate of dollar will rely heavily on what fiscal policy US President Donal Trump can push through. It's widely known that no the healthcare bill collapsed, tax reform is the next priority. Trump and the Republicans are targeting to complete it by year end. But so far, there is no details on it and there are reports of griefs from Republicans on the issue. Staying in the forex markets, Euro remains the strongest one after PPI data beat expectation. Sterling comes second but it could be vulnerable on tomorrow's BoE super Thursday. New Zealand Dollar extends the post job data weakness. Canadian Dollar is trading softer as WTI is unable to regain 50 handle yet.
UK construction PMI dropped to 11 month low
UK construction PMI dropped sharply to 51.9 in July, down from 54.8 and missed expectation of 54.0. That's also the lowest level in 11 months. Markit noted that "the combination of weaker order books and sharply rising construction costs provides a concern that an extended soft patch for the construction sector may be on the horizon." Nonetheless, UK PMI manufacturing released yesterday beat expectation and rose to 55 in the same month. Also from UK, BRC shop price index dropped -0.4% yoy in July. BoE rate decision and quarterly inflation report tomorrow will be the main focus for UK.
Swiss SVME PMI hit six year high
Swiss SVME PMI rose to 60.9 in July, up from 60.1 and beat expectation of 58.8. That's the highest level in six years since February 2011. It's also way above long term average of 53.89. Credit Suisse which compiles the index together with the Swiss SVME, said that "this pleasing development points towards dynamic industrial output in the months to come." Also from Swiss, retail sales rose 1.5% yoy in June, above expectation of 1.3% yoy. SECO consumer confidence improved to -3 in July, meeting consensus.
Also released from Europe, Eurozone PPI dropped -0.1% mom, rose 2.5% yoy in June.
Kiwi pressured after job data
New Zealand Dollar remains the weakest one today as selloff started after worst than expectation job data. New Zealand employment dropped -0.2% qoq in Q2, much weaker than expectation of 0.7% qoq rise. Unemployment rate dropped to 4.8%, down from 4.9%. Private sector labor cost rose 0.4% qoq, in line with consensus. The data affirmed RBNZ's stance to stand pat in the environment of global policy stimulus exit.
Also released earlier in Asian Pacific, Australia building approvals rose 10.9% mom in June. Japan monetary base rose 15.6% yoy in July. Japan consumer confidence rose to 43.8 in July.
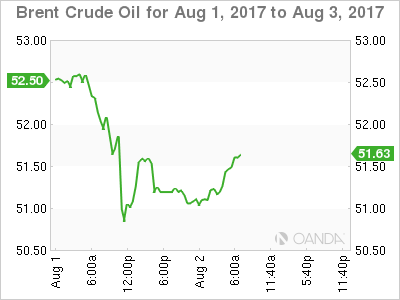
Oil lost 50 on supply worries
Crude oil prices retreated after a 6-day rally, and failed to sustain above 50 handle, upon receiving some hard data pointing to abundant supply. The industry-sponsored API estimated that crude oil inventory increased 1.8 mmb in the week ended July 28. For refined oil products, gasoline and distillate stockpiles fell -4.8 mmb and -1.2 mmb respectively. Separately, a Reuters survey estimated that OPEC output increased 0.09M bpd in July to a 2017 high of 33M bpd. With an output cut compliance level climbing to 84% from 77% in June, the rise was contributed by Libya and Nigeria. The survey suggested that the biggest rise came from Libya, where output rose to an average of more than 1M bpd.
EUR/USD Mid-Day Outlook
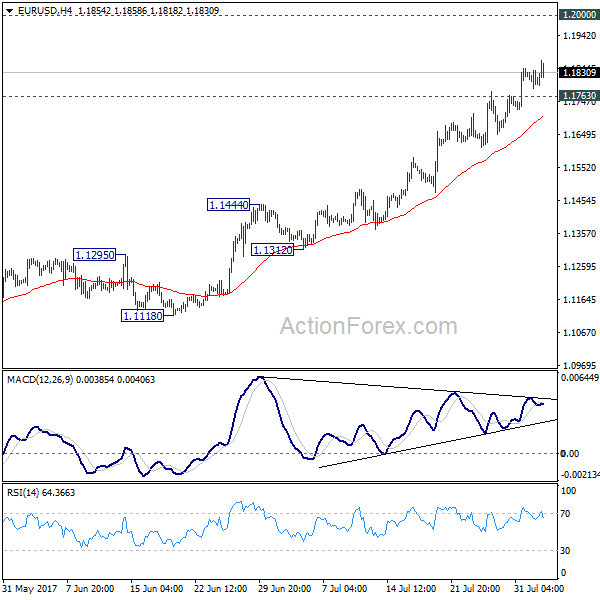
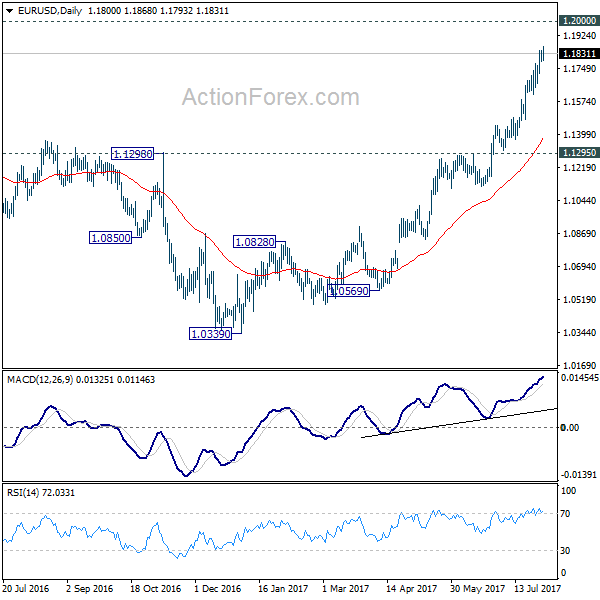
Daily Pivots: (S1) 1.1775; (P) 1.1810 (R1) 1.1835; More...
Intraday bias in EUR/USD remains on the upside as the rise from 1.0339 is still in progress. Such rally would target 1.2 handle next. Firm break there will pave the way to next key fibonacci level at 1.2516. On the downside, below 1.1763 minor support will turn intraday bias neutral and bring consolidation before staying another rally.
In the bigger picture, an important bottom was formed at 1.0339 on bullish convergence condition in weekly MACD. Sustained break of 55 month EMA (now at 1.1760) will pave the way to key fibonacci level at 38.2% retracement of 1.6039 (2008 high) to 1.0339 (2017 low) at 1.2516. While rise from 1.0339 is strong, there is no confirmation that it's developing into a long term up trend yet. Hence, we'll be cautious on strong resistance from 1.2516 to limit upside. But for now, medium term outlook will remain bullish as long as 1.1295 support holds, in case of pull back.
Economic Indicators Update
| GMT | Ccy | Events | Actual | Forecast | Previous | Revised |
|---|---|---|---|---|---|---|
| 22:45 | NZD | Unemployment Rate Q2 | 4.80% | 4.80% | 4.90% | |
| 22:45 | NZD | Employment Change Q/Q Q2 | -0.20% | 0.70% | 1.20% | 1.10% |
| 22:45 | NZD | Labor Cost Private Sector Q/Q Q2 | 0.40% | 0.40% | 0.40% | |
| 23:01 | GBP | BRC Shop Price Index Y/Y Jul | -0.40% | -0.30% | ||
| 23:50 | JPY | Monetary Base Y/Y Jul | 15.60% | 16.60% | 17.00% | |
| 01:30 | AUD | Building Approvals M/M Jun | 10.90% | 1.00% | -5.60% | -5.40% |
| 05:00 | JPY | Consumer Confidence Index Jul | 43.8 | 43.5 | 43.3 | |
| 05:45 | CHF | SECO Consumer Confidence Jul | -3 | -3 | -8 | |
| 07:15 | CHF | Retail Sales (Real) Y/Y Jun | 1.50% | 1.30% | -0.30% | |
| 07:30 | CHF | SVME PMI Jul | 60.9 | 58.8 | 60.1 | |
| 08:30 | GBP | Construction PMI Jul | 51.9 | 54 | 54.8 | |
| 09:00 | EUR | Eurozone PPI M/M Jun | -0.10% | -0.10% | -0.40% | -0.30% |
| 09:00 | EUR | Eurozone PPI Y/Y Jun | 2.50% | 2.40% | 3.30% | 3.40% |
| 12:15 | USD | ADP Employment Change Jul | 178K | 190K | 158K | 191K |
| 14:30 | USD | Crude Oil Inventories | -7.2M |
CAC Unchanged As Eurozone PPI Matches Estimate
In the Wednesday session, the CAC index is almost unchanged. Currently, the index is at 5,123.30, down 0.04% on the day. On the release front, Eurozone PPI declined 0.1%, matching the forecast. On Thursday, France and the Eurozone releases Final Services PMI. We’ll also get a look at consumer spending, with the release of Eurozone Retail Sales.
Eurozone inflation remains mired at low levels, and there was no relief from Eurozone PPI in June. The index declined 0.1%, its second straight decline. The indicator has not managed to post a gain since January. Elsewhere, Eurozone Preliminary Flash GDP posted a respectable gain of 0.6% in the second quarter, the highest gain since the first quarter of 2016. With the German locomotive leading the way, the eurozone economy is showing solid consumer consumption and higher business confidence. Unemployment continues to drop, and the June release of 9.1% marked the lowest unemployment level since 2009. The French economy is also showing improvement and expanded 0.5% in the second quarter, compared to 0.3% in the first quarter.
With the eurozone economy finally flexing some muscle in 2017, there has speculation that the ECB would tighten policy, and this has led to some frenzied buying of euros, much to the consternation of the ECB. At a conference of central bankers in June, ECB President Mario Draghi said that the reflationary forces could result in the bank 'adjusting the parameters' of current stimulus. The comments did not appear to mark a change in ECB policy, but investors seized on the remarks and the euro soared. The ECB was caught off guard, and resorted to the unusual step of stating that the markets had misinterpreted Draghi’s comments. Given that fiasco, it’s a safe bet that the ECB will be ultra-cautious in upcoming statements in order to avoid any repeat convulsions in the markets. At the same time, as we approach the December timeline for winding up QE, the ECB would do well to act in a transparent fashion and let the markets know if the QE program will indeed wind up in December. A lack of transparency could trigger market volatility, which is precisely what ECB policymakers wish to avoid.
Market Update – European Session: India Central Bank Cuts Key Rates By 25 Bps
Overnight
Asia:
Bank of Japan (BoJ) Funo reiterates view that important to continue their current powerful easing as price momentum is still not sufficient for CPI target. Adjustments to its monetary policy are possible at every meeting as board members discuss the benefits and costs of the measure
China FX Regulator SAFE denies report it is examining certain companies; will strengthen financial market supervision (**Note: On Aug 1st SAFE was said to be examining loan guarantees for top dealmakers)
New Zealand Q2 Unemployment Rate hits its lowest level since end-2008 (4.8% v 4.8%e); However; participation rate fell to 70.0% from 70.6% and employment contracted 0.2%
Europe:
National Institute of Economic and Social Research (NIESR): BoE should not wait until Brexit has occurred to raise rates; says central bank will probably raise rates by 25bps in Q1 2018
Americas:
Sen Majority Leader McConnell: looking for way forward on how to raise debt ceiling; held good meeting with Treasury Sec on issue; Senate to take up tax reform in Sept; there will be markups in committee on tax reform. Doubts broad bipartisan work is likely on comprehensive tax reform this fall; tax reform will have to be done through reconciliation (50-vote majority)
US Sec of State Tillerson: US has been trying to apply 'peaceful pressure' on North Korea, but options are limited/ US Govt doesn't blame China for North Korea situation, but would like to see China use economic influence on North Koreans
Senate confirms Christopher Wray as the new FBI Director (as expected)
Energy:
Weekly API Oil Inventories: Crude: +1.78M v -10.2M prior
Economic Calendar
(JP) Japan July Consumer Confidence Index: 43.8 v 43.5e
(CH) Swiss July SECO Consumer Confidence: -3 v -3e
(ES) Spain July Net Unemployment M/M: -26.9K v -68.0Ke
(CH) Swiss July PMI Manufacturing: 60.9 v 58.8e ; highest since Apr 2011
(UK) July Construction PMI: 51.9 v 54.0e (11th month of expansion and lowest since Aug 2016)
Fixed Income Issuance:
(IR) Iraq to sell $1.0B in Mar 2023 note; yield guidance seen in low 7% area
(IN) India sold INR160B vs. INR160B indicated in 3-month and 12-month Bills
(SE) Sweden sold SEK10B vs. SEK10B indicated in 3-month bills; Avg Yield -0.7525% v -0.7977% prior; Bid-to-cover: 1.45x v 1.47x prior
SPEAKERS/FIXED INCOME/FX/COMMODITIES/ERRATUM
Equities
Indices [Stoxx50 -0.3% at 3,463, c -0.5% at 7,330, DAX -0.2% at 12,229, CAC-40 -0.3% at 5,110, IBEX-35 -0.1% at 10,558, FTSE MIB -0.2% at 21,525, SMI +0.8% at 9,107, S&P 500 Futures +0.1%)
Market Focal Points/Key Themes: European stocks opened mixed and tracked lower in session; higher currencies weighed on stocks; oil price dragged on energy stocks; materials underperforming following drops in commodity prices; technology companies supported by results from Apple reported yesterday; financials underperforming after major earnings releases; ThyssenKrupp supported following speculation might be considering a break up as alternative to merger with Tata, upcoming US earnings include Bunge, Cardinal Health and Time Warner
Equities
Consumer discretionary: Takeaway.com TKWY.NL -4.8% (results), Travis Perkins TPK.UK -2.3% (results), William Hill WHM.UK +9.4% (results), Hugo Boss BOSS.DE +6.1% (results), Lufthansa LHA.DE % (results)
Materials: Rio Tinto RIO.AU % (results), DSV DSV.DK % (results)
Industrials: Norsk Skogindustrier NSG.NO +18.6% (press speculation), BAE BA.UK +1.3% (results), Fincantieri FCT.IT -2.6% (update on STX), ThyssenKrupp TKA.DE +0.1% (considering breakup)
Financials: Commerzbank CBK.DE -1.1% (outlook), Vonovia VNA.DE +2.3% (results), Societe Generale GLE.FR -4.4% (results), Standard Chartered STAN.UK -5.0% (earnings)
Technology: Axel Springer SPR.DE +4.9% (earnings), AMS AMS.CH +4.5% (sympathy with Apple)
Speakers
Moody's raised outlook on UK banking sector to stable from negative citing increased resilience
India Central Bank (RBI) Statement noted that its policy stance remained neutral. The decision to cut key rates by 25bps was not unanimous (4-1) with the desenter seeking to keep policy steady. RBI noted that the inflation trajectory to rise from current levels
Russia Econ Min Oreshkin: Russian companies must focus on domestic debt market and reduce their foreign borrowings
Russia July Oil Production at 10.95M bps, +0.6% y/y; Exports 5.4M bps, -1.6% m/m
Currencies
Improving risk sentiment aiding emerging market currencies and European currencies in recent sessions.
EUR/USD hit a fresh 2 1/2 high above 1.1860 with the Euro firmer against other major pairs as well.
The JPY was softer as well. One analyst noted that recent local election defeats by economic reform-minded candidates in Japan suggest PM Abe will now bring in new faces to the cabinet who will, in turn, push hard on 'third arrow' structural reforms. USD/JPY higher by 0.4% at 110.75 area. EUR/JPY cross trying to break above its 200-week average (currently at 130.65). Dealers note that this average has only been crossed 3 times over the past decade and all occasions were followed by significant moves
INR currency (Rupee) moved off its best level after RBI cut its key rates by 25bps. The USD/INR did test 2-year lows ahead of the central bank rate decision at 63.70. Pair at 63.77 just ahead of the NY morning.
Fixed Income
Bund futures trade at 162.78 down 3 ticks recovering slightly after yesterday's sharp gains. Immediate support stands at 162.56 followed by 162.08, while resistance stands at 16.03 then 163.30.
Gilt futures trades at 125.82 down 46 ticks trading back below 126 ahead of the BoE rate decision tomorrow. Support lies at 125.66 low followed by 125.25. Analysts see resistance at 126.47 with continuation targeting 126.67.
Wednesday's liquidity report showedTuesday's excess liquidity rose to a record €1.742T up €57B from €1.685T prior. Use of the marginal lending facility fell to €70M from €253M prior.
Corporate issuance saw $8.4B come to market via 7 issuers, led by Comcast $2.5B 2 part offering and Verizon $3B 16 year senior note offering. This brings weekly issuance up to $15.1B. In the sovereign space analysts see supply amounting to ~€46B in August, which would mark the second lowest supply for 2017.
Looking Ahead
(BR) Brazil Congress's lower house will vote whether to suspend President Temer
05:30 (DE) Germany to sell €3.0B in 0.5% 2027 Bunds - 06:45 (US) Daily Libor Fixing
07:00 (RU) Russia to sell combined RUB35B in 2022 and 2026 OFZ Bonds
07:00 (US) MBA Mortgage Applications w/e July 28th: No est v +0.4% prior
08:00 (HU) Hungary Central Bank (NBH) July Minutes
08:00 (UK) Baltic Dry Bulk Index
08:15 (US) July ADP Employment Change: +190Ke v +158K prior
09:00 (SG) Singapore July Purchasing Managers Index (PMI): No est v 50.9 prior; Electronics Sector Index: No est v 52.1 prior
09:00 (MX) Mexico Jun Leading Indicators M/M: No est v 0.14 prior
09:00 (CL) Chile Jun Retail Sales Y/Y: 4.5%e v 5.6% prior
10:00 (DK) Denmark July Foreign Reserves (DKK): No est v 463.9B prior
10:30 (US) Weekly DOE Crude Oil Inventories
11:00 (CO) Colombia Jun Exports: $2.9Be v $3.4B prior
11:30 (BR) Brazil Weekly Currency Flow data
12:00 (US) Fed's Mester speaks to Community Banking Conference
Technical Outlook: DOW Pressures Psychological 22000 Barrier
Dow Jones contract for September delivery hit fresh all-time high at 21993 on Wednesday, extending steep ascend from higher low at 21443 (24 July) into seventh straight day.
The index was strongly boosted by recent earnings reports and is looking for final break above psychological 22000 barrier which also marks Fibo 200% projection of the bull-leg from 20310 (19 Apr trough).
Break higher would extend current wave C of five-wave cycle from 20477 (18 May higher low) towards its 100% Fibonacci expansion at 22142.
Meanwhile, steep ascend may be interrupted for corrective action as daily indicators are in deep overbought territory, but so far lacking any firmer bearish signal.
Solid supports are offered by rising 10SMA (currently at 21705) and 20SMA (currently at 21587).
Res: 22000, 22142, 22335, 22543
Sup: 21929, 21863, 21705, 21587
Daily Technical Analysis: AUDUSD Bullish POC Zone Should Provide Continuation
The AUD/USD has been in an uptrend with strong rejections off the important POC zones. At this point, we can see a POC zone within 0.7950-70 (trend line, D L3, 61.8,EMA89). If the zone holds, the price should ideally go above 0.7972 (EMA89) and proceed further towards 0.8000 and 0.8020. Break of 0.8025 should target 0.8050-65 zone. However if the price drops below 0.7940, we might see 0.7915 ( D L4/ATR pivot).
W L3 - Weekly Camarilla Pivot (Weekly Interim Support)
W H3 - Weekly Camarilla Pivot (Weekly Interim Resistance)
W H4 - Weekly Camarilla Pivot (Strong Weekly Resistance)
D H4 - Daily Camarilla Pivot (Very Strong Daily Resistance)
D L3 – Daily Camarilla Pivot (Daily Support)
D L4 – Daily H4 Camarilla (Very Strong Daily Support)
POC - Point Of Confluence (The zone where we expect price to react aka entry zone)
USD Finds Some Legs, But…
Wednesday August 2: Five things the markets are talking about
To date, political risks and U.S monetary policy uncertainty have plagued the dollar, while the eurozone's common currency has found support from expectations that the ECB would eventually begin phasing out its 'easy' policy.
Ahead of the U.S open, the EUR (€1.1863) again traded at a new 30-month high, while the 'mighty' dollar trades steady against G10 pairs, halting its recent losing streak as some investors have extended an unwinding of 'short' bets on the currency, particularly against the NZD and CAD dollar currencies. Not helping commodity sensitive pairs are fears of a trade spat between U.S and China that again seems to be simmering.
The neutrals are beginning to question whether the ECB 'hawkish' expectations that are being priced into the market may be premature.
This months Kansas City Fed's Jackson Hole Symposium (Aug 24-26) should be the perfect opportunity for G7 policy makers to communicate clearly their intentions on 'normalizing' policy in a normal economic environment.
Reports today stateside on private employment (ADP 8:15am EDT) and crude oil inventories (EIA 10:30 am EDT) will provide more clues about the direction of U.S economy.
1. Global stocks see mixed results
Mining and oil shares continue to weigh on a number of global bourses overnight, trumping tech stocks supported by Apple's results.
In Japan, the Nikkei share average rallied +0.5% to a 10-day high overnight, supported by strong domestic earnings as well as a rally among Apple's suppliers after yesterday's earning results. The broader Topix index gained +0.4%, supported by the automotive sector earnings.
Down-under, Australia's S&P/ASX 200 Index fell -0.5%, weighed down lower commodity prices, while South Korea's Kospi index added +0.2%.
In Hong Kong, the Hang Seng Index was +0.2% higher, supported mostly by financials and material firms, while the Shanghai Composite Index swung between gains and losses.
In China, stocks slipped, with continued strength in materials shares offset by weakness in small-cap firms. The blue-chip CSI300 index fell -0.3%, while the Shanghai Composite Index lost -0.2%.
In Europe, most indexes are tracking lower ahead of the U.S open. Lower oil prices are dragging on energy stocks, while the material is underperforming following drops in commodity prices. Apple's earnings are supporting the tech sector.
U.S stocks are set to open in the black (+0.1%).
Indices: Stoxx50 -0.3% at 3,463, FTSE -0.5% at 7,330, DAX -0.2% at 12,229, CAC-40 -0.3% at 5,110, IBEX-35 -0.1% at 10,558, FTSE MIB -0.2% at 21,525, SMI +0.8% at 9,107, S&P 500 Futures +0.1%
2. Oil prices retreat for a second session, gold steady
Oil prices continue to retreat from their two-month highs, following a bearish combination of rising U.S inventories, an outage at a European refinery and increasing OPEC production.
Ahead of the U.S open, Brent crude futures are down -11c at +$51.67 a barrel – The price hit +$52.93 on Monday, its highest since late May. U.S West Texas Intermediate (WTI) also fell -11c, to +$49.05 a barrel.
Note: Both contracts dropped sharply Tuesday after Royal Dutch Shell said its +400k bpd refinery in the Netherlands would remain offline for at least the next couple of weeks following a fire.
Adding pressure to prices was yesterday's unexpected rise of +1.8m barrels in U.S crude inventories (API), which has hopes that recent inventory draws signified a tighter inventory market stateside.
Expect the market to take direction from this morning EIA report (10:30 am EDT -3.2m expected drawdown).
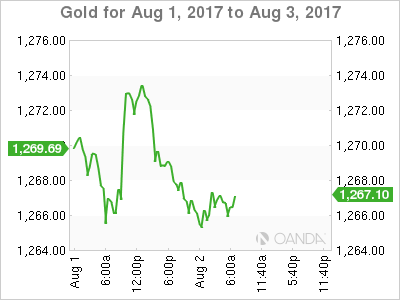
Gold prices (-0.2% to +$1,266.43 an ounce) are edging away from its two-month highs as 'mighty' dollar steadies. The prudent investors will continue to look for further evidence of stronger U.S inflation numbers before they get a little bit more optimistic about a rate hike, which remains a natural headwind for gold prices.
3. Yield curves little changed
Overnight as expected, the Reserve Bank of India (RBI) cut their overnight funds rate (repurchase) by -25 bps to +6% as inflation and economic growth slows.
Note: Consumer-price inflation (CPI) in Asia's third-largest economy slowed to +1.5% in June, well below the +2% bottom of the RBI's target range.
Their accompanying statement noted that their policy stance remained 'neutral.' The decision to cut key rates was not unanimous (4-1) with lone dissenter seeking to keep policy steady. The RBI noted that the inflation trajectory is expected to rise from current levels.
Nevertheless, fixed income futures are pricing in another -25 bps rate cut within the next 12-months.
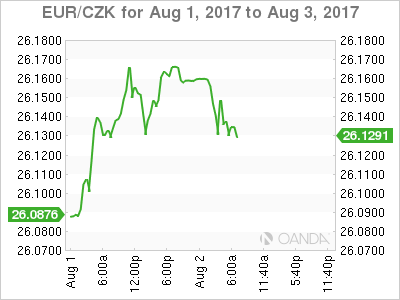
The Czech central bank (CNB) meet tomorrow (07:00 am EDT) and a percentage of the market are preparing itself for a possible hike in the base rate.
Note: A rise in the Czech benchmark rate, which is currently the lowest in Central Europe at +0.05%, would be the first tightening in the region in four years.
Arguments for a 'hike' include solid economic growth of around +3% expected for this year and next and inflation above target, coupled with wages and house prices soaring (EUR/CZK €26.1294).
Elsewhere, the yield on U.S 10-year Treasuries has backed up +2 bps to +2.27%. Germany's Bund 10-year yield rallied +1 bps to +0.50%, while U.K's 10-year Gilt yield advanced +2 bps to +1.24%, the highest in a week.
4. Dollar steady, EUR prints new highs
Improving risk sentiment is aiding emerging market (EM) currencies and Europe's single unit in recent sessions.
Ahead of the U.S open, the EUR managed to print fresh 30-month highs outright at €1.1863, but has since backed off on some profit taking (€1.1833). It continues to trade firmer against other G10 pairs.
The 'big' dollar has also stabilized against most of the majors. The yen is again a tad softer with USD/JPY up +0.7% at ¥110.77 – recent local election defeats by economic reform-minded candidates in Japan suggest PM Abe will now bring in new faces to the cabinet who will, in turn, push hard on his 'third arrow' structural reforms.
Commodity currencies, (C$1.2560, A$0.7955 and NZ$0.7424) are under pressure from lower crude oil, gold and dairy prices.
5. UK July construction PMI falls to 11-month low
U.K data this morning, Purchasing Managers' Index on U.K. construction sector activity fell to its lowest since August 2016 last month, at 51.9, down sharply from 54.8 in June.
According to Markit, which compiles the survey, the July slowdown reflects 'lower volumes of commercial building and a softer expansion of housing activity.'
Digging deeper, the survey also showed reduced new business volumes for the first time in 11-months, while prices for construction materials increased at one of the sharpest rates since H1 2011.
DAX Ticks Lower As Eurozone PPI Declines
The DAX index has recorded small losses in the Wednesday session. In the European session, DAX is trading at 12,239.00, down 0.11% on the day. On the release front, Eurozone PPI declined 0.1%, matching the forecast. On Thursday, Germany and the Eurozone release Final Services PMI, and we'll get a look at Eurozone Retail Sales.
Eurozone inflation remains well below the ECB's target of around 2%, and there was no relief from Eurozone PPI in June. The index declined 0.1%, its second straight decline. The indicator has not managed to post a gain since January. On Tuesday, German indicators were mixed. Manufacturing PMI slowed to 58.1, missing the estimate of 58.3 points. Still, this points to steady expansion in the manufacturing sector. Unemployment Change dropped by 9 thousand, beating the estimate. Germany's labor market remains robust, and unemployment rolls have dropped every month in 2017 but one. Meanwhile, Eurozone Preliminary Flash GDP posted a respectable gain of 0.6%, the highest gain since Q1 of 2016.
With the eurozone economy finally flexing some muscle in 2017, there has speculation that the ECB would tighten policy, and this has led to some frenzied buying of euros, much to the consternation of the ECB. At a conference of central bankers in June, ECB President Mario Draghi said that the reflationary forces could result in the bank “adjusting the parameters” of current stimulus. The comments did not appear to mark a change in ECB policy, but investors seized on the remarks and the euro soared. The ECB was caught off guard, and resorted to the unusual step of stating that the markets had misinterpreted Draghi's comments. Given that fiasco, it's a safe bet that the ECB will be ultra-cautious in upcoming statements in order to avoid any repeat convulsions in the markets. At the same time, as we approach the December timeline for winding up QE, the ECB would do well to act in a transparent fashion and let the markets know if the QE program will indeed wind up in December. A lack of transparency could trigger market volatility, which is precisely what ECB policymakers wish to avoid.
The US dollar has been broadly lower, and even a strong gain from US Advance GDP last week failed to stem the greenback's slide. The first GDP report for the second quarter came in at impressive 2.6%, beating the estimate of 2.5%. This strong expansion should put to rest concerns of a second straight quarter of weak growth – Final GDP came in at just 1.4%. Still, EUR/USD soared in July, gaining 3.5%. Investors remain concerned that low inflation in the US could mean that the Fed will balk and not raise interest rates in December, despite all but promising to increase rates three times in 2017. In June, Fed Chair Janet Yellen dismissed low inflation as “transient”, but she has since changed her tune, as economists remain at a loss to explain why a red-hot economy has not translated into stronger wage growth, and hence higher inflation. The markets are skeptical about a December hike, with the odds at just 42%, according to the CME Group.
Oil Slides Ahead Of Inventory Data
- US futures higher after Apple results, with more companies due to report;
- Commodities drag on Europe as oil slides ahead of inventory figures;
- ADP employment numbers could offer insight ahead of Friday's NFP;
- Two Fed speakers appear as inflation debate hots up.
US indices are on course to open a little higher on Wednesday, buoyed by stronger earnings from Apple on Tuesday and ahead of some important jobs data from ADP which will act as a precursor to Friday's non-farm payrolls number.
It's been a very good earnings season for the US so far and Apple's results were another reminder of this. With futures pointing at a higher open on the back of this, we could be looking at another record day for US stocks, assuming the momentum from second quarter results can be maintained. With another 44 S&P 500 companies reporting on Wednesday, there is certainly scope for another bump higher if companies continue to beat expectations as they have.
One drag on stocks in Europe and possibly in the US later has been the oil moves over the last 24 hours, with Gold, Silver and Copper adding to the downside in the commodities sector. Yesterday's oil drop was initially triggered hours before the inventory data, which added further downside pressure later in the day, and it seems expectations now ahead of the EIA inventory numbers have increased a little.
Last week's substantial decline in inventories – albeit a smaller one than API reported a day earlier – came as reports suggested that Saudi Arabia was cutting exports to the US with the end goal appearing to be to cut inventories and grab markets attention. While this clearly had the desired impact initially, this week's numbers – should EIA report something in line with API – could raise questions about the effectiveness of the measures or whether they're being sustained. As it stands, Brent remains above $50 while WTI is above $47.50, as long as that remains the case, it would appear traders are anticipating further inventory declines.
The ADP employment data will as always be of interest today, particularly as it's one of the few pieces of data we're due to get. While the number itself isn't always as accurate as we'd hope, it could provide insight into whether the July jobs report is going to be good or disappointing. Expectations ahead of the release suggest markets are preparing for another good report on the job creation side, with 185,000 new jobs expected.
We'll also hear from two Fed officials today – John Williams and Loretta Mester – both of whom are not voters on the FOMC this year but will be in 2018. Neither of them are particularly dovish when it comes to interest rates so it will be interesting to see whether they have become so in light of recent inflation data.
EUR/CAD Elliott Wave Analysis
EUR/CAD – 1.4868
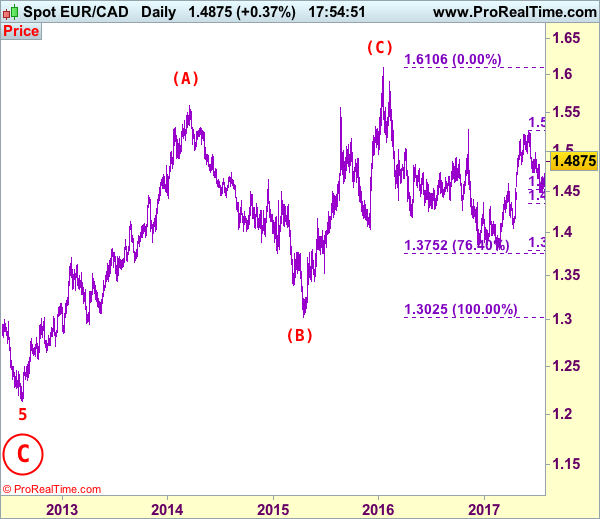
EUR/CAD: Wave 4 ended at 1.4380 and wave 5 as well as circle wave C has possibly ended at 1.2129, major (A)-(B)-(C) correction has commenced and indicated target at 1.6000 had been met.
As euro’s rebound from last month’s low at 1.4478 turned out to be stronger than expected, suggesting the fall from 1.5259 has possibly ended there and consolidation with mild upside bias is seen for a test of resistance at 1.4980, however, a sustained breach above there is needed to add credence to this view, bring further gain to 1.5000, then 1.5100-10, however, reckon near term overbought condition would limit upside to 1.5155-60 and price should falter well below said resistance at 1.5259.
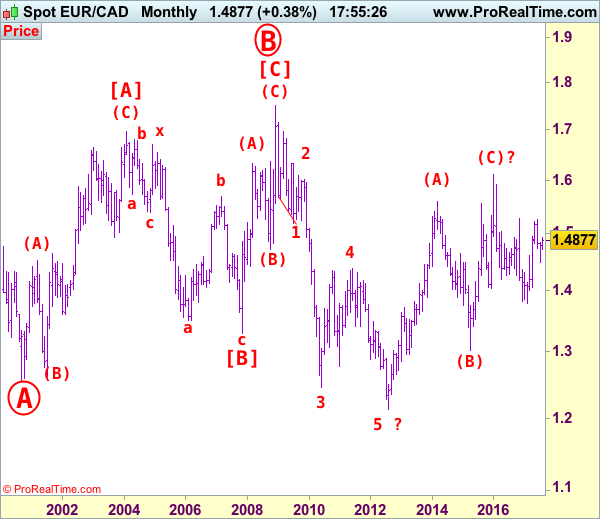
Our latest preferred count is that larger degree wave [C] from 1.3289 as well as circle wave B ended at 1.7509 in Dec 2008 with (A): 1.6325, (B): 1.4719 followed by wave (C) at 1.7509, hence circle wave C is unfolding with wave 1 ended at 1.5186 (diagonal wave 1), wave 2 at 1.6096, impulsive wave 3 has ended at 1.2451, followed by wave 4 at 1.4380, in view of recent strong rebound, we are now treating the wave 5 as well as larger degree circle wave C has ended at 1.2129, hence (A)-(B)-(C) correction has commenced from there with impulsive wave (C) now unfolding and indicated initial upside target at 1.6000 had been met and reckon 1.6500 would hold.
On the downside, whilst initial pullback to 1,4800 and possibly 1.4770 cannot be ruled out, reckon support at 1.4709 would contain downside and bring another rise later. Only a drop below previous resistance at 1.4684 would defer and suggest top is possibly formed, bring weakness to 1.4580-85, once this level is penetrated, this would suggest the rebound from 1.4478 has ended instead, bring further fall to 1.4500-10 first.
Recommendation: Stand aside for this week.
On the bigger picture, our long-term count on the monthly chart is that a big sideways consolidation from 2000 low of 1.2557 has possibly ended at 1.7509 as circle wave B with [A]: 1.6976 ( (A): 1.4513, (B): 1.2612, (C): 1.6976), wave [B]: 1.3289 is a double three with 1st a-b-c: 1.5384, x: 1.6709 and 2nd a-b-c: 1.3289. As indicated above, the wave [C] has ended at 1.7509. The selloff from there is now unfolding which itself should be labeled as an impulsive wave with wave 1: 1.5186 (diagonal wave 1), followed by wave 2: 1.6096 and wave 3: 1.2451, wave 4: 1.4380, wave 5 as well as larger degree circle wave C has possibly ended at 1.2129 and major correction has possibly commenced for retracement of recent decline towards 1.4000, then 1.4180-90 (38.2% Fibonacci retracement of 1.7509-1.2129). Below said support at 1.2129 would risk weakness to psychological support at 1.2000 and then 1.1851 (50% projection of 1.7509-1.2451 measuring from 1.4380) but reckon 1.1500 would remain intact, bring reversal later.
Euro Edges Higher As Eurozone PPI Matches Forecast
EUR/USD has edged higher in the Wednesday session. Currently, the pair is trading at 1.1840, up 0.33% on the day. On the release front, Eurozone PPI declined 0.1%, matching the estimate. The US will post key employment numbers for the remainder of the week, starting with ADP Nonfarm Employment Change. After a slowdown in June, the indicator is expected to rebound to 187 thousand. On Thursday, the US releases two key events – unemployment claims and ISM Non-Manufacturing PMI.
The ECB meets next in early September, and as things currently stand, the bank is expected to hold the course on its ultra-accommodative monetary policy. Currently, ECB interest rates stand at a flat 0.00%, where they have been pegged since March 2o16. Under the bank’s quantitative easing program (QE), the bank has been purchasing assets at a rate of EUR 60 billion/month. The QE program is scheduled to wind up in December, although the ECB has provided itself with some wiggle room, saying that that it could extend the program “if necessary”. With the eurozone economy finally flexing some muscle in 2017, there has speculation that the ECB would tighten policy, and this has led to some frenzied buying of euros, much to the consternation of the ECB. At a conference of central bankers in June, ECB President Mario Draghi said that the reflationary forces could result in the bank “adjusting the parameters” of current stimulus. The comments did not appear to mark a change in ECB policy, but investors seized on the remarks and the euro soared. The ECB was caught off guard, and resorted to the unusual step of stating that the markets had misinterpreted Draghi’s comments. Given that fiasco, it’s a safe bet that the ECB will be ultra-cautious in upcoming statements in order to avoid any repeat convulsions in the markets. At the same time, as we approach the December timeline for winding up QE, the ECB would do well to act in a transparent fashion and let the markets know if the QE program will indeed wind up in December. A lack of transparency could trigger market volatility, which is precisely what ECB policymakers wish to avoid.
The sparkling euro has posted weekly gains for three straight weeks, and even a strong gain from US Advance GDP last week failed to stem the euro rally. The first GDP report for the second quarter came in at impressive 2.6%, beating the estimate of 2.5%. This strong expansion should put to rest concerns of a second straight quarter of weak growth – Final GDP came in at just 1.4%. Still, EUR/USD soared in July, gaining 3.5%. Investors remain concerned that low inflation in the US could mean that the Fed will balk and not raise interest rates in December, despite all but promising to increase rates three times in 2017. In June, Fed Chair Janet Yellen dismissed low inflation as “transient”, but she has since changed her tune, as economists remain at a loss to explain why a red-hot economy has not translated into stronger wage growth, and hence higher inflation. The markets are skeptical about a December hike, with the odds at just 42%, according to the CME Group.