
Sample Category Title
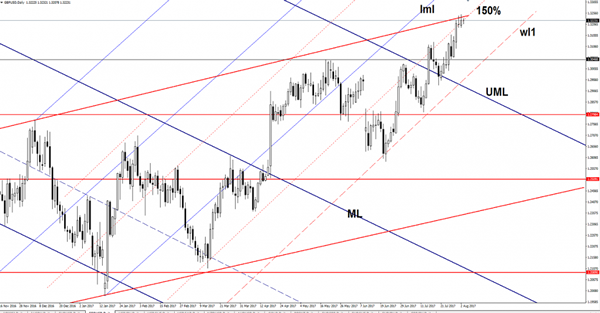
GBP/USD Bounce Or Break?
Price changed little in the morning ahead of the BOE, but most likely we'll have some volatility later, after the UK and US data will be released. GBP/USD stays higher and continues to pressure an important dynamic resistance, we'll see if we'll have a break or a bounce.
Is trading around the 1.3225 level, you should be careful because the fundamental factors will take the lead in the upcoming hours. Technically, the rate has found strong resistance again and could slip lower, but remains to see what impact will have the economic figures.
The Bank of England will release the Official Bank Rate later, which is expected to remain unchanged at 0.25%, while the Asset Purchase Facility should stay steady at 435B as the MPC members are expected to vote unanimously for this decision.
BOE Gov Carney's speech could bring life on the GBP/USD, the Cable could drop on a dovish speech, but is premature to say what will really happen
GBP/USD has found temporary resistance at the upside line of the ascending channel (up sloping red line) and now looks undecided. Don't worry because the economic data will bring us a clear direction. Looks like that the rate has developed a minor Rising Wedge pattern, but this is far from being confirmed, so the perspective remains bullish despite a minor drop.
A rejection from the up sloping red line will send the rate towards the warning line (wl1), where is expected to find support again. However a breakout above the red line will confirm a further upside movement, the next upside target will be at the lower median line (lml).
USD Bears
On Wednesday, St. Louis Federal Reserve President Bullard (a non-voting member of the FOMC) stated in an interview that he, 'is opposed to further U.S. interest rate increases by the Federal Reserve' and warned 'that more hikes could hinder domestic inflation from achieving the Fed's 2% goal'. Also on Wednesday, Cleveland Fed President Mester (another non-voting FOMC member) commented that 'the Fed is tightening monetary policy at such a gradual pace that it doesn't have to change course even with signs of weakness in economic and inflation data'. Such comments add further confirmation to the markets that USD will remain under pressure as many central banks (excluding non-voting FOMC members!) are looking to move away from easy monetary policies. There may be some respite for USD today, as the markets await several key economic data releases (see below) ahead of Friday's, always impactful, Non-Farm Payrolls.
EURUSD hit new 2-and-a-half-year highs on Wednesday, trading up to a high of 1.19089, before retracing lower. EURUSD is trading around 1.1850.
USDJPY gained 0.4% on Wednesday, reaching a high of 110.977, before retracing as the session closed. Currently, USDJPY is trading around 110.70.
GBPUSD advanced 0.3% to reach an 11-month high of 1.32496 on Wednesday. The markets will be paying attention to GBP on this 'Super Thursday', with a host of UK data releases and BoE Governor Carney due to speak. Currently, GBPUSD is trading around 1.3230.
Gold improved 0.3% on Wednesday to trade as high as $1,272.69. Overnight, Gold has given back much of its recent gains to currently trade around $1,263.
Oil prices rebounded on Wednesday, after falling toward session lows of $48.61pb on data that showed a smaller drawdown in US crude inventories than the market had expected. The drawdown of 1.527 million bettered the expected drawdown of 2.957 million, indicating demand is still relatively strong. WTI is currently trading around $49.50pb.
At 12:00 BST a plethora of UK data will be released from the Bank of England; Asset Purchase Facility, Monetary Policy Statement, Quarterly Inflation Report and MPC Vote information. The markets are not expecting any major monetary changes, although will be looking for any hawkish comments and the timing of future rate hikes.
At 12:30 BST, Bank of England Governor Carney is scheduled to make a statement following the release of the above reports. Again, markets will be looking for any change in 'tone' as an indication as to future UK Monetary Policy.
At 13:30 BST, the US Department of Labor will release Initial Jobless Claims (Jul 28) & Continuing Jobless Claims (Jul 21). Initial Jobless Claims are forecast to come in at 242K (previously 244K) and should provide support to a steadily growing US job market. A higher release will likely cause more USD selling, whereas the markets will only react favourably to USD if the release is significantly lower.
At 14:45 BST, the US Services Purchasing Managers Index (PMI) will be released. The consensus calls for an unchanged release of 54.2. The markets will hope to see an improvement as a suggestion that the US economy is growing.
At 15:00 BST, the US Census Bureau will release Factory Orders (MoM) (Jun). The consensus calls for a significant improvement on the previous release of -0.8% to 2.8%. A reading higher than 2.8% will give credibility to a strengthening US economy. If the release is lower the market will take a bearish stance on USD.
Market Update – Asian Session: Markets Weaker Heading Into Key Global Economic Figures
Asia Summary
Equities markets opened slightly lower across the region. AUD/USD saw some weakness falling to 0.7915 after June trade balance figures came in at a lower than expected surplus or A$856M, exports also fell 1%. China Caixin services PMI slightly fell m/m to 51.5 while composite rose to 51.9 form 51.1. The PBOC adjusted its open market operations (OMO) by just injecting 7-day reverse repos and skipped 14-day operations. Costco SSS, ex-gas rose 5.3%. S&P warned that there is more risk to Australia's sovereign rating than in the past; reminder S&P Has Australia sovereign rating at AAA, outlook negative.
Markets seem to be cautious ahead of BOE rate decision later today and US jobs report Friday morning. In tomorrow’s session Australia will release RBA’s statement on monetary policy, with the key focus to be on the wording about the A$ and its impact on the economy and inflation.
Key economic data
(AU) AUSTRALIA JUN TRADE BALANCE (AUD): 856M V 1.8BE (8TH CONSECUTIVE SURPLUS)
(CN) CHINA JULY CAIXIN PMI SERVICES: 51.5 V 51.6 PRIOR; PMI COMPOSITE: 51.9 V 51.1 PRIOR
(KR) South Korea Jun Current Account Balance: $7.0B v $5.9B prior; Balance of Goods (BOP): $9.7B v $8.8B prior
(AU) AUSTRALIA JULY AIG PERFORMANCE OF SERVICES INDEX: 56.4 V 54.8 PRIOR
(JP) JAPAN JULY PMI SERVICES: 52.0 V 53.3 PRIOR; PMI COMPOSITE: 51.8 V 52.9 PRIOR
(NZ) New Zealand July ANZ Commodity Price: -0.8% v 2.1% prior
Speakers and Press
China
(CN) China insurance regulator CIRC: No plan for Anbang to sell overseas assets
(CN) China Finance Ministry (MOF) has become concerned public-private partnerships (PPPs) for infrastructure investment are being used to disguise local government borrowing – FT
(CN) China may accelerate debt to equity swaps in H2 - Financial News
(CN) China Commerce Ministry (MOFCOM) Gao: Hope China and the US can continue on a path of cooperation; Reminder: Am un-named US government official said President Trump’s administration may be on the cusp of increasing its threats against China on trade
Japan
(JP) Japan Fin Min Aso: The economy is not bad, oil prices are bringing down inflation
Asian Equity Indices/Futures (00:00ET)
Nikkei -0.2%, Hang Seng -0.1%, Shanghai Composite -0.2%, ASX200 -0.4%, Kospi -1.5%
Equity Futures: S&P500 -0.1%; Nasdaq100 0.0%, Dax -0.1%, FTSE100 -0.2%
FX ranges/Commodities/Fixed Income (00:00ET)
EUR 1.1858-1.1834; JPY 110.83-110.57; AUD 0.7967-0.7914; NZD 0.7430-0.7392
Aug Gold -0.8% at 1,261/oz; Sept Crude Oil -0.3% at $49.44/brl; Sept Copper +0.2% at $2.89/lb
USD/CNY *(CN) PBOC SETS YUAN REFERENCE RATE AT: 6. 7211 V 6.7205 PRIOR
(CN) China PBOC OMO injects CNY60B in 7-day reverse repos v CNY120B prior in 7-day and 14-day reverse repos
JGB (JP) Japan MoF sells ¥400B v ¥400B indicated in 10-yr 0.10% inflation-indexed bonds, bid to cover 3.19x
Equities notable movers
Hong Kong/China
Standard Chartered, 2888.HK, Reports H1 adj pretax profit $1.92B v $1.81Be, op income $7.2B v $7.23Be; Declares no dividend; -6.9%
Japan
Furukawa Electric, 5801.JP Reports Q1 Net ¥6.8B v ¥2.3B y/y; Op ¥10.4B v ¥4.7B y/y; Rev ¥224.9B v ¥196.2B y/y; +12.6%
Korea
GS Retail,007070.KR Reports Q2 (KRW) Net 42.0B v 59.8Be; Op 53.1B v 74.4Be; Rev 2.09T v 2.09Te; -12.8%
Australia
Suncorp, SUN.AU Reports FY17 Net profit A$1.08B v A$1.13Be, Cash profit A$1.15B v A$1.20Be; -6.5%
Commonwealth Bank of Australia, CBA.AU Austrac initiated civil penalty proceedings in federal court against CBA for “serious and systemic non-compliance” with anti-money laundering and counter-terrorism financing laws; +0.5%
US markets on close: Dow +0.2%, S&P500 +0.1%, Nasdaq flat, Russell -1.1%
The Dow Jones Index Closed Above 22,000 For The First Time Ever
Market movers today
Focus today will be on the Bank of England (BoE) meeting, with the subsequent press conference of Governor Carney and the publication of a new Inflation Report . We expect the BOE to vote 6-2 in favour of keeping the Bank Rate unchanged and west ill do not expect a rate hike before some time in 2019. We believe the BoE will revise down its optimistic GDP growth projection and we also expect it to announce that the Term Funding Scheme (TFS) will end in February 2018.
After the decline in the UK Construction PMI released yesterday, today's Services PMI for July will be watched closely for further signs of the expected economic slowdown in the UK.
In the US, non-manufacturing ISM is due out and weestimate the index to have moderated slight ly to 56.5 in July, in line with the observed drop in the manufacturing ISM.
In Scandinavia, the Services PMI in Sweden is due to be released. Norwegian house prices will also be watched closely for any further signs of weakness, which could prompt speculation on further Norges Bank stimulus.
Selected market news
The highlight of the week will be the US labour report tomorrow. Yesterday, we got the ADP report which can sometimes give an indication of the direction of the report. The ADP report showed solid job growth of 178,000 in July and June was revised higher from 158,000 to 191,000. It bodes well for the labour market on Friday, but remember that the ADP report is not always the best indicator of actual job growth.
After a strong Tuesday in global equity markets, we saw some profit taking in Europe yesterday, and most indices ended the day in the red. The sentiment was slightly better in the US as the 5% gain in Apple led indices higher. The Dow jones index closed above 22,000 for the first time ever.
The market is following Fed comments closely as the FOMC is widely expected to start reducing its balance this autumn. The Fed's James Bullard on the one side who is a known ‘dove' said yesterday that he is concerned about the soft inflation data. On the other side, we had less ‘dovish' comments from the Fed's John Williams and Loretta Mester, who both argue that inflation will reach the 2% target over the coming years.
The US debtceiling is an ongoing concern for the US market . The US Treasury said yesterday in its Q3 refunding statement that it is able to fund the government until the end of September. Treasury Secretary Steven Mnuchin said a few days ago in a letter to Congress that it was critical to act no later than 29 September. In respect of the refunding statement , note that it was said at the press conference that the US Treasury is still looking at the possible introduction of ultralong bonds (50Y bonds), but there was no announcement on the topic.
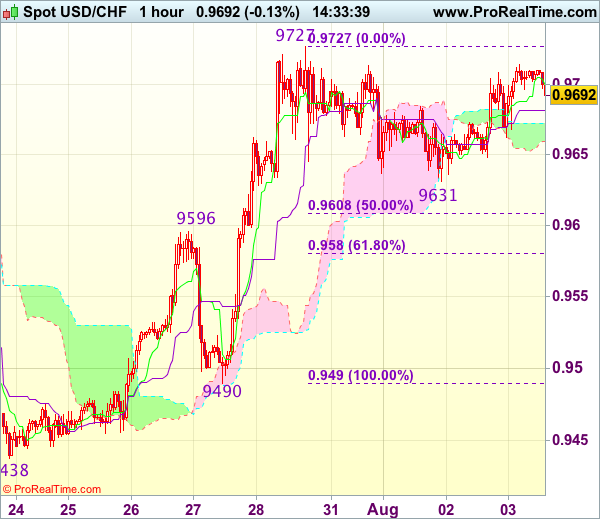
Trade Idea : USD/CHF – Buy at 0.9600
USD/CHF - 0.9691
Most recent candlesticks pattern : N/A
Trend : Near term up
Tenkan-Sen level : 0.9699
Kijun-Sen level : 0.9681
Ichimoku cloud top : 0.9672
Ichimoku cloud bottom : 0.9660
Original strategy :
Buy at 0.9600, Target: 0.9700, Stop: 0.9565
Position : -
Target : -
Stop : -
New strategy :
Buy at 0.9600, Target: 0.9700, Stop: 0.9565
Position : -
Target : -
Stop : -
Although the greenback rebounded after finding support at 0.9631, break of indicated resistance at 0.9727 is needed to signal recent upmove has resumed and extend gain to 0.9750-60, then 0.9780, however, near term overbought condition should limit upside to 0.9800-10, bring retreat later. If said resistance at 0.9727 continues to hold, then further consolidation would take place and another retreat to 0.9650 and 0.9631 cannot be ruled out but 0.9596 (previous resistance turned support) should limit downside and bring another rise later.
In view of this, would not chase this rise here and would be prudent to buy dollar on subsequent pullback as previous resistance at 0.9596 should turn into support and contain dollar’s downside. Below 0.9580 (61.8% Fibonacci retracement of 0.9490-0.9727) would defer and suggest a temporary top is formed instead, bring correction to 0.9540-50 but price should stay well above support at 0.9490, bring another rise later.
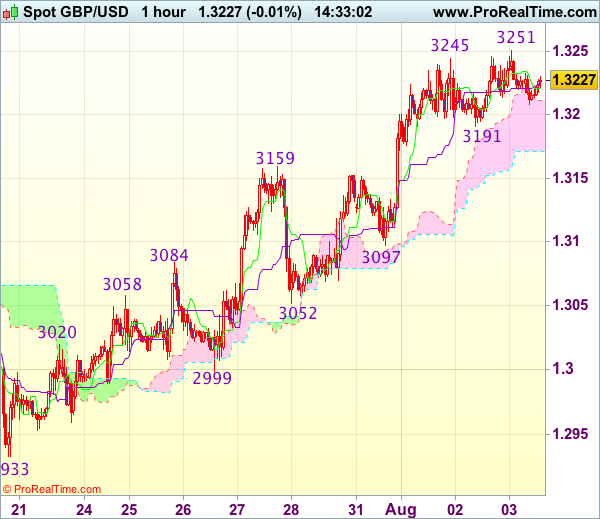
Trade Idea : GBP/USD – Buy at 1.3130
GBP/USD - 1.3221
Most recent candlesticks pattern : N/A
Trend : Near term up
Tenkan-Sen level : 1.3221
Kijun-Sen level : 1.3227
Ichimoku cloud top : 1.3211
Ichimoku cloud bottom : 1.3171
Original strategy :
Buy at 1.3130, Target: 1.3230, Stop: 1.3095
Position : -
Target : -
Stop : -
New strategy :
Buy at 1.3130, Target: 1.3230, Stop: 1.3095
Position : -
Target : -
Stop : -
As cable has eased after marginal rise to 1.3251, suggesting minor consolidation below this level would be seen and pullback to 1.3191 support cannot be ruled out, however, reckon downside would be limited to 1.3150-60 and 1.3125-30 should hold, bring another rise later, above said resistance at 1.3251 would extend gain to 1.3275-80 but near term overbought condition should prevent sharp move beyond there and reckon 1.3300-10 would hold from here, risk from there has increased for a retreat to take place later.
In view of this, would not chase this rise here and would be prudent to buy cable on pullback as 1.3125-30 should contain downside, bring another upmove later. Only below indicated support at 1.3097 would abort and signal a temporary top is possibly formed, bring further fall towards previous support at 1.3052.
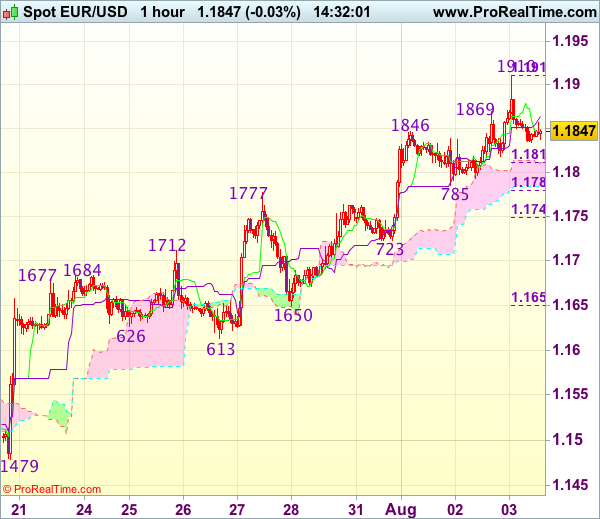
Trade Idea : EUR/USD – Sell at 1.1880
EUR/USD - 1.1845
Most recent candlesticks pattern : N/A
Trend : Near term up
Tenkan-Sen level : 1.1846
Kijun-Sen level : 1.1864
Ichimoku cloud top : 1.1812
Ichimoku cloud bottom : 1.1785
Original strategy :
Sold at 1.1850, stopped at 1.1885
Position : - Short at 1.1850
Target : -
Stop : - 1.1885
New strategy :
Sell at 1.1880, Target: 1.1780, Stop: 1.1915
Position : -
Target : -
Stop : -
Although the single currency extended recent upmove to 1.1910 yesterday, the subsequent retreat suggests consolidation below this level would be seen and mild downside bias is for weakness to 1.1810-15, however, break of 1.1780-85 (50% Fibonacci retracement of 1.1650-1.1910 and previous support) is needed to signal top is formed, bring retracement of recent rise to 1.1745-50 (61.8% Fibonacci retracement) but support at 1.1723 would remain intact.
In view of this, we are looking to sell euro on recovery as 1.1880-85 should limit upside. Above said resistance at 1.1910 would signal recent upmove is still in progress and may extend headway to 1.1940-50 and possibly towards 1.1970-75 before correction takes place.
Trade Idea : USD/JPY – Hold short entered at 110.90
USD/JPY - 110.60
Most recent candlesticks pattern : N/A
Trend : Near term down
Tenkan-Sen level : 110.70
Kijun-Sen level : 110.63
Ichimoku cloud top : 110.52
Ichimoku cloud bottom : 110.42
Original strategy :
Sold at 110.90, Target: 109.90, Stop: 111.00
Position : - Short at 110.90
Target : - 109.90
Stop : - 111.00
New strategy :
Hold short entered at 110.90, Target: 109.90, Stop: 111.00
Position : - Short at 110.90
Target : - 109.90
Stop : - 111.00
As the greenback has rebounded after finding support at 110.28, suggesting further consolidation would be seen, however, as long as resistance at 110.98 (yesterday’s high) holds, bearishness remains for another retreat, below said support at 110.28 would suggest the rebound from 109.92 has ended, bring retest of this level later. A break there would confirm recent selloff from 114.50 top has resumed and extend weakness to 109.70–75 but loss of downward momentum should limit downside to 109.50.
In view of this, we are holding on to our short position entered at 110.90. Above 111.05-10 (50% Fibonacci retracement of 112.20-109.92) would defer and risk test of 111.29 resistance but only break there would signal a temporary low has been formed instead, bring rebound to 111.50-55 first.

Australia’s Trade Surplus Sharply Narrowed In June, Services Sector Activity Rose In July
For the 24 hours to 23:00 GMT, the AUD declined 0.05% against the USD and closed at 0.7958.
LME Copper prices declined 0.01% or $0.5/MT to $6300.0/MT. Aluminium prices rose 0.9% or $17.0/MT to $1904.0/MT.
In the Asian session, at GMT0300, the pair is trading at 0.7933, with the AUD trading 0.31% lower against the USD from yesterday's close, following downbeat trade balance data in Australia.
Australia's seasonally adjusted trade surplus narrowed more-than-expected to a level of A$856.0 million in June, amid a drop in exports. The nation had recorded a revised surplus of A$2024.0 million in the previous month, while markets were expecting it to narrow to a level of A$1800.0 million. On the other hand, the nation's AiG performance of services index registered a rise to a level of 56.4 in July, compared to a reading of 54.8 in the previous month.
Elsewhere in China, Australia's largest trading partner, the Caixin/Markit services PMI eased to a level of 51.5 in July. In the prior month, the PMI index had recorded a reading of 51.6.
The pair is expected to find support at 0.7901, and a fall through could take it to the next support level of 0.7869. The pair is expected to find its first resistance at 0.7979, and a rise through could take it to the next resistance level of 0.8025.
Moving ahead, traders will focus on the Reserve Bank of Australia's monetary policy statement and Australia's retail sales data for June, slated to release tomorrow.
The currency pair is trading below its 20 Hr and 50 Hr moving averages.

Euro-Zone’s Producer Prices Grew At Its Weakest Pace This Year In June
For the 24 hours to 23:00 GMT, the EUR rose 0.35% against the USD and closed at 1.1849.
In economic news, data indicated that the Euro-zone's producer price index (PPI) advanced 2.5% on an annual basis in June, meeting market expectations and rising at its weakest pace this year. The PPI had risen by a revised 3.4% in the preceding month.
Macroeconomic data released in the US indicated that ADP's private sector employment climbed less-than-expected by 178.0K in July, after jumping by a revised 191.0K in the prior month and missing market expectations for an advance of 190.0K. Additionally, the nation's MBA mortgage applications slid 2.8% in the week ended 28 July, after recording a gain of 0.4% in the prior week.
Meanwhile, the St. Louis Fed President, James Bullard, stated that he would not be in favour of further rate hikes in the near-term as inflation remains at stubbornly low level. Meanwhile, the San Francisco Fed President, John Williams, signalled that the central bank could start rolling back its $4.5 trillion balance sheet this autumn.
In the Asian session, at GMT0300, the pair is trading at 1.1845, with the EUR trading a tad lower against the USD from yesterday's close.
The pair is expected to find support at 1.1792, and a fall through could take it to the next support level of 1.1739. The pair is expected to find its first resistance at 1.1904, and a rise through could take it to the next resistance level of 1.1963.
Moving ahead, market participants will keep a close watch on the Euro-zone's retail sales data for June and the final Markit services PMI for July across the Euro-zone, slated to release in a few hours. Moreover, traders will eye the US ISM non-manufacturing PMI as well as the final Markit services PMI, both for July coupled with factory orders and durable goods orders, both for June and initial jobless claims data, all slated to release later today.
The currency pair is showing convergence with its 20 Hr moving average and trading above its 50 Hr moving average.
