Sample Category Title
Yen Dips as US Jobless Claims Beats Estimate
USD/JPY has posted slight losses in the Thursday session. In North American trade, the pair is trading at 110.40, down 0.25% on the day. On the release front, US unemployment claims edged lower to 240 thousand in July, beating the estimate of 242 thousand. ISM Non-Manufacturing is next, with the markets expecting the indicator to slow to 56.9 points. Later in the day, Japan releases Average Cash Earnings, which is expected to dip to 0.5%. On Friday, the US releases wage growth and non-farm payrolls, so traders should be prepared for some movement from USD/JPY.
Japan's economy has shown improvement, but the Japanese consumer remains pessimistic about economic conditions. Consumer Confidence moved higher in July, with a reading of 43.8 points. This marked a 4-month high. The lack of confidence in the economy has resulted in soft borrowing and spending levels. At the same time, manufacturing and housing indicators looked sharp earlier this week. Preliminary Industrial Production rebounded with a strong gain of 1.6%, after a decline of 3.3% a month earlier. As well, Housing Starts gained 1.7%, compared to a reading of -0.3% in May. These numbers underscore a stronger Japanese economy, buoyed by stronger demand for Japanese exports. However, weak inflation levels remain a serious concern. The BoJ's ultra-loose monetary policy has failed to coax inflation upward. At its recent policy meeting, the BoJ again extended its time-frame for reaching its inflation target of 2%. The bank is reluctant to scale back its asset-purchase program, which means that it will likely lag behind other central banks, such as the ECB, in reducing its stimulus program.
Earlier in the year, the Federal Reserve all but promised to raise interest rates three times in 2017. However, the Fed has pressed the rate trigger only twice, and a third hike remains in doubt, with current odds under 50%. Inflation has remained stubbornly low, despite a strong labor market. In June, Fed Chair Janet Yellen said that factors causing weak inflation were "transient", but there are no signs that inflation will pick up anytime soon. With the Federal Reserve unlikely to raise rates before December, investor attention has shifted to the Fed's balance sheet, which stands at $4.2 trillion. Fed policymakers have broadly hinted at reducing purchases of bonds and securities starting in September, but San Francisco Fed President John Williams was more forthcoming about the Fed's plans, likely aimed at giving notice to the markets. In a speech on Wednesday, Williams said that the economy had "fully recovered" from the 2008 financial crisis and called on the Fed to start trimming the balance sheet "this fall". Williams added that the process would be gradual and would take four years to reduce the balance sheet to a "reasonable size". On Wednesday, two other FOMC members also came out in support of starting to taper the balance sheet – St. Louis Fed President James Bullard and Cleveland Fed President Loretta Mester.
Trade Idea Update: EUR/USD – Sell at 1.1880
EUR/USD - 1.1850
Original strategy :
Sell at 1.1880, Target: 1.1780, Stop: 1.1915
Position : -
Target : -
Stop : -
New strategy :
Sell at 1.1880, Target: 1.1780, Stop: 1.1915
Position : -
Target : -
Stop : -
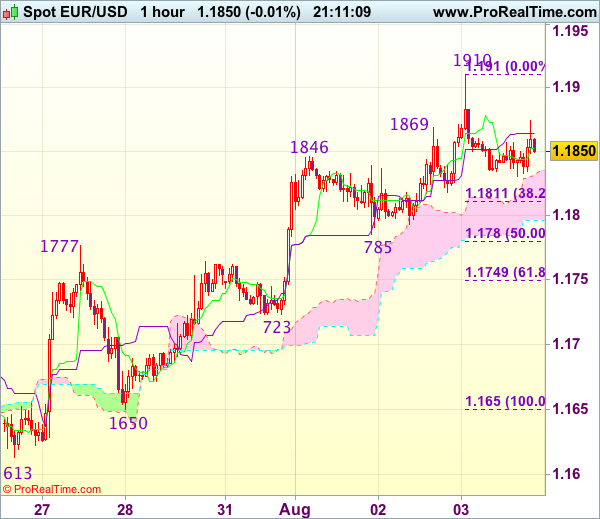
Although the single currency extended recent upmove to 1.1910 yesterday, the subsequent retreat suggests consolidation below this level would be seen and mild downside bias is for weakness to 1.1810-15, however, break of 1.1780-85 (50% Fibonacci retracement of 1.1650-1.1910 and previous support) is needed to signal top is formed, bring retracement of recent rise to 1.1745-50 (61.8% Fibonacci retracement) but support at 1.1723 would remain intact.
In view of this, we are looking to sell euro on recovery as 1.1880-85 should limit upside. Above said resistance at 1.1910 would signal recent upmove is still in progress and may extend headway to 1.1940-50 and possibly towards 1.1970-75 before correction takes place.
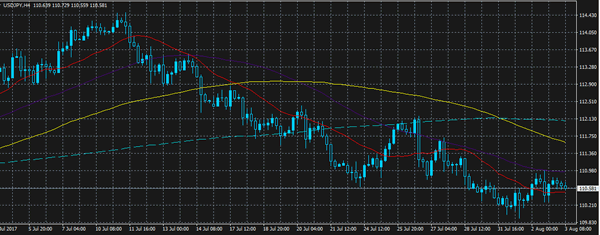
Trade Idea Update: USD/JPY – Hold short entered at 110.90
USD/JPY - 110.48
Original strategy :
Sold at 110.90, Target: 109.90, Stop: 111.00
Position : - Short at 110.90
Target : - 109.90
Stop : - 111.00
New strategy :
Hold short entered at 110.90, Target: 109.90, Stop: 111.00
Position : - Short at 110.90
Target : - 109.90
Stop : - 111.00
As the greenback rebounded after finding support at 110.28, suggesting further consolidation would be seen, however, as long as resistance at 110.98 (yesterday’s high) holds, bearishness remains for another retreat, below said support at 110.28 would suggest the rebound from 109.92 has ended, bring retest of this level later. A break there would confirm recent selloff from 114.50 top has resumed and extend weakness to 109.70–75 but loss of downward momentum should limit downside to 109.50.
In view of this, we are holding on to our short position entered at 110.90. Above 111.05-10 (50% Fibonacci retracement of 112.20-109.92) would defer and risk test of 111.29 resistance but only break there would signal a temporary low has been formed instead, bring rebound to 111.50-55 first.

Sterling Drops after BoE Disappoints
The GBPUSD pair has fallen towards the 1.3150 level, after the Bank of England disappointed financial markets and left rates unchanged. With six MPC members voting to keep interest rates at current levels, and just two dissenting MPC members called for a rate hike.
Further disappointment followed, as the UK inflation report downwardly revised this year's inflation outlook. Sterling earlier hit a 2017 trading high heading into the BOE meeting, reaching 1.3269 against the U.S dollar.
The GBPUSD pair remains bullish in the medium and long term, but bearish in the short term, whilst trading below the 1.3190 level. A move below the 1.3082 level will negate the GBPUSD pairs bullish medium-term outlook.
Key downside technical levels remain 1.3125, 1.3082 and the crucial 1.3047 level.
To the upside, key GBPUSD technical resistance is found at the daily pivot point, at 1.3190. Above this level, traders will look to target the recent gap created on the price charts, located at 1.3230.
Repeated Failure at 110.79 Weighs on USDJPY
The USDJPY pair is currently lacking an intraday direction bias, after a series of price rejections from the critical 110.79 resistance area, which is helping to cap bullish trading momentum.
After setting a weekly price high at the 110.98 level, which also represents the H4 time frame 50 period moving average, the USDJPY has slipped back to test buying demand in the 110.50 region.
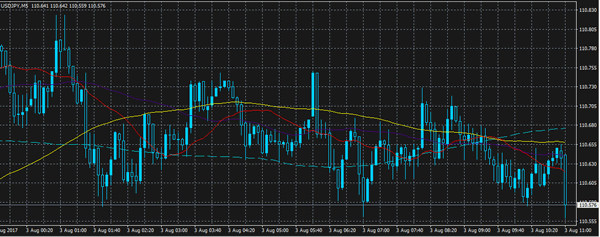
The USDJPY remains bearish on all time frames, and has recently slipped below Thursday's calculated daily pivot point, located at 110.67.
On an intraday basis, technical support for the USDJPY pair is found at the weekly time frame 50 period moving average at 110.44, and the monthly time frame 20 period moving average, at 110.12.
Looking at the USDJPY upside, a series of higher time frame price close above the 110.78 level, holds the key for further bullish advancement towards the 111.05 and 111.38 resistance levels.
Markets Shrug Off BoE Interest Rate Warnings
Sterling came off its highs and yields on UK debt fell on Thursday in response to the Bank of England and Mark Carney's unconvincing attempts to warn traders that markets are behind the curve on interest rate hikes over the next few years.
Despite the repeated warnings in the inflation report and from Carney himself, that expectations of two hikes over the next few years are "insufficient", markets were far more responsive to the more dovish aspects report and press conference. The vote, for example, widened to six against a hike and only two for, which put traders at ease after the gap closed unexpectedly at the last meeting. While the conversation is still going on in the background and the numbers could easily change, it would appear a hike is further away in the near term.
Carney's acknowledgement that the sole cause of above-target inflation is the drop in sterling was cited as another dovish comment, despite the fact that policy makers are voting for a hike in spite of this. Of course, it could perhaps be that traders are only concerned with the near-term expectations of the BoE given its history of bad forecasts and the sheer amount of uncertainty in the economic outlook due to Brexit.
All things considered, today's decision, voting, inflation report and press conference has done little to clear things up and markets response to it would suggest just that. The BoE's attempts to prepare markets for future hikes have fallen on deaf ears for now which could mean volatility in these instruments remains for the foreseeable future as we try to make sense of both the economic and monetary policy environment.
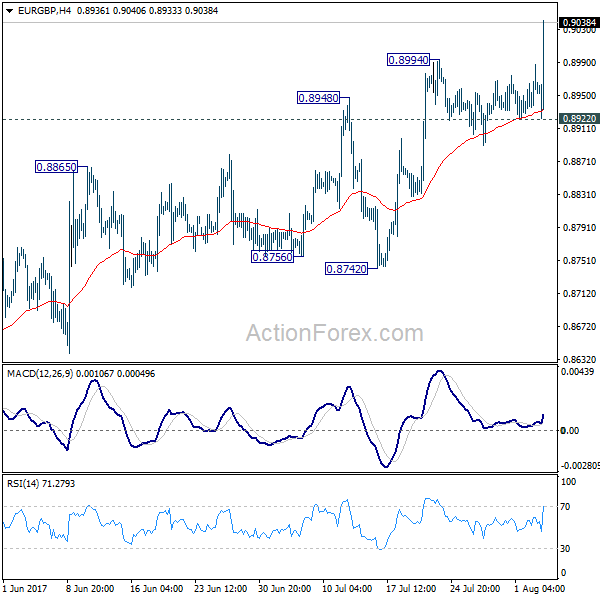
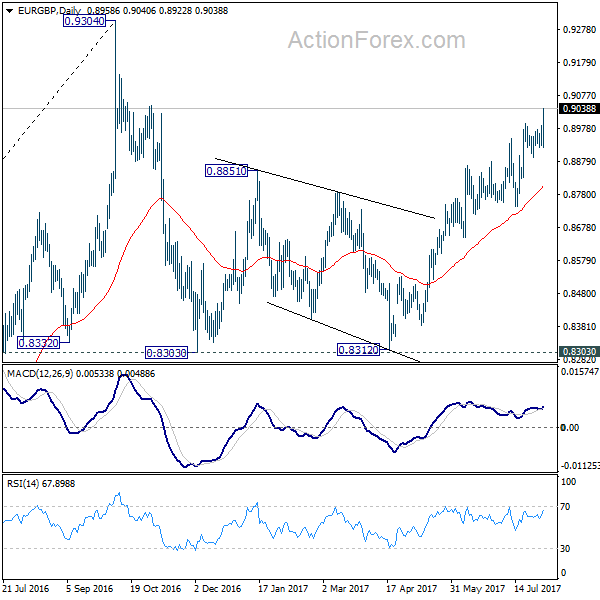
EUR/GBP Mid-Day Outlook
Daily Pivots: (S1) 0.8933; (P) 0.8961; (R1) 0.8991; More
EUR/GBP's rally resumed by taking out 0.8994 firmly and reaches as high as 0.9040 so far. Intraday bias is back on the upside. Current rally from 0.8312 is now extending to 0.9304 key resistance level. At this point, there is no clear sign of up trend resumption yet. Hence, we'll be cautious on strong resistance from 0.9304 to limit upside and bring another fall. However, break of 0.8922 support is needed to be the first sign of short term topping. Otherwise, outlook will remain bullish in case of retreat.
In the bigger picture, price actions from 0.9304 are viewed as a medium term corrective pattern. It's uncertain whether it is finished yet. But in case of another fall, we'd expect strong support from 0.8116 cluster support (50% retracement of 0.6935 to 0.9304 at 0.8120) to contain downside and bring rebound. Whole up trend from 0.6935 is expected to resume after consolidation from 0.9304 completes.
Sterling Drops Sharply as BoE Delivers Generally Dovish Announcement
Sterling tumbles sharply as markets perceive BoE announce as a rather dovish one. BoE left monetary policy unchanged at widely expected. Bank rate is held at 0.25% and asset purchase target at GBP 435b. The rate decision came with 6-2 vote as generally expected. Ian McCafferty and Michael Saunders maintained their push for a 25bps hike. Chief economist Andy Haldane, who sounded hawkish recently, didn't vote for a hike. New comer Silvana Tenreyro didn't follow her predecessor Kristin Forbes and, voted for unchanged.
In the latest forecast, BoE continued to assume "smooth" Brexit and a rate hike by Q3 of 2018. Growth is now projected to be 1.7% in 2017 and 1.6% in 2018. Both were revised down from prior projection of 1.9% and 1.7% respectively. 2019 growth forecast was held unchanged at 1.8%.
Inflation forecast was unchanged except for 2017. Looking at the details, inflation is forecast to average 2.7% in 2017, 2.6% in 2018, 2.2% in 2019. That compare to prior forecast of 2.6% in 2017, 2.6% in 2018 and 2.2% in 2019. That is largely unchanged. Overall, inflation is projected to peak at around 3% in October and then slow back to 2.2% in 2020.
Overall, the announcement came out on the dovish side. Haldane didn't deliver. Tenreyro is not a hawk. Growth is revised down. Inflation is projection is largely unchanged meaning that BoE still believe the surge in inflation earlier this year is temporary. And recent calls for hike were seen as more being nervous than anything.
Technically, EUR/GBP powers through 0.8994 and is resuming it's rally to 0.9304 high. GBP/USD is having is sight back on 1.3 handle. GBP/JPY is heading back to 144 support.
UK PMI services surprised to the upside
UK PMI services rose to 53.8 in July, up from 53.4, above expectation of 53.6. Markit noted that taken together with rise in manufacturing PMI in the same month, UK economy is growing at a "steady but sluggish" quarter of 0.3% in Q3. It also noted that companies face a "relentless burden of inflationary cost pressures" on Sterling's depreciation since the Brexit referendum. Markit chief business economist Chris Williamson warned that "while the current picture remained one of an economy showing overall resilience in the face of concerns about the outlook, the subdued level of business optimism suggests it's likely that growth will at least remain modest and could easily weaken in coming months."
ECB: Wage and consumer goods price drag inflation
ECB noted in the monthly bulletin that wages and price of consumer goods growth are still slow and are holding inflation back in general. It noted that years of low inflation environment are dragging down wage growth. Also, there is still "significant slack in the labor market, weak productivity growth and the ongoing impact of labor market reforms". While foreign price pressure are spreading into Eurozone, "underlying domestic price pressures remain subdued."
From Eurozone, retail sales rose 0.5% mom, 3.1% yoy in June, much better than expectation of 0.0% mom, 2.5% yoy. Eurozone PMI services was finalized at 55.4, unrevised. France PMI services was revised up by 0.1 to 56.0. Germany PMI services was revised down by 0.4 to 53.1. Italy services PMI rose to 56.3 in July, up from 53.6, much stronger than expectation of 54.1.
US-China relations turns sour
On the geopolitical front, US President Donald Trump has become less patient over China's actions, of lack of actions, towards North Korea, a hermit kingdom that has been growing provocative with it missile tests. Trump and China's President Xi Jinping agreed back in May that the latter would increase diplomatic and economic pressure over North Korea, in an attempt to denuclearize the country. However, little effect has been seen so far and North Korea even had two successful tests of ICBM missile over the past month. A CNN report revealed that revised military options for North Korea have been prepared by the US though diplomatic engagement is still preferred.
US-China trade relations have soured since July and it was reported that the US has been preparing broad trade case against China. We believe the triggering point is China's reluctance to confront North Korea over nuclear weapons. Indeed, Trump, since his inauguration in January, has linked US-China trade relations to the North Korean problem. Staying in Asia, China claims India pulled out most troops from Doklam in India and Donglang in China, the tri-junction border shared by China, India, and Bhutan. The standoff has entered its seventh week and neither side appears ready for a war or a compromise.
More in US-North Korea-China Triangle: Intimidation Unlikely to Turn into War.
Elsewhere
US initial jobless claims dropped 5k to 240k in the week ended July 29. Continuing claims rose 3k to 1.96m in the week ended July 22. Australia trade surplus narrowed to 0.86b in June. New Zealand ANZ commodity price dropped -0.8% in July. China Caixin PMI services dropped 0.1 to 51.5 in July.
EUR/GBP Mid-Day Outlook
Daily Pivots: (S1) 0.8933; (P) 0.8961; (R1) 0.8991; More
EUR/GBP's rally resumed by taking out 0.8994 firmly and reaches as high as 0.9040 so far. Intraday bias is back on the upside. Current rally from 0.8312 is now extending to 0.9304 key resistance level. At this point, there is no clear sign of up trend resumption yet. Hence, we'll be cautious on strong resistance from 0.9304 to limit upside and bring another fall. However, break of 0.8922 support is needed to be the first sign of short term topping. Otherwise, outlook will remain bullish in case of retreat.
In the bigger picture, price actions from 0.9304 are viewed as a medium term corrective pattern. It's uncertain whether it is finished yet. But in case of another fall, we'd expect strong support from 0.8116 cluster support (50% retracement of 0.6935 to 0.9304 at 0.8120) to contain downside and bring rebound. Whole up trend from 0.6935 is expected to resume after consolidation from 0.9304 completes.
Economic Indicators Update
| GMT | Ccy | Events | Actual | Forecast | Previous | Revised |
|---|---|---|---|---|---|---|
| 01:00 | NZD | ANZ Commodity Price Jul | -0.80% | 2.10% | ||
| 01:30 | AUD | Trade Balance (AUD) Jun | 0.86B | 1.77B | 2.47B | 2.02B |
| 01:45 | CNY | Caixin China PMI Services Jul | 51.5 | 51.9 | 51.6 | |
| 07:45 | EUR | Italy Services PMI Jul | 56.3 | 54.1 | 53.6 | |
| 07:50 | EUR | France Services PMI Jul F | 56 | 55.9 | 55.9 | |
| 07:55 | EUR | Germany Services PMI Jul F | 53.1 | 53.5 | 53.5 | |
| 08:00 | EUR | ECB Economic Bulletin | ||||
| 08:00 | EUR | Eurozone Services PMI Jul F | 55.4 | 55.4 | 55.4 | |
| 08:30 | GBP | Services PMI Jul | 53.8 | 53.6 | 53.4 | |
| 09:00 | EUR | Eurozone Retail Sales M/M Jun | 0.50% | 0.00% | 0.40% | |
| 09:00 | EUR | Eurozone Retail Sales Y/Y Jun | 3.10% | 2.50% | 2.60% | 2.40% |
| 11:00 | GBP | BoE Rate Decision | 0.25% | 0.25% | 0.25% | |
| 11:00 | GBP | BoE Asset Purchase Target | 435B | 435B | 435B | |
| 11:00 | GBP | MPC Official Bank Rate Votes | 2--0--6 | 2--0--6 | 3--0--5 | |
| 11:00 | GBP | MPC Asset Purchase Facility Votes | 0--0--8 | 0--0--8 | 0--0--8 | |
| 11:00 | GBP | BoE Inflation Report | ||||
| 11:30 | USD | Challenger Job Cuts Y/Y Jul | -37.60% | -19.30% | ||
| 12:30 | USD | Initial Jobless Claims (JUL 29) | 240K | 242K | 244K | 245K |
| 14:00 | USD | ISM Non-Manufacturing Composite Jul | 56.9 | 57.4 | ||
| 14:00 | USD | Factory Orders Jun | 2.80% | -0.80% | ||
| 14:30 | USD | Natural Gas Storage | 17B |
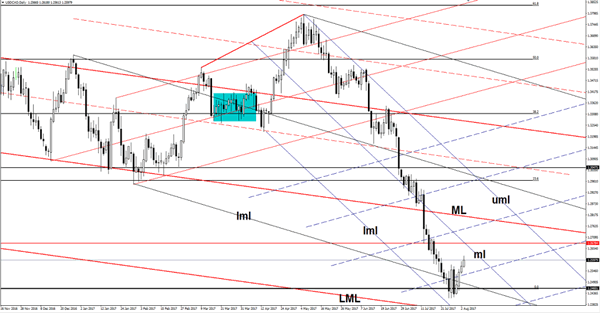
USD/CAD Attracted By Dynamic Resistance
We have a throwback underway on the Daily chart, it's expected to hit the median line (ml) of the minor blue descending pitchfork, where he could find resistance again. Only a breakout above this line will confirm a larger increase in the upcoming period. However, we may have a sideways movement before will recapture enough directional energy for a major increase.
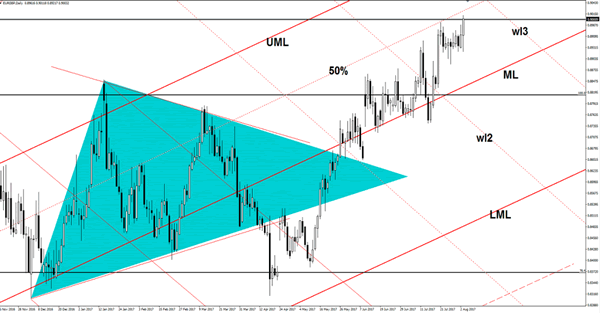
EUR/GBP Shines Again
The bulls have taken full control and have sent the rate above the 0.8993 previous high and now is pressuring the 0.9000 psychological level. A breakout above the static resistance will validate a further increase. We have an important resistance at the 50% Fibonacci line (ascending dotted line), actually could be attracted by the confluence area formed between the 50% line with the warning line (wl3).